Positions for a bioinformatics analyst and a software engineer are available immediately in the Bedford lab at the Fred Hutch. Details for both positions follow:


Bioinformatics Analyst II/III

We have an opening for a bioinformatician in the Bedford lab at the Fred Hutch to work on genomic epidemiology and evolutionary analysis of pathogens such as SARS-CoV-2, seasonal influenza, and other emerging and endemic pathogens. This position will contribute to ongoing work for the Bedford lab and Nextstrain.

Nextstrain is an award-winning project for tracking infectious disease epidemics developed in collaboration with the Neher lab at the University of Basel. Nextstrain won the Open Science Prize in Feb 2017 and has been instrumental in analysis of the SARS-CoV-2 pandemicEbola outbreaksZika spread in the Americas and is used by the World Health Organization to aid in the process of influenza vaccine strain selection. The software we write to power all parts of Nextstrain—bioinformatics, visualizations, analysis pipelines, data management, and more—is entirely open-source and available to the public. We work with public health entities and scientists across the world, both formally and informally, to expand pathogen surveillance capabilities and to improve the automation and robustness of these analyses. Our goal is to empower the wider genomic epidemiology and public health communities to tweak our analyses, create new ones, and communicate scientific insights using the same tools we do.

Responsibilities

This role advances the research aims of the Bedford lab and the Nextstrain team through a combination of independent work, collaboration with scientists and software developers in the group, and interactions with the wider public health and science communities. In this role, the bioinformatician will:

  • Develop and maintain analytic pipelines such as those that clean and ingest genome metadata, build phylogenetic trees, and run forecasting models for SARS-CoV-2 and other pathogens
  • Improve the robustness, automation, and monitoring of our existing pathogen pipelines
  • Develop reproducible pipelines to expand surveillance of endemic and emerging human pathogens, in collaboration with both internal and external groups
  • Participate in community outreach through office hours, discussion forums, and mailing lists
  • Write and maintain thorough documentation on software and pipelines
  • Design software with a diverse range of collaborators and users in mind
  • Contribute to the Nextstrain team’s decision-making and planning processes
  • Present at Bedford lab meetings

Qualifications

Minimum qualifications
  • Master’s degree in bioinformatics, computational biology, biology, or related field with at least three years’ direct experience in computational analysis of large sequence-based molecular data sets.
  • Fluency in at least one high-level programming language, such as Python, R, Ruby, JavaScript, or Perl
  • Familiarity with version control and other software development best practices
  • Experience with workflow managers such as Snakemake, Nextflow, or WDL
  • Knowledge of molecular biology
  • Motivated to learn new skills and technologies and collaborate within an existing team’s practices
  • Excellent written and verbal communication skills
Preferred qualifications
  • Expertise in genomics
  • Knowledge of automated testing and workflows such as GitHub Actions
  • Experience configuring and deploying analyses on a cloud infrastructure

The position is available immediately with flexible starting dates. Informal inquiries are welcome. Applications will be accepted until the position is filled. We offer a competitive salary commensurate with skills and experience, along with benefits. We are committed to improving diversity in the computational sciences. Applicants of diverse backgrounds are particularly encouraged to apply. This is a full-time (40 hours/week) position, but depending on the applicant, could be a salaried employee or contracted hourly consultant. An ideal candidate would be local to the Seattle area or willing to relocate, but remote work is also an option.

To aid in applicant review, a coding sample is requested. We’re happy to review whatever you’re most proud of (in any programming language). If you don’t have code that can be publicly shared, that’s okay. Please apply anyway and just let us know that this isn’t available.

If you think you might be a great fit for this position but are concerned about meeting all qualifications, we’d like to hear from you. Please email Trevor Bedford at tbobfuscate@bedford.io and John Huddleston jhuddlesobfuscate@fredhutch.org.

To apply for this position, please go to the official Fred Hutch listing.


Software Engineer II

The Bedford Lab at the Fred Hutch is seeking a software engineer to work on Nextstrain, an award-winning project for tracking infectious disease epidemics such as the SARS-CoV-2 pandemic, Ebola outbreaks, Zika spread in the Americas, seasonal flu, and other emerging and endemic pathogens. This position will augment our existing team to design, develop, maintain, operate, and support our software and services that empower research scientists and public health practitioners in the lab and around the world.

Nextstrain, developed in collaboration with the Neher Lab at the University of Basel, provides tools for evolutionary analysis of pathogens and genomic epidemiology. We write open source software in a public development style to power all parts of Nextstrain—bioinformatics, visualizations, analysis pipelines, data management, and more—and our analyses use open data whenever possible. We work with public health entities and scientists across the world, both formally and informally, to expand pathogen surveillance capabilities and to improve the automation and robustness of these analyses. Our goal is to empower the wider genomic epidemiology and public health communities to tweak our analyses, create new ones, and communicate scientific insights using the same tools we do.

About the role

This position will be responsible for general software engineering and development work across the entire Nextstrain stack. This includes command-line applications for bioinformatics and data/workflow management (e.g. Augur, Nextstrain CLI), visualization applications for phylogenetics (e.g. Auspice), full-stack web applications for sharing analyses (e.g. nextstrain.org), workflows for data curation and analysis (e.g. ncov-ingest), runtimes for Nextstrain analyses (e.g. docker-base, conda-base), and internal tooling/infrastructure to support all of that.

What we provide

  • Empowerment to craft software that helps protect the world from epidemics and pandemics
  • Thrive in an ecosystem of cross-disciplinary learning, drawing insights from scientists, public health practitioners, and fellow software developers
  • A team that believes in continuous learning and cultivates an environment where all members of the group help each other
  • Opportunity for growth as a software developer in areas of personal interest (e.g. front-end JavaScript, back-end infrastructure, data pipelines, being a project lead, etc.)
  • A team culture that champions a healthy work life balance
  • A competitive compensation package, with comprehensive health and welfare benefits

What you’ll do

  • Design, develop, test, document, and maintain software under a coherent ecosystem
  • Release new versions of packaged programs for installation by users and deploy new versions of hosted services to users
  • Configure and manage cloud infrastructure resources (e.g. AWS, Heroku, Terraform)
  • Create, extend, and troubleshoot automated workflows (e.g. GitHub Actions, Snakemake, Nextflow, WDL)
  • Participate in constructive code review processes with other team members
  • Support internal and external users of software projects via various communication channels

Integrating with an existing team both in-person and online is a key aspect of this position. This position will work daily within a small team of Bedford Lab members and collaborators. The Nextstrain team communicates openly about project and organizational decisions and encourages participation by all team members in decision-making.

Minimum qualifications

  • 3+ years of experience in software engineering
  • Fluency in Python and JavaScript/TypeScript, or fluency in similar languages
  • Proficiency with Linux/Unix and command-line interfaces
  • Proficiency with version control and software development best practices
  • Excellent written and verbal communication skills
  • Motivation to learn and collaborate within an existing team’s practices

The position is available immediately with flexible starting dates. Informal inquiries are welcome. Applications will be accepted until the position is filled. We offer a competitive salary commensurate with skills and experience, along with benefits. We are committed to improving diversity in the computational sciences. Applicants of diverse backgrounds are particularly encouraged to apply. This is a full-time (40 hours/week) position, but depending on the applicant, could be a salaried employee or contracted hourly consultant. An ideal candidate would be local to the Seattle area or willing to relocate, but remote work is also an option.

To aid in applicant review, we request you submit a cover letter, your resume, and a coding sample. For the coding sample, we’re happy to review whatever you’re most proud of (in any programming language). If you don’t have code that can be publicly shared, that’s okay. Please apply anyway and just let us know that this isn’t available.

If you’re interested in this position but are concerned about meeting all the qualifications, we’d like to hear from you. Please email Trevor Bedford at tbobfuscate@bedford.io and Thomas Sibley at tsibleyobfuscate@fredhutch.org.

To apply for this position, please go to the official HHMI listing.

Positions for a bioinformatician and a full-stack developer are available immediately in the Bedford lab at the Fred Hutch. Details for both positions follow:


Bioinformatician

We have an opening for a bioinformatician in the Bedford lab at the Fred Hutch to work on genomic epidemiology and evolutionary analysis of pathogens including SARS-CoV-2, influenza and Ebola virus. This position will contribute to ongoing work on two major projects: Nextstrain and Seattle Flu Study.

Nextstrain is an award-winning tool for tracking infectious disease epidemics developed in collaboration with the Neher lab at the University of Basel. Nextstrain won the Open Science Prize in Feb 2017 and has been instrumental in analysis of the SARS-CoV-2 pandemic, Ebola outbreaks, Zika spread in the Americas and is used by the World Health Organization to aid in the process of influenza vaccine strain selection.

The Seattle Flu Study is a collaboration of groups at the Brotman Baty Institute, the Fred Hutch, the University of Washington, and Seattle Children’s. Already in its third year, this study has produced high-resolution analyses of the spread of SARS-CoV-2 and influenza in Seattle by building a software platform that processes subject and sample metadata, lab assay results, and raw and processed genome data in near-real time.

Responsibilities

The role involves both development and maintenance of bioinformatic analyses and pipelines which underpin both projects’ research aims. This will involve a mixture of independent work, collaboration with scientists in the group and interactions with the wider community. The vast majority of code is open-source. Specific examples from Nextstrain include analytic pipelines that clean and ingest genome metadata, construct consensus genomes, and build phylogenetic trees, as well as tools to enable a diverse range of collaborators to run SARS-CoV-2 analyses through Nextstrain. Work on Seattle Flu Study focuses on pipelines to assemble raw sequence data into consensus SARS-CoV-2 and influenza genomes and deposition of these consensus genomes to public databases.

Interfacing with project collaborators in-person and online is a key aspect of this position. The bioinformatician will work within a small team of existing members of the Bedford lab and the larger research group of the Seattle Flu Study. The Nextstrain team communicates openly about project and organizational decisions and encourages participation by all team members in the decision-making process.

Qualifications

Minimum qualifications
  • Fluency in at least one high-level programming language, such as Python, R, Ruby, JavaScript or Perl
  • Knowledge of molecular biology
  • Motivated to learn new skills and technologies
  • Excellent written and verbal communication skills
Preferred qualifications
  • Expertise in genomics
  • Experience with pipeline or workflow automation
  • Familiarity with software development best practices
  • Experience configuring and deploying analyses on a cloud infrastructure
  • Experience and willingness to participate in team decision-making processes

The Fred Hutch is located in South Lake Union in Seattle, WA and offers a dynamic work environment with cutting-edge science and computational resources. The position is available immediately with flexible starting dates. Informal inquiries are welcome. Applications will be accepted until the position is filled. We offer a competitive salary commensurate with skills and experience, along with benefits. The Fred Hutch and the Bedford lab are committed to improving diversity in the computational sciences. Applicants of diverse backgrounds are particularly encouraged to apply. Depending on the applicant, this position could be a full-time salaried employee, a part-time employee, or a contracted consultant. An ideal candidate would be local to the Seattle area or willing to relocate, but remote work is also an option.

To apply for this position please go to the Fred Hutch Careers Job ID 19821.

To aid in applicant review, a coding sample is requested. We’re happy to review whatever you’re most proud of (in any programming language). If you don’t have code that can be publicly shared, that’s okay. Please apply anyway and just let us know that this isn’t available.

If you think you might be a great fit for this position but are concerned about meeting all qualifications, we’d like to hear from you. Please email Trevor Bedford at tbedfordobfuscate@fredhutch.org or John Huddleston at jhuddlesobfuscate@fredhutch.org.


Full-stack Developer

Position for a full-stack developer is available immediately in the Bedford lab at the Fred Hutch to work on an open-source software platform for genomic epidemiology and evolutionary analysis of pathogens including SARS-CoV-2, influenza and Ebola virus. This position will contribute to ongoing work on Nextstrain, one of the lab’s major projects.

Nextstrain is an award-winning tool for tracking infectious disease epidemics developed in collaboration with the Neher lab at the University of Basel. Nextstrain won the Open Science Prize in Feb 2017 and has been instrumental in analysis of the SARS-CoV-2 pandemic, Ebola outbreaks, Zika spread in the Americas and is used by the World Health Organization to aid in the process of influenza vaccine strain selection.

Responsibilities

This role would be responsible for development work up-and-down the entire Nextstrain software stack and involve both back-end and front-end development. All development occurs in an open-source fashion via github.com/nextstrain. Specific priorities currently include infrastructure and pipelines to ingest and curate genomic data from public databases, optimizing use of cloud computing services to process this data, services to host and share analyses uploaded by Nextstrain users, and development of command line tools for working with Nextstrain. Informatic work focuses on development of the Augur bioinformatics toolkit and pathogen-specific workflows. Front-end work focuses on user functionality at nextstrain.org, including management of cloud computing and storage, as well as visualization improvements to the Auspice visualization JavaScript application. Contributing to documentation on the Nextstrain software stack is a vital responsibility of this position.

Interfacing with project collaborators in-person and online is a key aspect of this position. The developer will work within a small team of existing members of the Bedford lab as well as other contributors to Nextstrain. The Nextstrain team communicates openly about project and organizational decisions and encourages participation by all team members in the decision-making process.

Qualifications

Minimum qualifications
  • Fluency in at least one high-level programming language, such as Python, R, Ruby, JavaScript or Perl
  • Excellent written and verbal communication skills
  • Experience in the following areas:
    • Web development
    • Database systems
    • Cloud infrastructure
    • Software engineering and documentation best practices
Preferred qualifications
  • Experience working with genomic data
  • Systems integration
  • Experience designing effective data visualizations
  • Experience and willingness to participate in team decision-making processes

The Fred Hutch is located in South Lake Union in Seattle, WA and offers a dynamic work environment with cutting-edge science and computational resources. The position is available immediately with flexible starting dates. Informal inquiries are welcome. Applications will be accepted until the position is filled. We offer a competitive salary commensurate with skills and experience, along with benefits. The Fred Hutch and the Bedford lab are committed to improving diversity in the computational sciences. Applicants of diverse backgrounds are particularly encouraged to apply. Depending on the applicant, this position could be a full-time salaried employee, a part-time employee, or a contracted consultant. An ideal candidate would be local to the Seattle area or willing to relocate, but remote work is also an option.

To apply for this position please go to the Fred Hutch Careers Job ID 19820.

To aid in applicant review, a coding sample is requested. We’re happy to review whatever you’re most proud of (in any programming language). If you don’t have code that can be publicly shared, that’s okay. Please apply anyway and just let us know that this isn’t available.

If you think you might be a great fit for this position but are concerned about meeting all qualifications, we’d like to hear from you. Please email Trevor Bedford at tbedfordobfuscate@fredhutch.org or John Huddleston at jhuddlesobfuscate@fredhutch.org.

In this post, we summarize and synthesize the results of our recent efforts to predict influenza evolution as described in Huddleston et al. 2020 and Barrat-Charlaix et al. 2020.

Why do we try to predict seasonal influenza evolution?

Seasonal influenza (or “flu”) sickens or kills millions of people per year. Flu vaccines are one of the most effective preventative measures against infection. However, flu vaccines require almost a year to develop and can only contain a single representative virus per flu lineage (A/H3N2, A/H1N1pdm, B/Victoria, and B/Yamagata). These limitations require researchers to predict which single current flu virus will be the most representative of the flu population one year in the future. The better these predictions are, the more likely the vaccine will prevent illness and death from infection.

How do we think flu evolves?

Flu rapidly accumulates mutations during replication, due to its error-prone RNA polymerase. For most flu genes, most new amino acid mutations will weaken the functionality of their corresponding proteins and reduce the virus’s fitness. For flu’s primary surface proteins, hemagglutinin (HA) and neuraminidase (NA), some amino acid mutations modify binding sites of host antibodies from previous infections. These mutations increase a virus’s fitness by allowing the virus to escape existing antibodies in a process called antigenic drift (Figure 1). Mutations in HA and NA create fitness trade-offs, where beneficial mutations facilitate antigenic drift against a background of deleterious mutations.

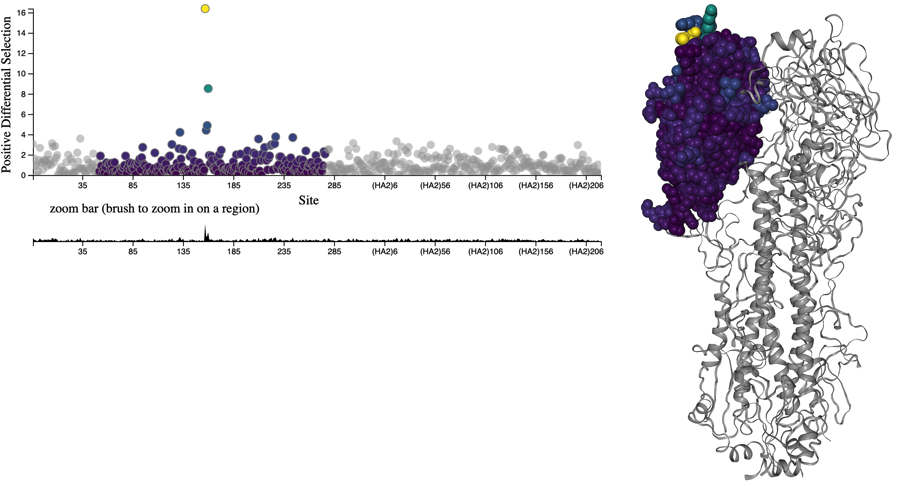
Figure 1. HA accumulates beneficial mutations in its head domain (sites with color) that enable escape from antibody binding and deleterious mutations in its stalk domain (sites in gray) that reduce its ability to infect new host cells. The linear genome view on the left shows how sites from HA’s head domain map to the three-dimensional structure of an HA trimer. The site highlighted in yellow reveals where different amino acid mutations allowed a flu virus to escape binding from existing antibodies in a human’s polyclonal sera (Lee et al. 2019). Explore this figure interactively with dms-view.

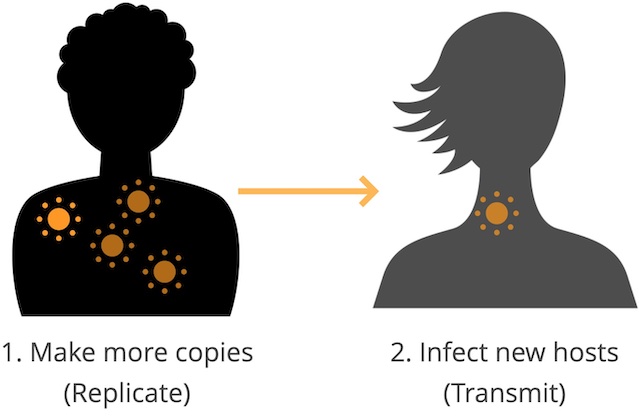
Viruses carrying beneficial mutations should grow exponentially relative to viruses lacking those mutations (Figure 2A). Beneficial mutations on different genetic backgrounds will compete with each other in a process known as clonal interference (Figure 2B). If beneficial mutations have large effects on fitness, the fitness of the genetic background where the beneficial mutations occur is less important for the success of the virus than the fitness effect of the beneficial mutations themselves (Figure 3). If beneficial mutations have similar, smaller effects on fitness, a virus’s overall fitness depends on the effect of the beneficial mutations and the relative fitness of its genetic background. In this case, the ultimate success and fixation of these beneficial mutations depends, in part, on the number of deleterious mutations that already exist in the same genome (Figure 4).

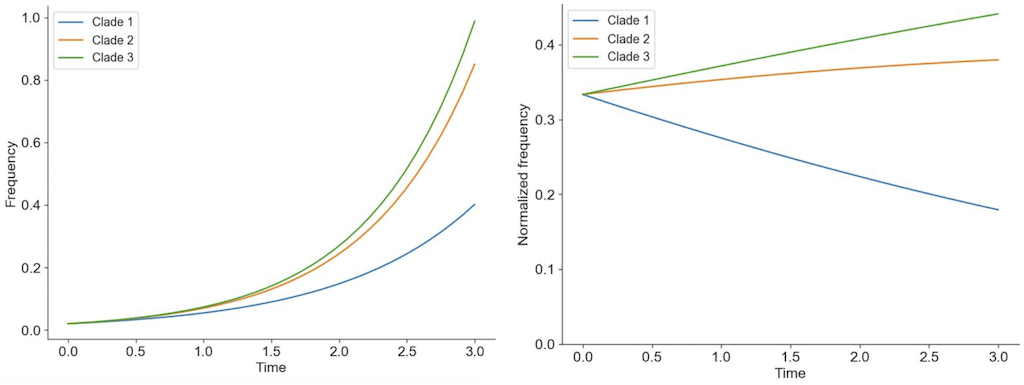
Figure 2. Individuals in asexually reproducing populations tend to grow exponentially relative to their fitness (left). Normalization of frequencies to sum to 100% represents competition between viruses for hosts through clonal interference and reveals how exponentially growing viruses can decrease in frequency when their relative fitness is low (right).

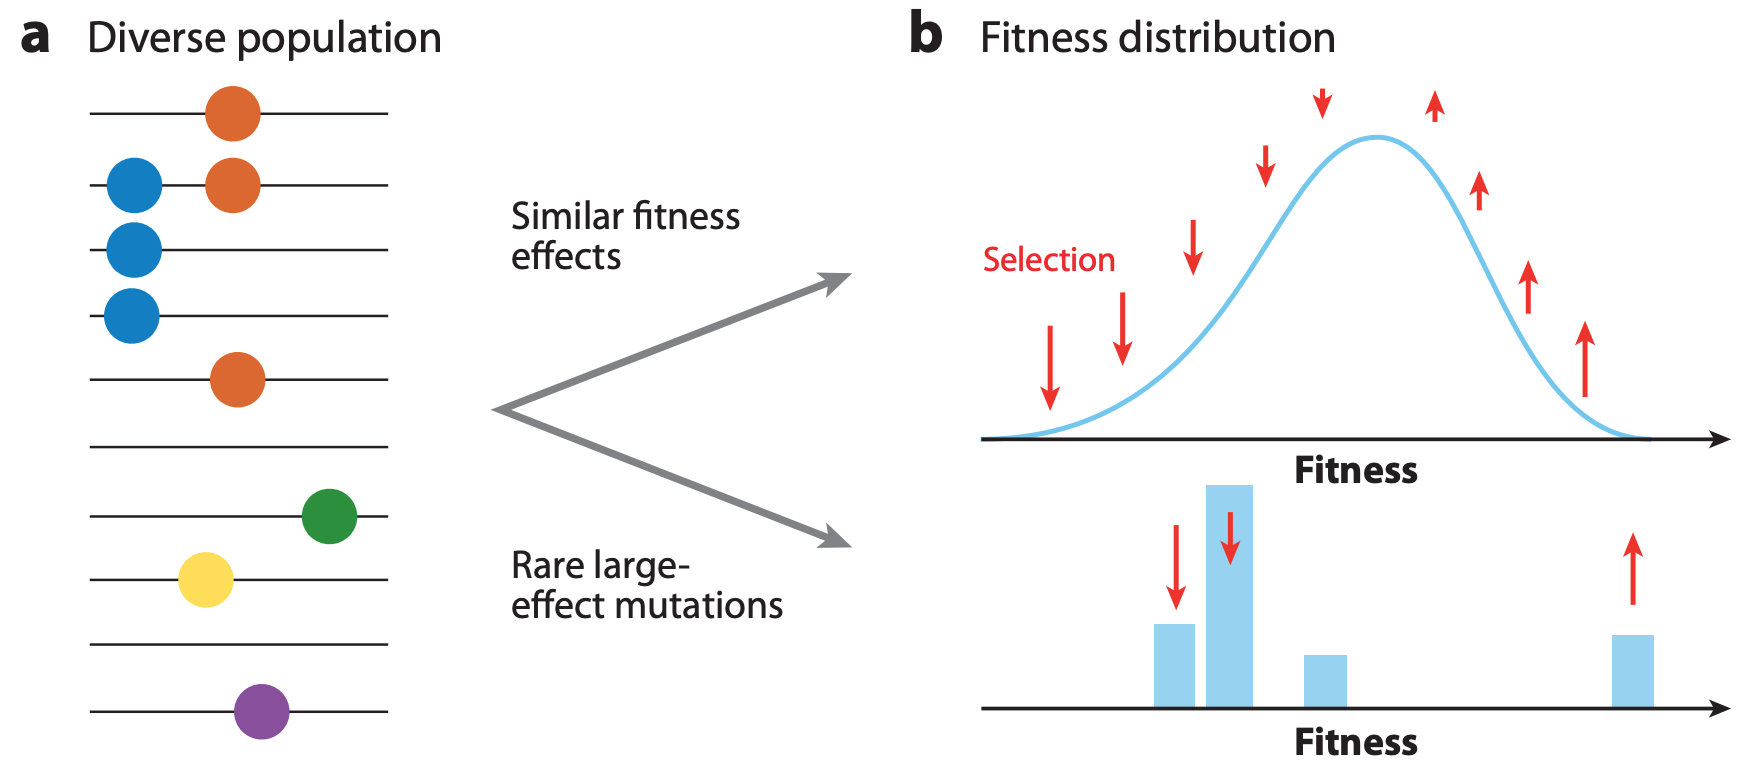
Figure 3. The shape of fitness landscapes depends, in part, on mutation effect sizes. Mutations with similar, smaller effects (blue and orange circles) produce a smooth Gaussian fitness distribution while mutations with large effect sizes (green, yellow, and purple circles) produce a more discrete fitness distribution. From Figure 1A and B of Neher 2013.

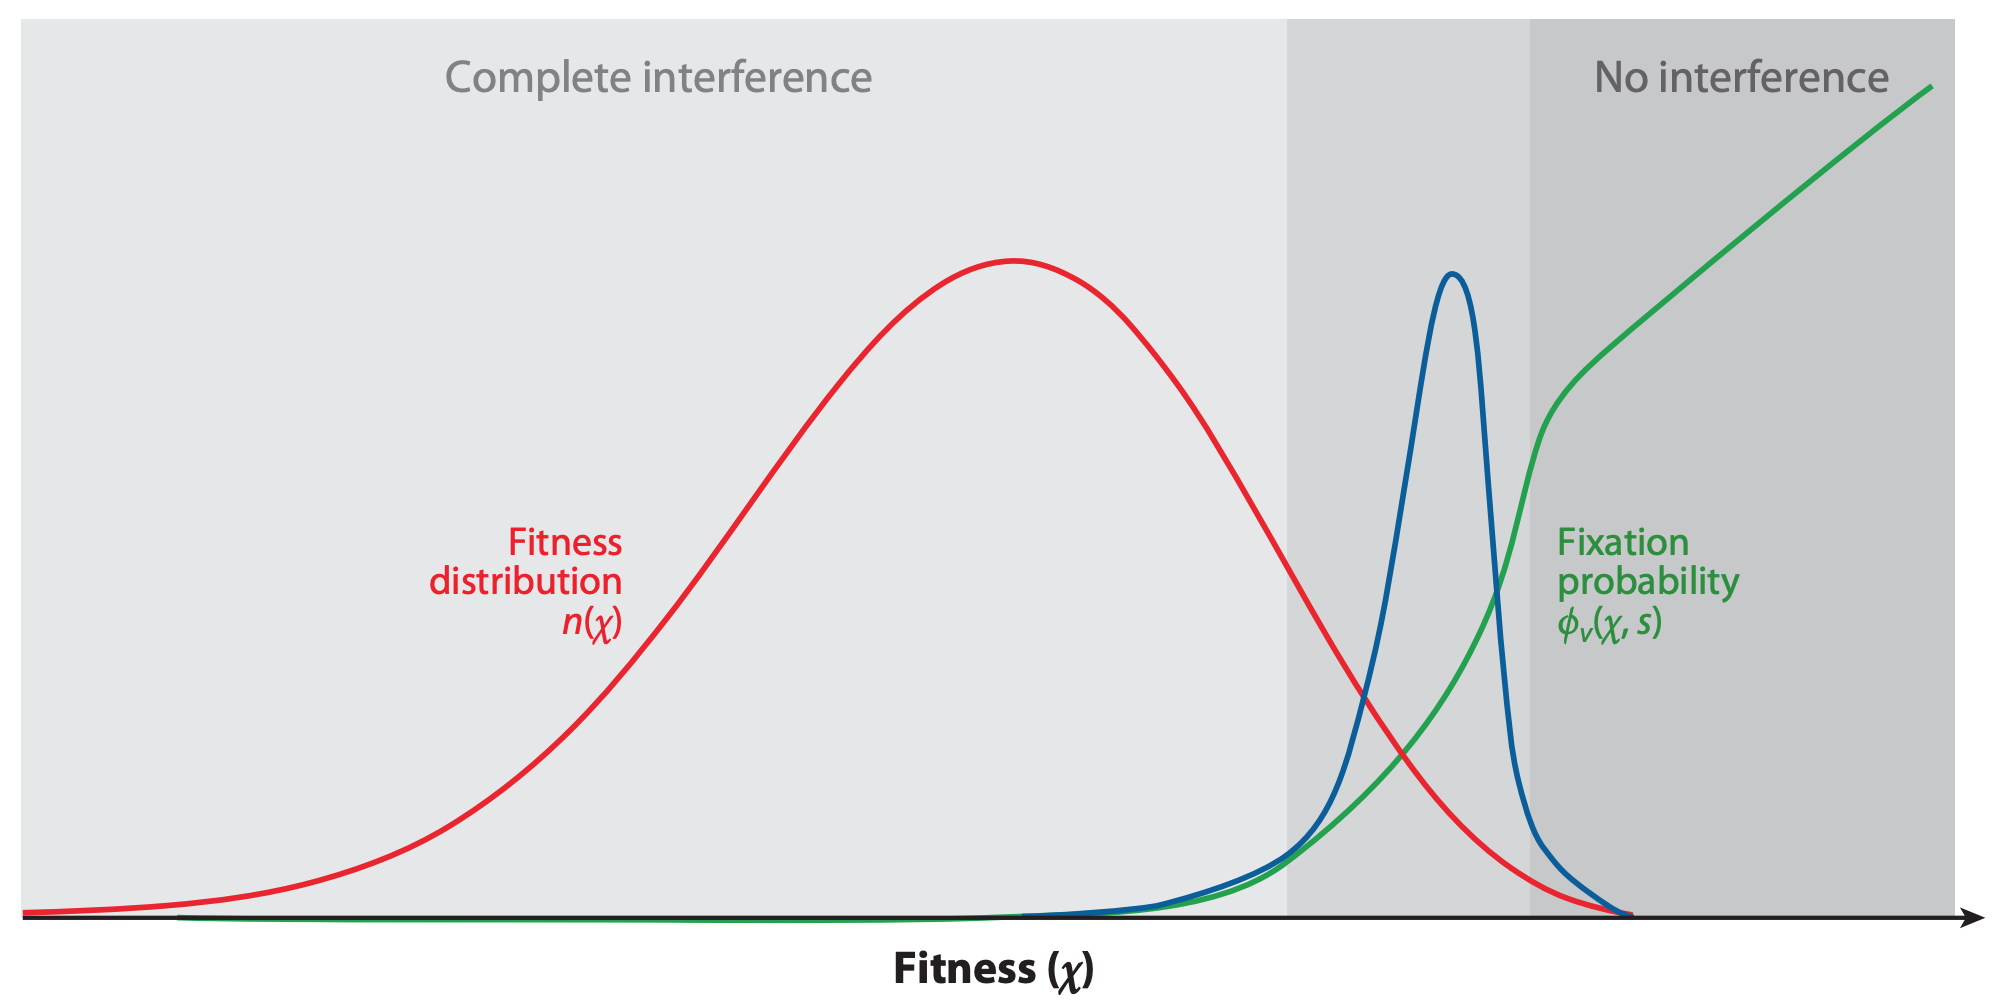
Figure 4. The fixation probability of a beneficial mutation is a function of the mutation’s genetic background. When mutations have similar, smaller effects, the fitness of a beneficial mutation’s genetic background (red) contributes to the mutation’s fixation probability (green). Mutations that ultimately fix originate from distribution given by the product of the background fitness and the fixation probability (blue). From Figure 2C of Neher 2013.

What is predictable about flu evolution?

The expectations from population genetic theory described above and previous experimental work suggest that aspects of flu’s evolution might be predictable. Mutations in HA and NA that alter host antibody binding sites and enable viruses to reinfect hosts should be under strong positive selection. We expect these strongly beneficial mutations to sweep through the global flu population at a rate that depends on the importance of their genetic background. We also do not expect that every site in HA or NA will acquire beneficial mutations. For example, fewer than a quarter of HA’s 566 amino acid sites are under positive selection (Bush et al. 1999), have undergone rapid sweeps (Shih et al. 2007), or contributed to antigenic drift (Wolf et al. 2006). Importantly, not all of these sites contribute equally to antigenic drift (Koel et al. 2013). Additionally, the complex and strong pressures of existing human immunity appear to constrain the space of antigenic phenotypes that viruses can explore at any given time (Smith et al. 2004, Bedford et al. 2012).

Recently, researchers have built on this evidence to create formal predictive models of flu evolution. Neher et al. 2014 used expectations from traveling wave models to define the “local branching index” (LBI), an estimate of viral fitness. 
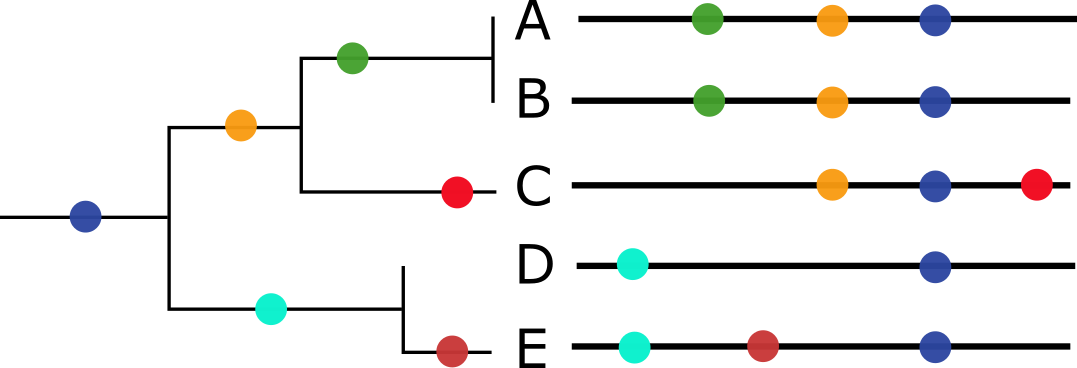
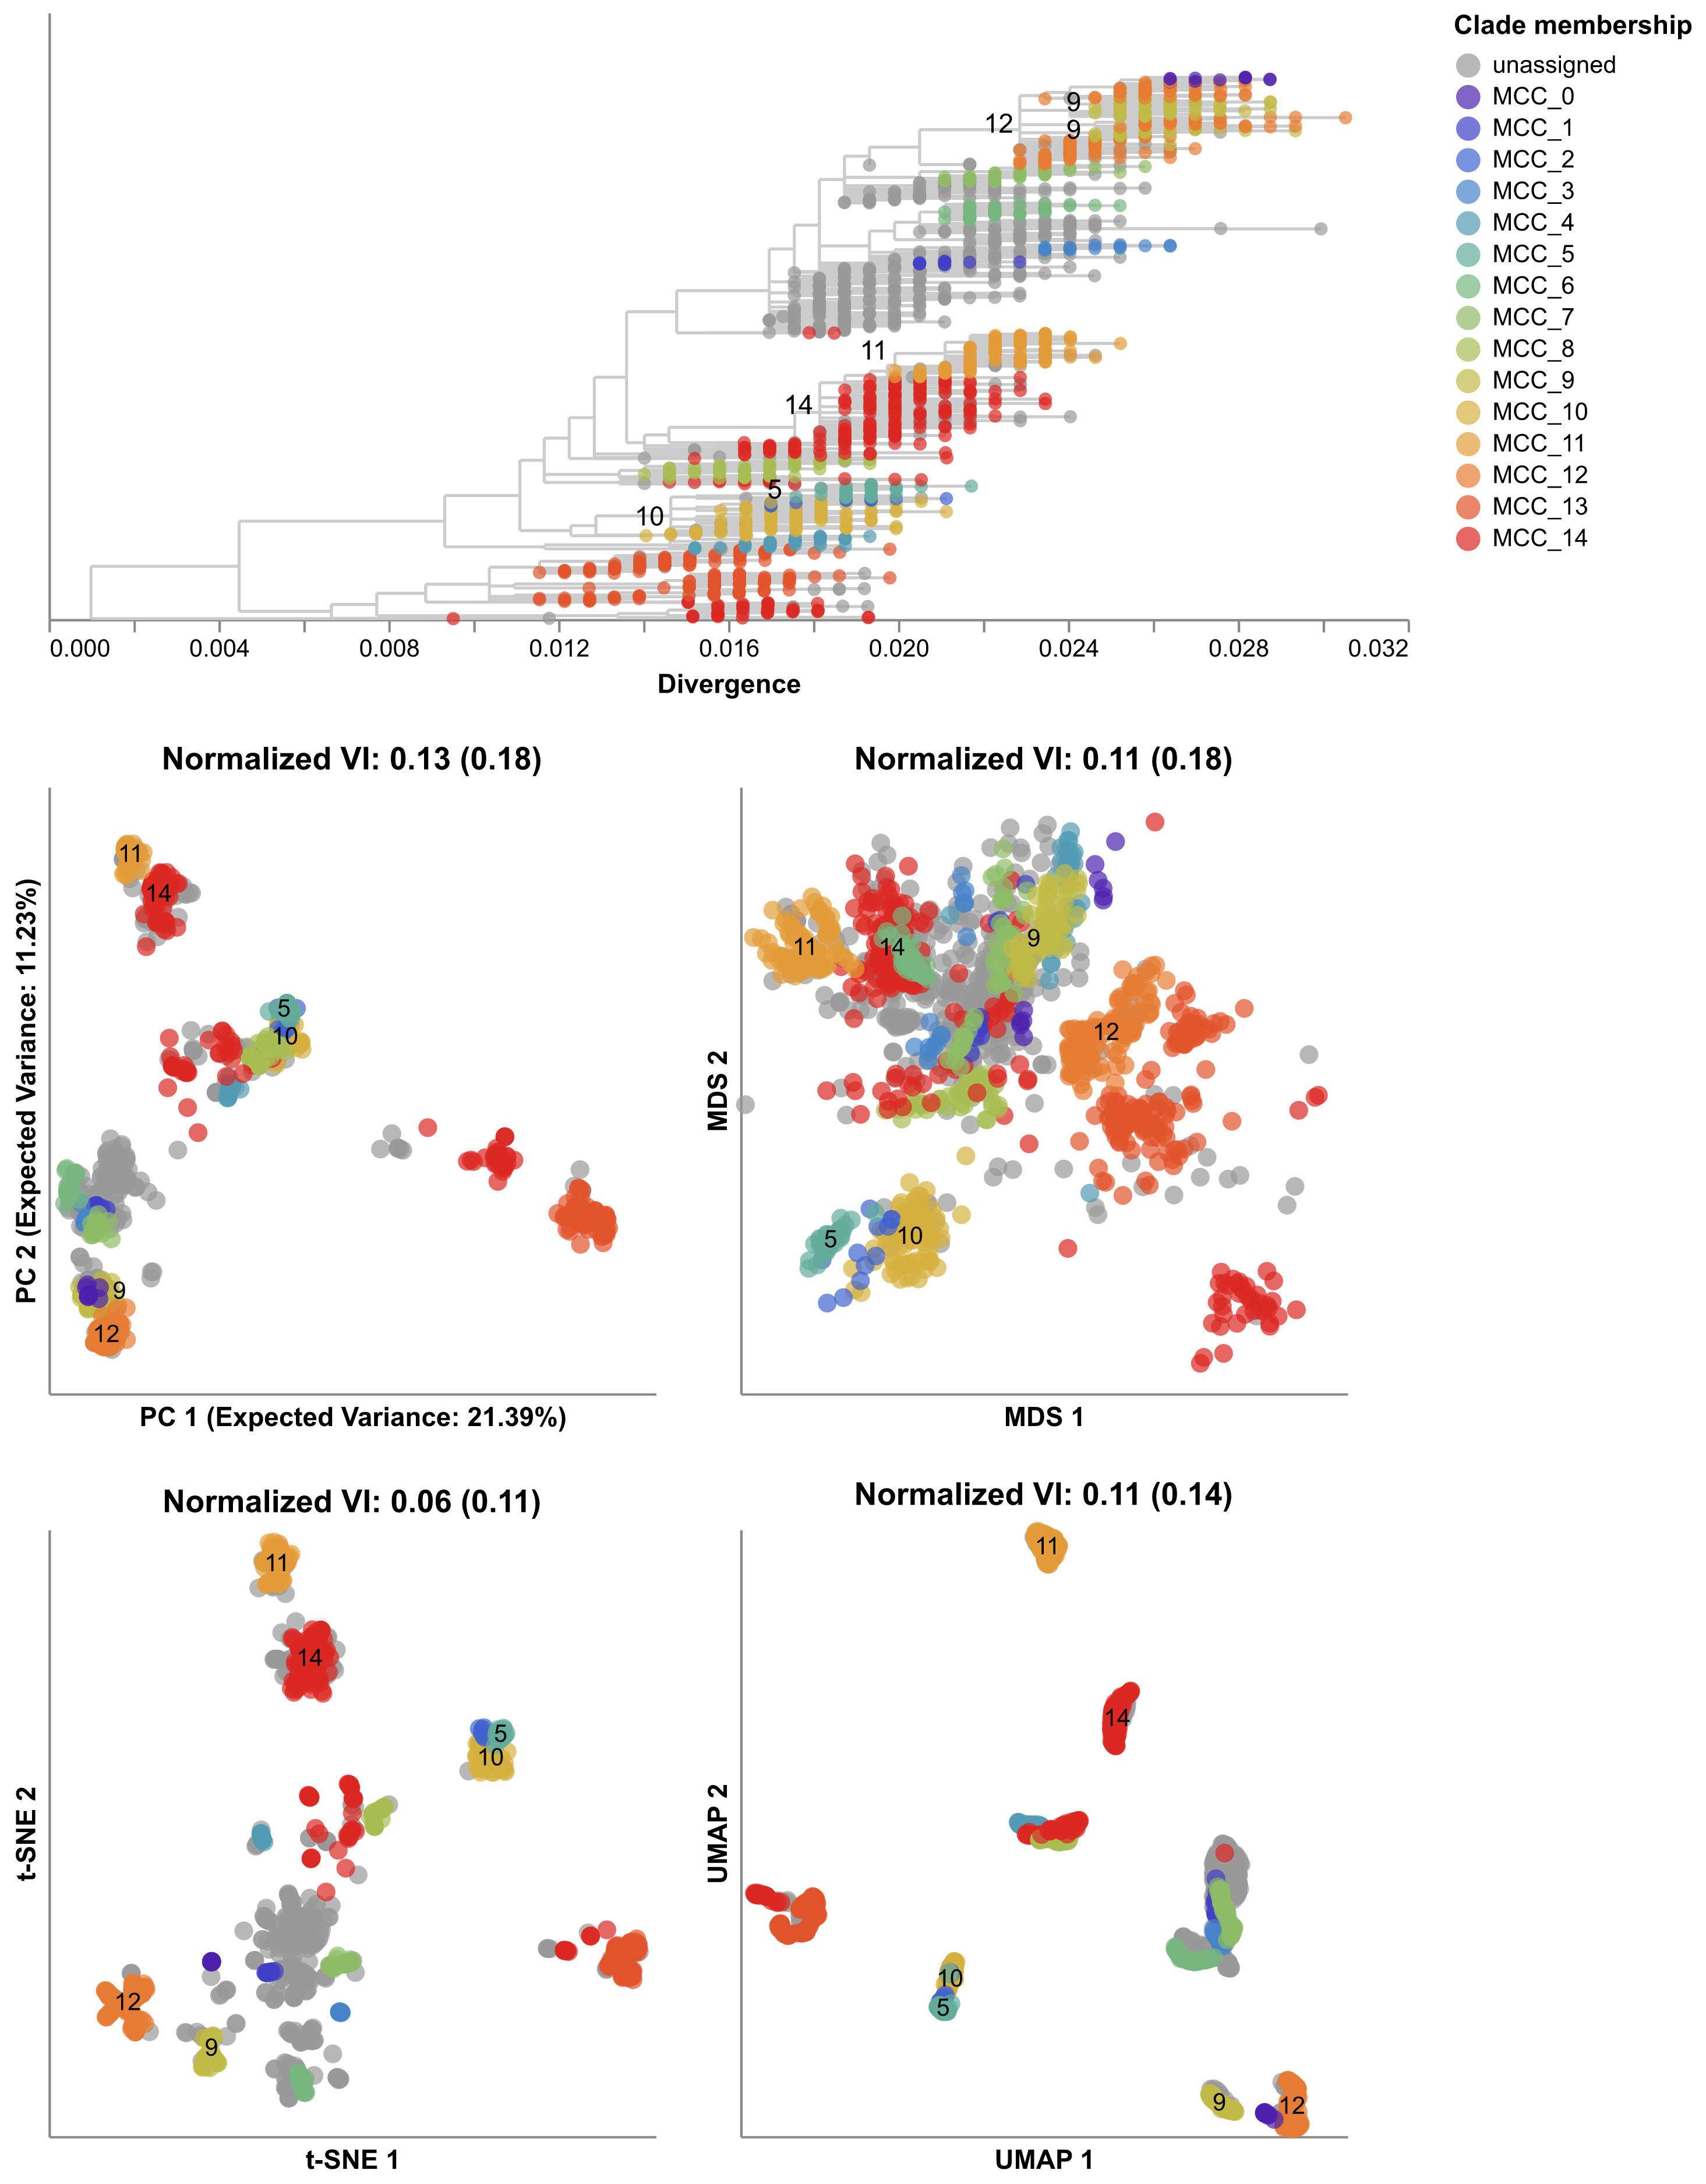
LBI assumes that most extant viruses descend from a highly fit ancestor in the recent past and uses patterns of rapid branching in phylogenies to identify putative fit ancestors (Figure 5). Neher et al. 2014 showed that LBI could successfully identify individual ancestral nodes that were highly representative of the flu population one year in the future.

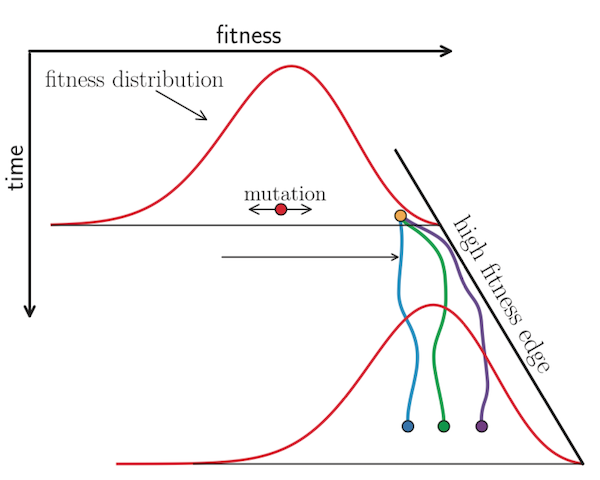
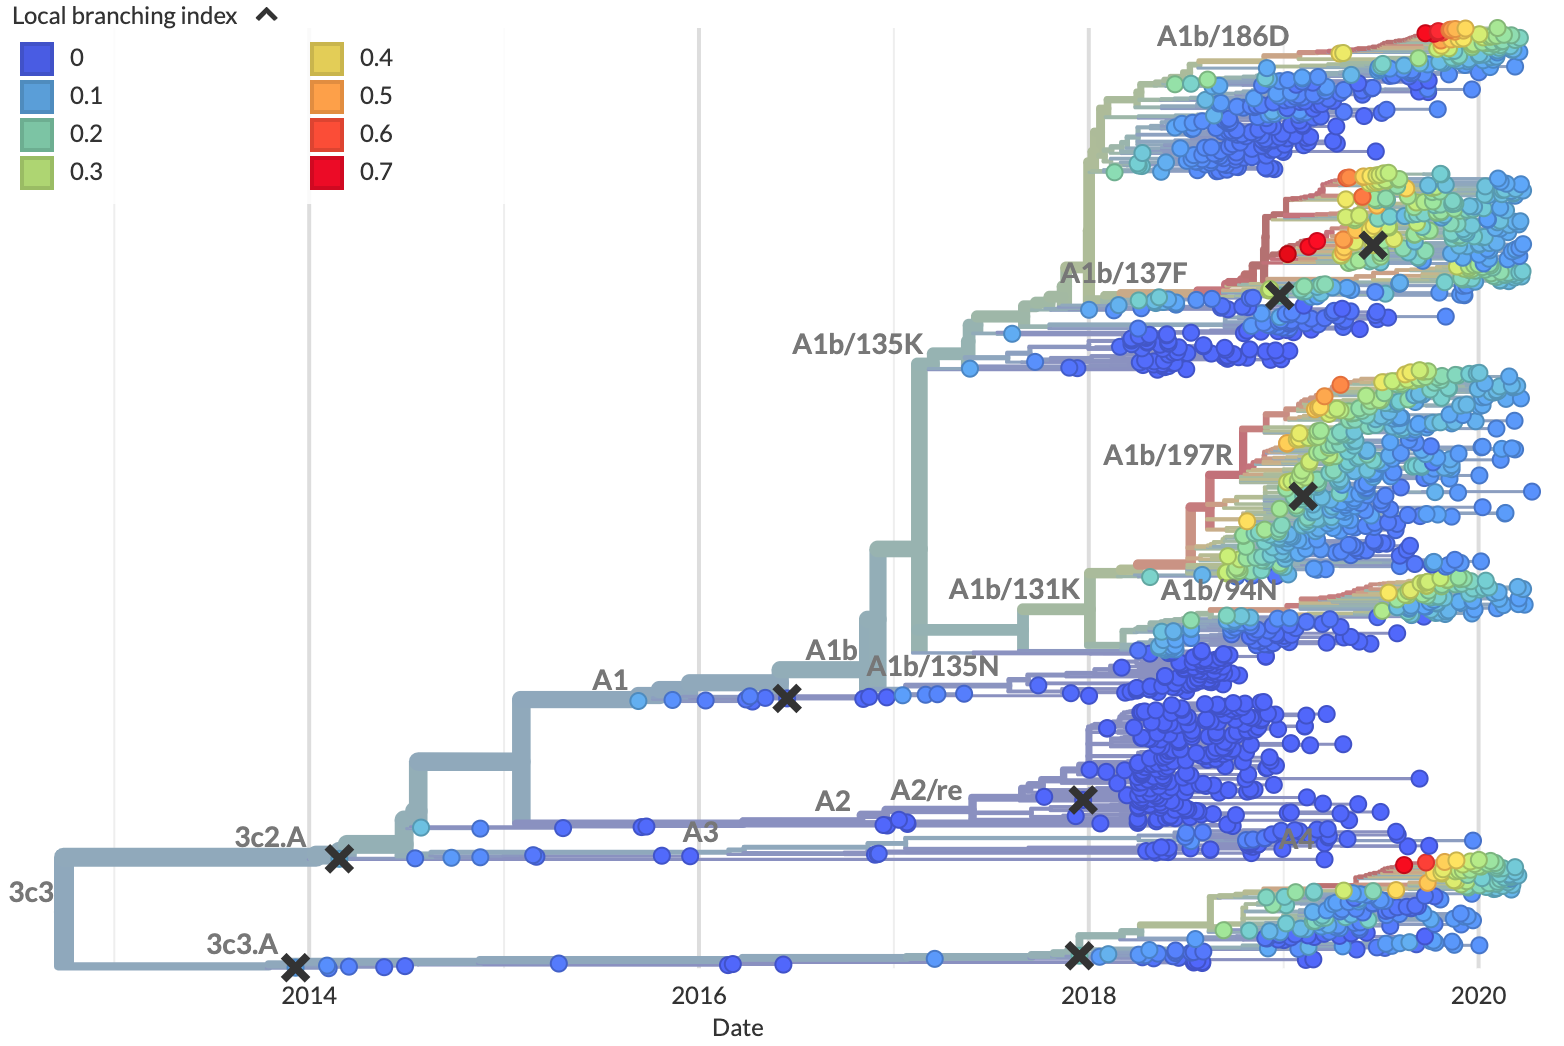
Figure 5. Local branching index (LBI) estimates the fitness of viruses in a phylogeny. A) LBI assumes that mutations at the high fitness edge of a current population will seed future populations. From Figure 5D of Neher 2013. B) In practice, LBI tends to identify clusters of recently expanding populations, as shown in this seasonal influenza A/H3N2 phylogeny from Nextstrain. Explore LBI values in the current Nextstrain phylogeny for A/H3N2.

Łuksza and Lässig 2014 developed a mechanistic model to forecast flu evolution based on population genetic theory and previous experimental work. This model assumed that flu viruses grow exponentially as a function of their fitness, compete with each other for hosts through clonal interference, and balance positive effects of mutations at sites previously associated with antigenic drift and deleterious effects of all other mutations. Instead of predicting the most representative virus of the future population, Łuksza and Lässig 2014 explicitly predicted the future frequencies of entire clades.

Despite the success of these predictive models, other aspects of flu evolution complicate predictions. When multiple beneficial mutations with large effects emerge in a population, the clonal interference between viruses reduces the probability of fixation for all mutations involved. Flu populations also experience multiple bottlenecks in space and time including transmission between hosts, global circulation, and seasonality. These bottlenecks reduce flu’s effective population size and reduce the probability that beneficial mutations will sweep globally. Finally, antigenic escape assays with polyclonal human sera suggest that successful viruses must accumulate multiple beneficial mutations of large effect to successfully evade the diversity of global host immunity (Lee et al. 2019).

Does flu evolve like we think it does?

In Barrat-Charlaix et al. 2020, we investigated the predictability of flu mutation frequencies. We explicitly avoided modeling flu evolution and focused on an empirical account of long-term outcomes for mutation frequency trajectories. We selected all available HA and NA sequences for flu lineages A/H3N2 and A/H1N1pdm, performed multiple sequence alignments per lineage and gene, binned sequences by month, and calculated the frequencies of mutations per site and month. From these data, we constructed frequency trajectories of individual mutations that were rising in frequency from zero. We expected these rising mutations to represent beneficial, large-effect mutations that would sweep through the global population as predicted by the population genetic theory described above. By considering individual mutations, we effectively averaged the outcomes of these mutations across all genetic backgrounds. We evaluated the outcomes of trajectories for mutations that had risen from 0% to approximately 30% global frequency and classified trajectories for mutations that fixed, died out, or persisted as polymorphisms.

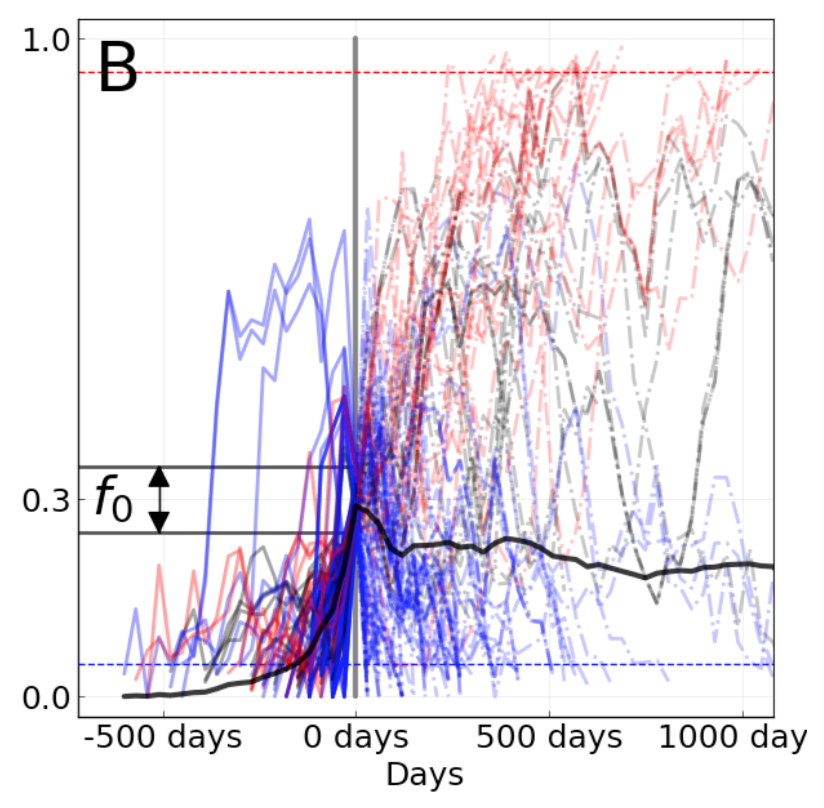
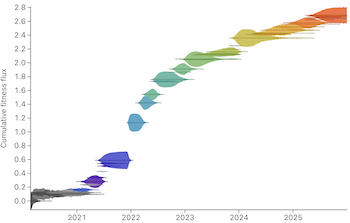
Figure 6. Mutation trajectories for seasonal influenza A/H3N2 where mutations rose from a frequency of zero to approximately 30% frequency. Dashed horizontal lines represent thresholds for fixation (red) and loss (blue). Trajectory colors also indicate eventual fixation (red), loss (blue), or persistence as a polymorphism (black). The thick black dashed line indicates the average frequency of all trajectories shown. For the interactive figure, hover over individual trajectories to highlight their full extent and details about the current frequency of a given mutation at each timepoint. Use the radio buttons to filter trajectories by segment and outcome. (After Figure 1B in Barrat-Charlaix et al 2020.)

The average trajectory of individual rising A/H3N2 mutations failed to rise toward fixation (Figure 6). Instead, the future frequency of these mutations was no higher on average than their initial frequency. We repeated this analysis for mutations with initial frequencies of 50% and 75% and for mutations in A/H1N1pdm and found nearly the same results. From these results, we concluded that it is not possible to predict the short-term dynamics of individual mutations based solely on their recent success.

Next, we calculated the fixation probability of each mutation trajectory based on its initial frequency. Surprisingly, we found that the fixation probabilities of A/H3N2 mutations were equal to their initial frequencies. This pattern corresponds to what we expect for mutations evolving neutrally, where population genetic theory predicts that fixation probability is equal to current mutation frequency. Generally, the pattern remained the same even when we binned mutations by high LBI, presence at epitope sites, multiple appearances of a mutation in a tree, geographic spread, or other potential metrics associated with high fitness. We concluded that the recent success of rising mutations provides no information about their eventual fixation.

We tested whether we could explain these results by genetic linkage or clonal interference by simulating flu-like populations under these evolutionary constraints. Mutation trajectories from simulated populations were more predictable than those from natural populations. The closest our simulations came to matching the uncertainty of natural populations was when we dramatically increased the rate at which the fitness landscape of simulated populations changed. These results suggested that we cannot explain the unpredictable nature of flu mutation trajectories by linkage or clonal interference alone.

Since flu mutation trajectories lacked “momentum” and LBI did not provide information about eventual fixation of mutations, we wondered whether we could identify the most representative sequence of future populations with a different metric. The consensus sequence is provably the best predictor for a neutrally evolving population. We found that the consensus sequence is often closer to the future population than the virus sequence with the highest LBI. Indeed, we found that the top LBI virus was frequently similar to the consensus sequence and often identical.

Taken together, our results from this empirical analysis reveal that beneficial mutations of large effect do not predictably sweep through flu populations and fix. Instead, the average outcome for any individual mutation resembles neutral evolution, despite the strong positive selection expected to act on these mutations. Although simulations rule out clonal interference between large effect mutations as an explanation for these results, we cannot discount the role of multiple mutations of similar, smaller effects in the overall fitness of flu viruses and the fixation of “rafts” of co-evolving mutations.

Can we forecast flu evolution?

In Huddleston et al. 2020, we built a modeling framework based on the approach described in Łuksza and Lässig 2014 to forecast flu A/H3N2 populations one year in advance. We used this framework to predict the sequence composition of the future population, the frequency dynamics of clades, and the virus in the current population that most represented the future population. As in Barrat-Charlaix et al. 2020 and Łuksza and Lässig 2014, we assumed that viruses grow exponentially as a function of their fitness and that viruses with similarly high fitness compete with each other under clonal interference. In contrast to Barrat-Charlaix et al. 2020, we considered the fitness of complete amino acid haplotypes instead of individual mutations.

We estimated fitness with metrics based on HA sequences and experimental measurements of antigenic drift and functional constraint. The sequence-based metrics included the epitope cross-immunity and mutational load estimates defined by Łuksza and Lässig 2014, LBI from Neher et al. 2014, and “delta frequency”, a measure of recent change in clade frequency analogous to Barrat-Charlaix’s rising mutations. The experimental metrics included a cross-immunity measure based on hemagglutination inhibition (HI) assays (Neher et al. 2016) and an estimate of functional constraint based on mutational preferences from deep mutational scanning experiments (Lee et al. 2018).

We trained models based on each of these metrics independently and in relevant combinations of complementary metrics. For each model, we fit coefficients per fitness metric that minimized the distance between the estimated and observed amino acid haplotype composition of the future (Figure 7). These coefficients represent the effect of each metric on flu fitness. As a control, we also calculated the distance to the future population for a “naive” model that assumed the future population is the same as the current population. To test our framework, we simulated 40 years of evolution for flu-like populations with SANTA-SIM and fit models to these data. After verifying our framework with simulated populations, we trained models for natural A/H3N2 populations using 25 years of historical data. We tested the accuracy of each model by applying the coefficients from the training data to forecasts of new out-of-sample data from the last 5 years of A/H3N2 evolution.

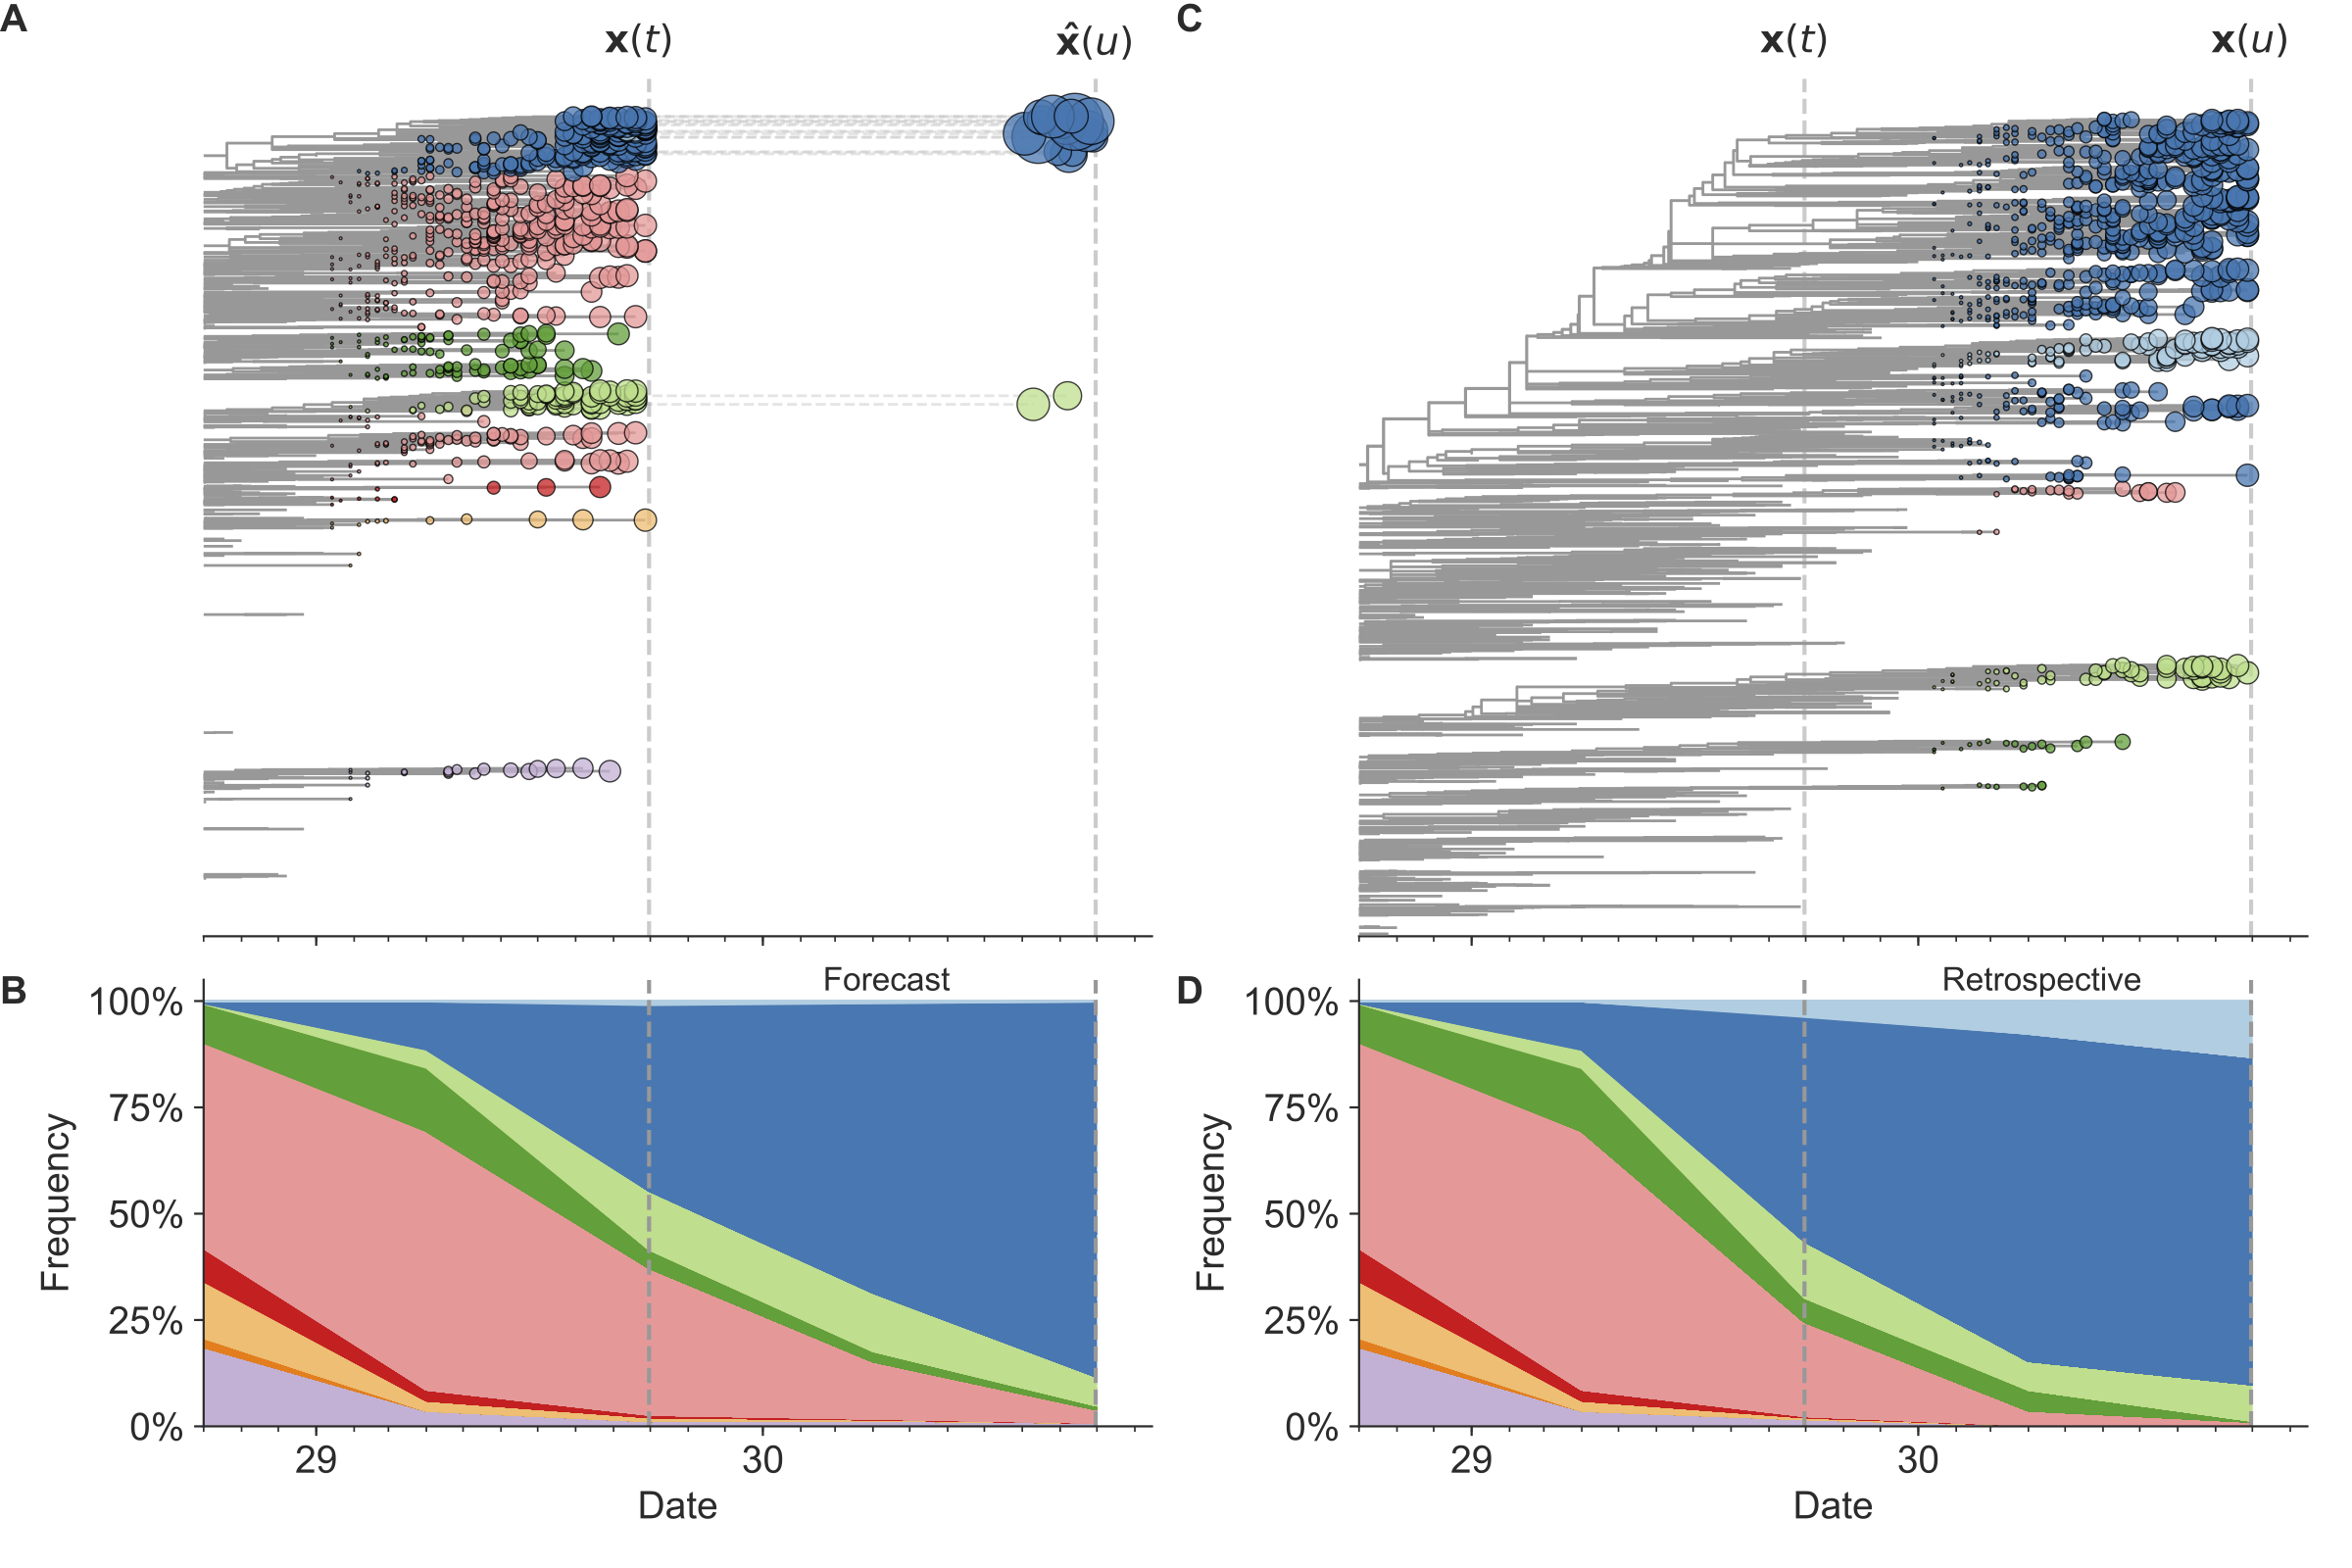
Figure 7. Schematic representation of the fitness model for simulated H3N2-like populations wherein the fitness of strains at timepoint t determines the estimated frequency of strains with similar sequences one year in the future at timepoint u. Strains are colored by their amino acid sequence composition such that genetically similar strains have similar colors. A) Strains at timepoint t, x(t), are shown in their phylogenetic context and sized by their frequency at that timepoint. The estimated future population at timepoint u, x̂(u), is projected to the right with strains scaled in size by their projected frequency based on the known fitness of each simulated strain. B) The frequency trajectories of strains at timepoint t to u represent the predicted the growth of the dark blue strains to the detriment of the pink strains. C) Strains at timepoint u, x(u), are shown in the corresponding phylogeny for that timepoint and scaled by their frequency at that time. D) The observed frequency trajectories of strains at timepoint u broadly recapitulate the model’s forecasts while also revealing increased diversity of sequences at the future timepoint that the model could not anticipate, e.g. the emergence of the light blue cluster from within the successful dark blue cluster. Model coefficients minimize the earth mover’s distance between amino acid sequences in the observed, x(u), and estimated, x̂(u), future populations across all training windows. (After Figure 1 in Huddleston et al 2020.)

We found that the most robust forecasts depended on a combined model of experimentally-informed antigenic drift and sequence-based mutational load. Importantly, this model explicitly accounts for the benefits of antigenic drift and the costs of deleterious mutations. This model also slightly outperformed the naive model in its estimation of future clade frequencies. However, we found that the naive model often selected individual strains that were as close to the future population as the best biologically-informed model. The naive model’s estimated closest strain to the future is effectively the weighted average of the current population and conceptually similar to the consensus sequence of the population. From these results, we concluded that the predictive gains of fitness models depend on the prediction target.

Surprisingly, the sequence-based metrics of epitope cross-immunity and delta frequency and the mutational preferences from DMS experiments had little predictive power. These metrics failed to make accurate forecasts because of their dependence on a specific historical context. For example, the original epitope cross-immunity metric (Łuksza and Lässig 2014) depends on a predefined list of epitope sites that were originally identified in a retrospective study of flu sequences up through 2005 (Shih et al. 2007). This metric correspondingly failed to predict the future after 2005, suggesting that its previous success depended on inadvertently borrowing information from the future. Similarly, the mutational preferences from DMS experiments measure effects of all single amino acid mutations to the genetic background of the virus A/Perth/16/2009. The metric based on these preferences failed to predict the future after 2009, reflecting the strong dependence of these preferences on their original genetic background. Both delta frequency and LBI suffered from overfitting to the training data, in a more general form of historical dependence.

How do results from our two studies compare?

The two studies we have presented here use different approaches to analyze the same natural flu populations. We completed these two studies mostly independently and have only now begun to reconcile their findings. We were especially interested to understand how simulated populations from the two studies differed and whether the optimal predictor from Barrat-Charlaix et al. 2020 could also be an accurate fitness metric in the modeling framework from Huddleston et al. 2020.

Simulated populations play an important role in our two studies. We generated these simulated data as a source of truth where we understand the population dynamics because we defined them. In Barrat-Charlaix et al. 2020, the simulated binary populations from ffpopsim (Zanini and Neher 2012) evolved under strong epistasis and immune escape pressure. These populations showed us that mutation trajectories could be predictable under these population genetic constraints. In Huddleston et al. 2020, the simulated nucleotide populations from SANTA-SIM (Jariani et al. 2019) also evolved under strong epistasis, purifying selection, and an “exposure dependent” fitness function that mimics immune escape pressure. We used these populations to confirm that our forecasting framework could accurately predict the composition of future populations. Interestingly, when we inspected the predictability of the mutation trajectories for these simulated populations, we found that they resembled the weak predictability of natural H1N1pdm trajectories (Figure 8). Despite the weak predictability of mutation trajectories from these simulated populations, we were able to forecast the composition of their future populations. These results highlight the importance of using complete haplotypes to make predictions, as individual mutation trajectories remain difficult to predict.

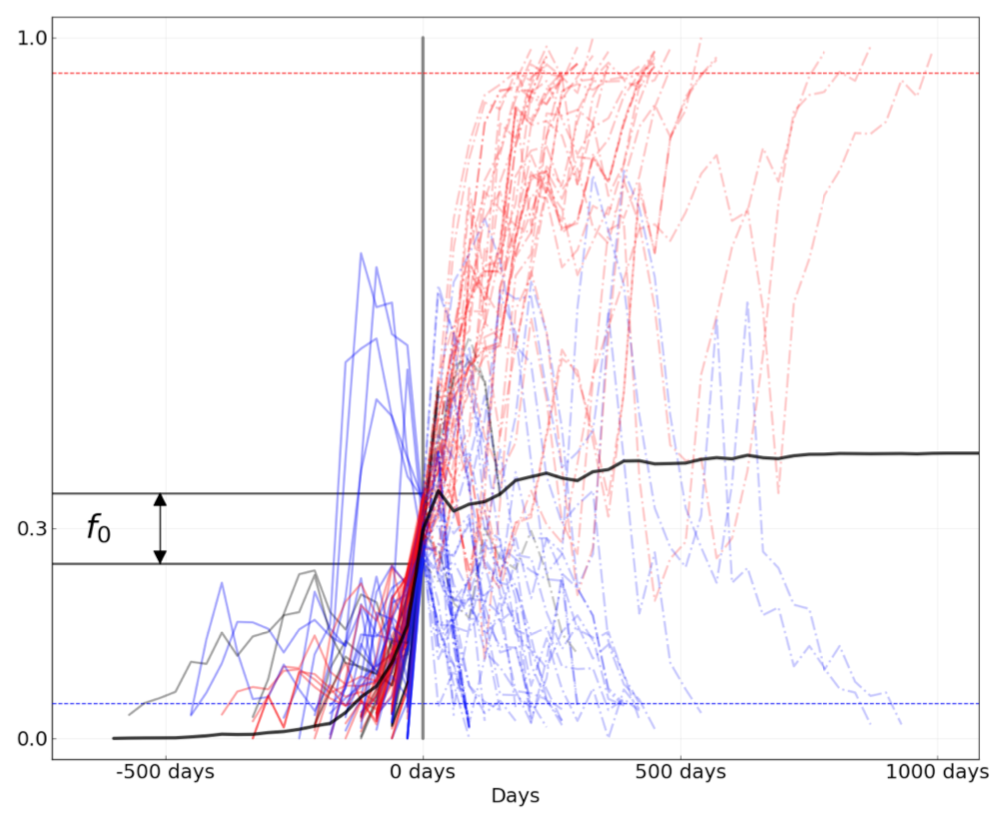
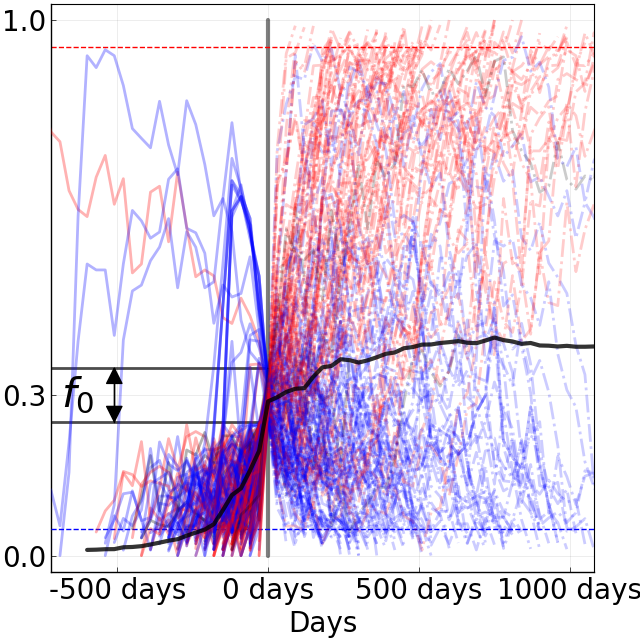
Figure 8. Comparison of rising trajectories for natural H1N1pdm trajectories from Barrat-Charlaix et al. 2020 and simulated flu-like populations from Huddleston et al. 2020. A) Rising trajectories for H1N1pdm mutations as reported in Figure S9 of Barrat-Charlaix et al. 2020. B) Rising trajectories for flu-like populations simulated with SANTA-SIM in Huddleston et al. 2020. Mutation trajectories from simulated populations resemble those of natural H1N1pdm mutations.

We also wanted to know whether the optimal metric from Barrat-Charlaix et al. 2020 for selecting a representative of the future, the consensus sequence of the current population, could make accurate forecasts in the modeling framework from Huddleston et al. 2020. We noted above that the closest strain to the future selected by the naive model from Huddleston et al. 2020 is analogous to the consensus sequence of the current population. One important difference is that the naive model has to select a previously sampled strain while the consensus sequence represents a hypothetical strain that may not exist in nature. To understand whether the consensus sequence could also improve forecasts of the future population’s haplotype composition, we developed a new fitness metric called the “distance from consensus”. For each timepoint in our forecasting analysis, we constructed the amino acid consensus sequence from all extant strains and calculated the pairwise distance between the consensus and each extant strain. If the consensus sequence is the best representation of the future population, we expected the corresponding model’s coefficients to be consistently negative. This negative coefficient would have the effect of penalizing strains whose amino acid sequences diverged greatly from the consensus sequence.

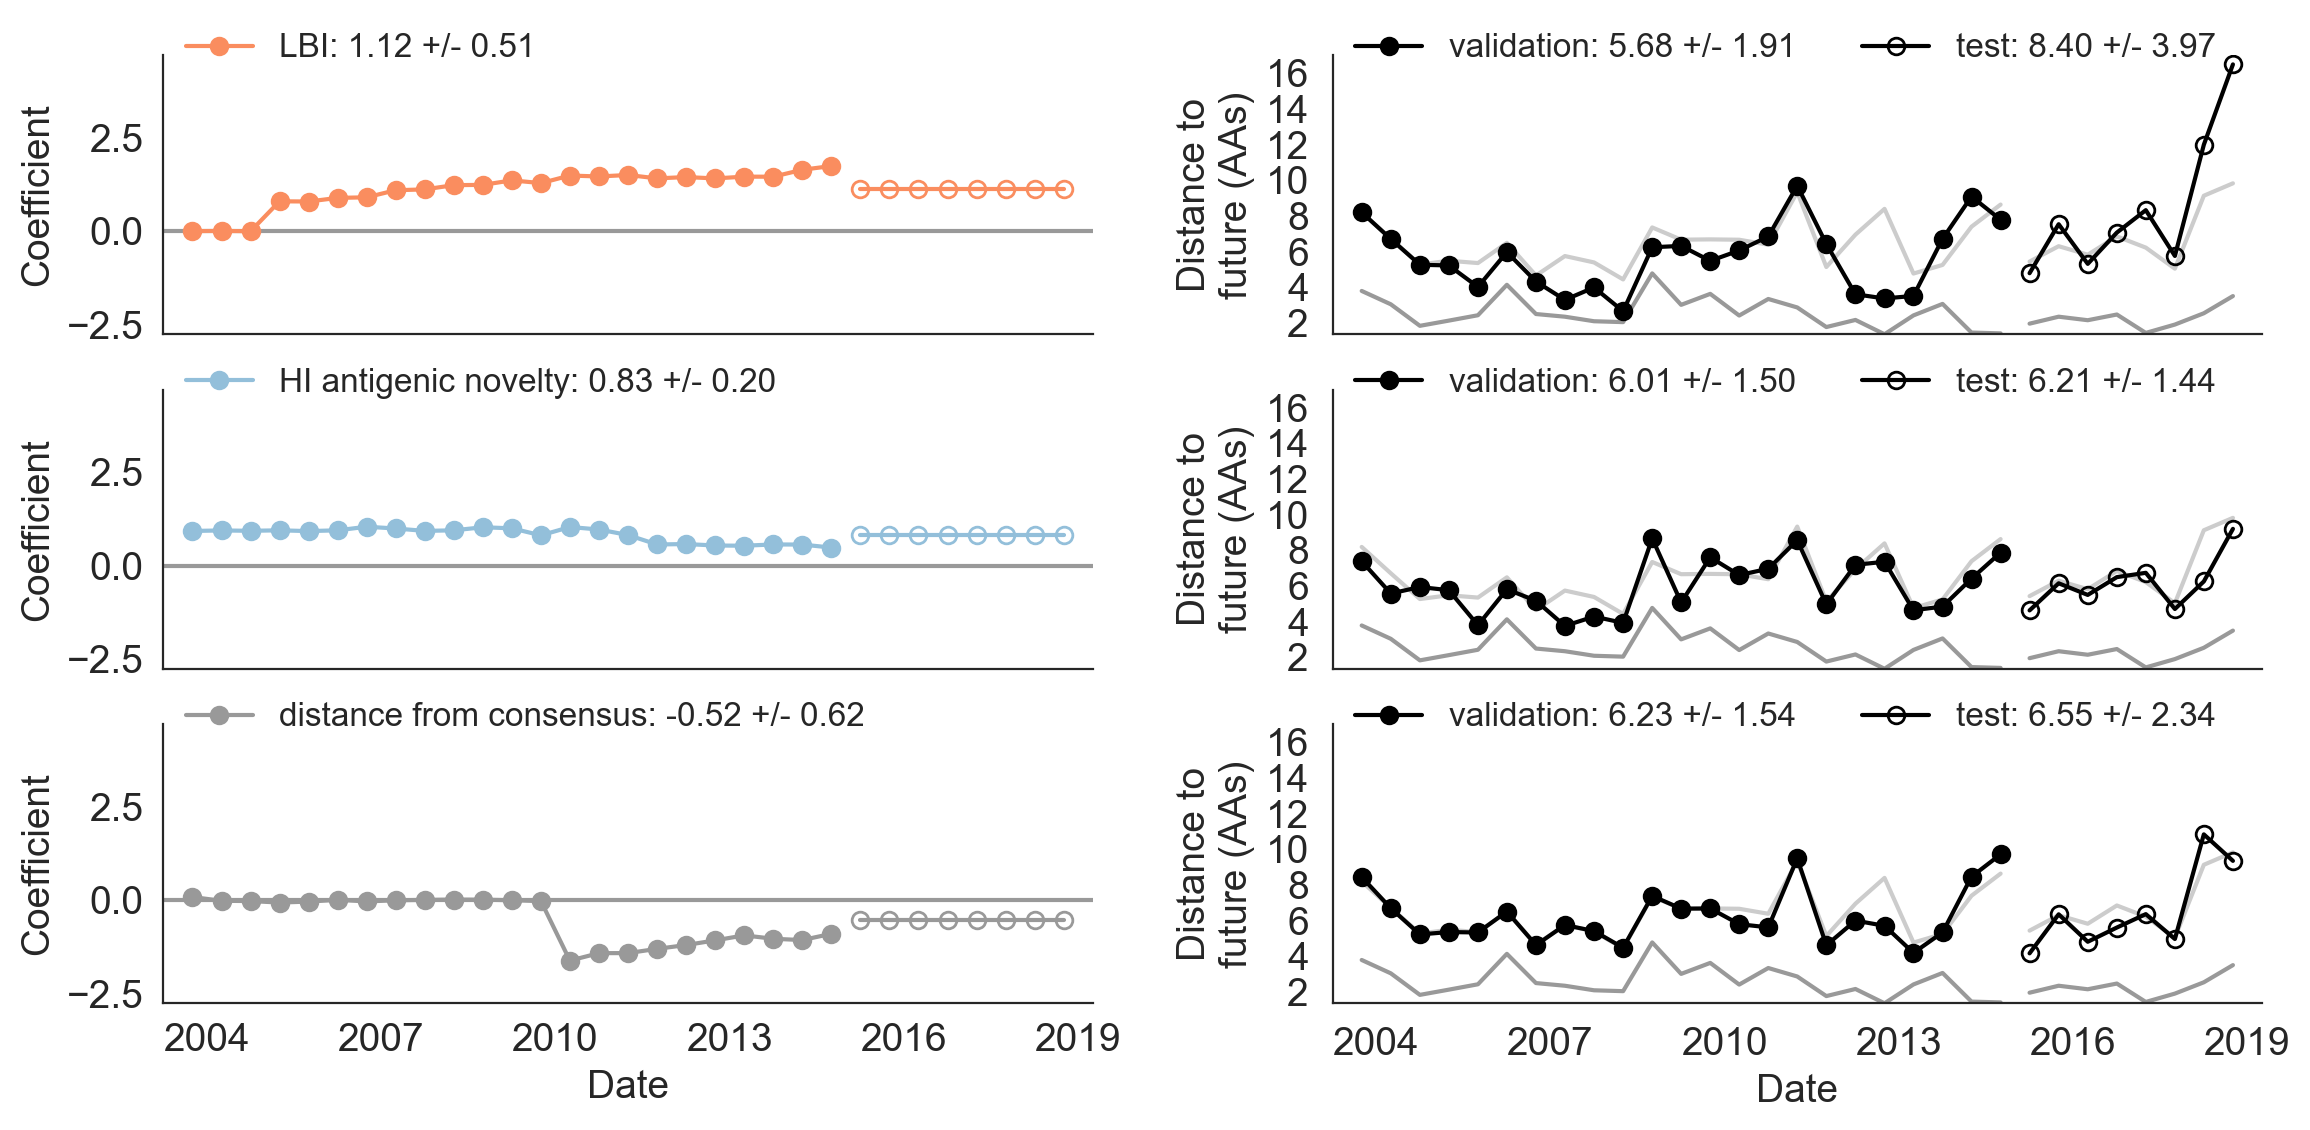
Figure 9. Model coefficients and distance to the future for LBI, HI antigenic novelty, and distance from consensus metrics. A) Coefficients are shown per validation timepoint (solid circles, N=23) with the mean +/- standard deviation in the top-left corner. For model testing, coefficients were fixed to their mean values from training/validation and applied to out-of-sample test data (open circles, N=8). B) Distances between projected and observed populations are shown per validation timepoint (solid black circles) or test timepoint (open black circles). The mean +/- standard deviation of distances per validation timepoint are shown in the top-left of each panel. Corresponding values per test timepoint are in the top-right. The naive model’s distance to the future (light gray) was 6.40 +/- 1.36 AAs for validation timepoints and 6.82 +/- 1.74 AAs for test timepoints. The corresponding lower bounds on the estimated distance to the future (dark gray) were 2.60 +/- 0.89 AAs and 2.28 +/- 0.61 AAs.

We fit a model to this new metric using the same 25 years of historical A/H3N2 data described in Huddleston et al. 2020 and tested the robustness of the model on the last 5 years of A/H3N2 data. We compared the performance of this model to models for LBI and experimental measures of antigenic drift (HI antigenic novelty). For the first half of the training period, the distance to consensus metric received a coefficient of zero, meaning it did not improve forecasts over the naive model (Figure 9). In the second half of the training period, the metric received a strong negative coefficient, as we expected. When we applied the mean coefficient from the training period to out-of-sample data in the test period, we found that the distance from consensus metric outperformed LBI and performed only slightly worse than the antigenic drift metric. These results support findings from both of our studies. The consensus sequence is a more robust representative of the future than LBI, as shown in Barrat-Charlaix et al. 2020. However, experimental measurements of antigenic drift still provide more information about the future population than sequence-only metrics, as shown in Huddleston et al. 2020. We anticipate that this new distance from consensus metric could eventually replace the existing mutational load metric in a combined model with HI antigenic novelty. This new combined model could potentially provide better estimates of functional constraint (by limiting changes from the consensus) and antigenic drift (by using experimental measures of antigenic drift phenotypes.)

How have these results changed how we think about flu evolution?

In general, we found that the evolution of H3N2 flu populations remains difficult to predict. The frequency dynamics and fixation probabilities of individual mutations resemble neutrally evolving alleles. We can weakly predict the frequency dynamics of flu clades when we combine experimental and genetic data in models that account for antigenic drift and mutational load. In the best case, we can use these same biologically-informed models to predict the sequence composition of future flu populations. However, these complex fitness models do not always outperform simpler models, when predicting which individual virus is the most representative of the future population. In Barrat-Charlaix et al. 2020, the consensus sequence of the current population was as close or closer to the future population than the sequence with the highest local branching index. In Huddleston et al. 2020, a naive model estimated the single closest strain to the future nearly as well as the best biologically-informed models.

Successful flu predictions depend on the choice of prediction targets and fitness metrics. Future prediction efforts should attempt to estimate the composition of future populations instead of future clade frequencies. Fitness models should account for the genetic background of beneficial mutations and favor fitness metrics that are the least susceptible to model overfitting and historical contingency. The benefits of considering the genetic background of individual mutations in HA suggest that considering the context of all genes should yield gains, too. We need measures of antigenic drift from human antisera to complement current measures based on ferret antisera. We may also improve forecast accuracy by accounting for flu’s global migration patterns. Finally, we should make the forecasting problem itself easier by embracing efforts to reduce the lag between vaccine composition decisions and distribution to the public.

The field of genomic epidemiology focuses on using the genetic sequences of pathogens to understand patterns of transmission and spread. Viruses mutate very quickly and accumulate changes during the process of transmission from one infected individual to another. The novel coronavirus which is responsible for the emerging COVID-19 pandemic mutates at an average of about two mutations per month. After someone is exposed they will generally incubate the virus for ~5 days before symptoms develop and transmission occurs. Other research has shown that the “serial interval” of SARS-CoV-2 is ~7 days. You can think of a transmission chain as looking something like:


where, on average, we have 7 days from one infection to the next. As the virus transmits, it will mutate at this rate of two mutations per month. This means, that on average every other step in the transmission chain will have a mutation and so would look something like:


These mutations are generally really simple things. An ‘A’ might change to a ‘T’, or a ‘G’ to a ‘C’. This changes the genetic code of the virus, but it’s hard for a single letter change to do much to make the virus behave differently. However, with advances in technology, it’s become readily feasible to sequence the genome of the novel coronavirus. This works by taking a swab from someone’s nose and extracting the RNA in the sample and then determining the ‘letters’ of this RNA genome using chemistry and very powerful cameras. Each person’s coronavirus infection will yield a sequence of 30,000 ‘A’, ‘T’, ‘G’ or ‘C’ letters. We can use these sequences to reconstruct which infection is connected to which infection. As an example, if we sequenced three of these infections and found:


We could take the “genomes” ATTT, ATCT and GTCT and infer that the infection with sequence ATTT lead to the infection with sequence ATCT and this infection lead to the infection with sequence GTCT. This approach allows us learn about epidemiology and transmission in a completely novel way and can supplement more traditional contact tracing and case-based reporting.

For a few years now, we’ve been working on the Nextstrain software platform, which aims to make genomic epidemiology as rapid and as useful as possible. We had previously applied this to outbreaks like Ebola, Zika and seasonal flu. Owing to advances in technology and open data sharing, the genomes of 140 SARS-CoV-2 coronaviruses have been shared from all over the world via gisaid.org. As these genomes are shared, we download them from GISAID and incorporate them into a global map as quickly as possible and have an always up-to-date view of the genomic epidemiology of novel coronavirus at nextstrain.org/ncov.

The big picture looks like this at the moment:


where we can see the earliest infections in Wuhan, China in purple on the left side of the tree. All these genomes from Wuhan have a common ancestor in late Nov or early Dec, suggesting that this virus has emerged recently in the human population.

The first case in the USA was called “USA/WA1/2020”. This was from a traveller directly returning from Wuhan to Snohomish County on Jan 15, with a swab collected on Jan 19. This virus was rapidly sequenced by the US CDC Division of Viral Diseases and shared publicly on Jan 24 (huge props to the CDC for this). We can zoom into the tree to place WA1 among related viruses:


The virus has an identical genome to the virus Fujian/8/2020 sampled in Fujian on Jan 21, also labeled as a travel export from Wuhan, suggesting a close relationship between these two cases.

Last week the Seattle Flu Study started screening samples for COVID-19 as described here. Soon after starting screening we found a first positive in a sample from Snohomish County. The case was remarkable in that it was a “community case”, only the second recognized in the US, someone who had sought treatment for flu-like symptoms, been tested for flu and then sent home owing to mild disease. After this was diagnostically confirmed by Shoreline Public Health labs on Fri Feb 28 we were able to immediately get the sample USA/WA2/2020 on a sequencer and have a genome available on Sat Feb 29. The results were remarkable. The WA2 case was identical to WA1 except that it had three additional mutations.


This tree structure is consistent with WA2 being a direct descendent of WA1. If this virus arrived in Snohomish County in mid-January with the WA1 traveler from Wuhan and circulated locally for 5 weeks, we’d expect exactly this pattern, where the WA2 genome is a copy of the WA1 genome except it has some mutations that have arisen over the 5 weeks that separate them.

Again, this tree structure is consistent with a transmission chain leading from WA1 to WA2, but we wanted to assess the probability of this pattern arising by chance instead of direct transmission. Scientists often try to approach this situation by thinking of a “null model”, ie if it was coincidence, how likely of a coincidence was it? Here, WA1 and WA2 share the same genetic variant at site 18060 in the virus genome, but only 2/59 sequenced viruses from China possess this variant. Given this low frequency, we’d expect probability of WA2 randomly having the same genetic variant at 2/59 = 3%. To me, this not quite conclusive evidence, but still strong evidence that WA2 is a direct descendent of WA1.

Additional evidence for the relationship between these cases comes from location. The Seattle Flu Study had screened viruses from all over the greater Seattle area, however, we got the positive hit in Snohomish County with cases less than 15 miles apart. This by itself would only be suggestive, but combined with the genetic data, is firmer evidence for continued transmission.

I’ve been referring to this scenario as “cryptic transmission”. This is a technical term meaning “undetected transmission”. Our best guess of a scenario looks something like:


We believe this may have occurred by the WA1 case having exposed someone else to the virus in the period between Jan 15 and Jan 19 before they were isolated. If this second case was mild or asymptomatic, contact tracing efforts by public health would have had difficulty detecting it. After this point, community spread occurred and was undetected due to the CDC narrow case definition that required direct travel to China or direct contact with a known case to even be considered for testing. This lack of testing was a critical error and allowed an outbreak in Snohomish County and surroundings to grow to a sizable problem before it was even detected.

Knowing that transmission was initiated on Jan 15 allows us to estimate the total number of infections that exist in this cluster today. Our preliminary analysis puts this at 570 with an 90% uncertainty interval of between 80 and 1500 infections.

Back on Feb 8, I tweeted this thought experiment:


We know that Wuhan went from an index case in ~Nov-Dec 2019 to several thousand cases by mid-Jan 2020, thus going from initial seeding event to widespread local transmission in the span of ~9-10 weeks. We now believe that the Seattle area seeding event was ~Jan 15 and we’re now ~7 weeks later. I expect Seattle now to look like Wuhan around ~1 Jan, when they were reporting the first clusters of patients with unexplained viral pneumonia. We are currently estimating ~600 infections in Seattle, this matches my phylodynamic estimate of the number of infections in Wuhan on Jan 1. Three weeks later, Wuhan had thousands of infections and was put on large-scale lock-down. However, these large-scale non-pharmaceutical interventions to create social distancing had a huge impact on the resulting epidemic. China averted many millions of infections through these intervention measures and cases there have declined substantially.


This suggests that this is controllable. We’re at a critical junction right now, but we can still mitigate this substantially.

Some ways to implement non-pharmaceutical interventions include:

  • Practicing social distancing, such as limiting attendance at events with large groups of people
  • Working from home, if your job and employer allows it
  • Staying home if you are feeling ill
  • Take your temperature daily, if you develop a fever, self-isolate and call your doctor
  • Implementing good hand washing practices - it is extremely important to wash hands regularly
  • Covering coughs and sneezes in your elbow or tissue
  • Avoiding touching your eyes, nose, and mouth with unwashed hands
  • Disinfecting frequently touched surfaces, such as doorknobs
  • Beginning some preparations in anticipation of social distancing or supply chain shortages, such as ensuring you have sufficient supplies of prescription medicines and ensuring you have about a 2 week supply of food and other necessary household goods.
  • With these preparation in mind, it is important to not panic buy. Panic buying unnecessarily increases strain on supply chains and can make it difficult to ensure that everyone is able to get supplies that they need.

For more information please see:

I started following what’s now referred to as “novel coronavirus (nCoV)” on Jan 6 when I started to notice reports of a cluster of viral pneumonia of unknown origin in Wuhan, China. Just 4 days later on Jan 10, a first genome was released on Virological.org only to be followed by five more the following day via GISAID.org. From very early on, it was clear that the nCoV genomes lacked the expected genetic diversity that would occur with repeated zoonotic events from a diverse animal reservoir. The simplest parsimonious explanation for this observation was that there was a single zoonotic spillover event into the human population in Wuhan between mid-Nov and mid-Dec and sustained human-to-human transmission from this point. However, at first I struggled to reconcile this lack of genetic diversity with WHO reports of “limited human-to-human” transmission. The conclusion of sustained human-to-human spread became difficult to ignore on Jan 17 when nCoV genomes from the two Thai travel cases that reported no market exposure showed the same limited genetic diversity. This genomic data represented one of the first and strongest indications of sustained epidemic spread. As this became clear to me, I spent the week of Jan 20 alerting every public health official I know.

At this moment there are 54 publicly shared viral genomes, with genomes being shared by public health and academic groups all over the world 3-6 days after sample collection. I can’t overstate how remarkable this is and what an inflection point it is for the field of genomic epidemiology. Seasonal influenza had been far ahead of the general curve, but there we were still generally seeing a ~1 month turnaround from sample collection to genome in the best of circumstances. Getting to a 3-6 day turnaround opens up huge new avenues in epidemiology.

Since the first nCoV genome was shared on Jan 10, we’ve been tracking viral transmission and evolution on nextstrain.org/ncov aiming to have ~1hr turnarounds from public deposition of genome data to inclusion in the live transmission tracking. We are also producing public situation reports describing what can be concluded from current genomic data. These reports have now been generously translated into 5 other languages by volunteers from Twitter. With groups all over the world working tirelessly to generate genomic data as rapidly as possible, I’m feeling a moral obligation to not hold up the analysis side. The entire Nextstrain team (shoutouts to Richard Neher, Emma Hodcroft, James Hadfield, Kairsten Fay, Thomas Sibley, Misja Ilcisin and Jover Lee 🙌) have come together to conduct analyses and tailor the platform for nCoV response. There’s also been a remarkable amount of sharing of pre-publication analyses on Virological.org and bioRxiv and scientific communication on Twitter. Although the situation is looking a bit dire at the moment, it’s been humbling to see scientists from all over the world break down traditional barriers to rapid scientific progress.

Genomic epidemiological studies have been used in academic contexts to reconstruct regional transmission of Ebola during the West African outbreak, estimate when Zika came to Brazil, and investigate how seasonal influenza circulates around the world. But these types of studies have moved out of the ivory tower, and public health agencies regularly sequence and analyze whole pathogen genomes to support surveillance and epidemiologic investigations of foodborne diseases, tuberculosis, and influenza, among other pathogens. Indeed, almost every infectious disease program at the Centers for Disease Control and Prevention now uses pathogen genomics, with increasing adoption by state and local health departments as well.

Pathogen genomics is a great addition to the public health toolbox. However, genomic data is complex and needs transformation from its raw form prior to analysis. Increasing use of pathogen genomics will require that public health agencies invest in advanced computational infrastructure, develop a broader technical workforce, and investigate new approaches to integrated data management and stewardship. As the number of agencies with genomic surveillance capabilities grows we’ll need a unified network of validated, reproducible ways to analyze data. The question then is how do we build that ecosystem?

In collaboration with the CDC’s Office of Advanced Molecular Detection (OAMD) we’ve written a whitepaper describing ten recommendations for supporting open pathogen genomic analysis in public health settings, which we’ve just posted to preprints.org (bioRxiv doesn’t take editorial content such as this).

To get a sense of the current landscape of pathogen genomic analysis in public health agencies, including investigating challenges encountered and overcome, we conducted a series of long form interviews with public health practitioners who use pathogen genomic data. We spoke with various branches and divisions at CDC, as well as state public health labs in the United States, provincial public health labs in Canada, and representatives from the European CDC. In a concurrent effort, the Africa CDC investigated similar questions and assessed capabilities for building genomic surveillance across the African continent. We learned a lot from these interviews about what parts of genomic surveillance are working well in public health agencies, as well as areas that need to be improved. This information forms the basis of our proposals.

This paper is just the first step in what we hope is a community-based discussion and development effort of standards and tools for everything from databases to pipelines to data visualization capabilities. These community-based efforts will be guided and supported by the Public Health Alliance for Genomic Epidemiology (PHA4GE). Announced in October 2019, PHA4GE is a global coalition that is actively working to establish consensus standards; document and share best practices; improve the availability of critical bioinformatic tools and resources; and advocate for greater openness, interoperability, accessibility and reproducibility in public health microbial bioinformatics. If you’re interested in joining in on this effort, please get in touch!

Our paper out today summarises twenty years of West Nile virus spread and evolution in the Americas visualised by Nextstrain, the result of a fantastic collaboration between multiple groups over the past couple of years. I wanted to give a bit of a backstory as to how we got here, how we’re using Nextstrain to tell stories, and where I see this kind of science going.

I’m not going to use this space to rephrase the content of the paper — it’s not a technical paper and is (I hope) easy to read and understand. The paper summarises all the available genomic data of WNV in the Americas, reconstructs the spread of the disease (westwards across North America with recent jumps into Central & South America), with each figure being a Nextstrain screenshot with a corresponding URL so that you can access an interactive, continually updated view of that same figure.

Instead I’d like to focus on how we used Nextstrain, and in particular its new narrative functionality, to present data in an innovative and updatable way. But first, what’s Nextstrain and how did this collaboration start?

How this all came about

Nextstrain has been up and running for around three years and is “an open-source project to harness the scientific and public health potential of pathogen genome data”. Nextstrain uses reproducible bioinformatics tooling (“augur”) and an innovative interactive visualisation platform (“auspice”) to allow us to provide continually updated views into the phylogenomics of various pathogens, all available on nextstrain.org.

Nate Grubaugh, who had just moved from Kristian Andersen’s group in San Diego to a P.I. position at Yale, was doing amazing work collecting, collaborating, and sequencing different arboviruses. Nate wanted to be able to continually share results from the WNV work, including the WestNile4k project, and Nextstrain provided the perfect tool for this — it’s fast, so analyses can be rerun whenever new data are available and the results are available for everyone to see and interact with online. Nate, his postdoc Anderson Brito, and myself set things up (all the steps to reproduce the analysis are on GitHub) and nextstrain.org/WNV/NA was born.

The proof is in the pudding and as a result of sharing continually updated data through Nextstrain, Nate had new collaborators reach out to him. The data they contributed helped to fill in the geographic coverage and improve our understanding of this disease’s spread.

Towards a new, interactive storytelling method of presenting results

Inspired by interactive visualisations and storytelling — which caused me to take a left-turn during my PhD — I wanted to allow scientists to use Nextstrain to tell stories about the data they were making available. I’m a big believer in Nextstrain’s mission to provide interactive views into the data (I helped to build it after all), but understanding what the data is telling you often requires considerable expertise in phylogenomics.

Nextstrain narratives allow short paragraphs of text to be “attached” to certain views of the data. By scrolling through the paragraphs you are presented with a story, allowing conveyance of the author’s interpretation and understanding of the data. At any time you can jump back to a “fully interactive” Nextstrain view & interrogate the data yourself.

So, the content of the paper we’ve just published is available as an interactive narrative at nextstrain.org/narratives/twenty-years-of-WNV. I encourage you to go and read it (by scrolling through each paragraph), interact with the underlying data (click “Explore the data yourself” in the top-right corner), and compare this to the paper we’ve just published.

WNV Narrative demo

We’re only beginning to scratch the surface of different ways to present scientific data & findings — see Brett Victor’s talks for a glimpse into the future. In a separate collaboration, we’ve been using narratives to provide situation-reports for the ongoing Ebola outbreak in the DRC every time new samples are sequenced, helping to bridge the gap between genomicists and epidemiologists. If you’re interested in writing a narrative for your data (or any data available on Nextstrain) then see this section of the auspice documentation.

A big thanks to all the amazing people involved in this collaboration, especially Anderson & Nate, as well as Trevor Bedford & Colin Megill for help in designing the narratives interface.

I’ve been remiss for the past year about posting our biannual flu report publicly. We’ve now however posted our Sep 2019 flu report to bioXriv where it details recent seasonal influenza evolution during 2019 and projections for spread over the next 12 months to Sep 2020. Our timing with this report is designed to correspond to the timing of the World Health Organization’s Vaccine Composition Meeting being held this week in Geneva. Richard Neher has lead much of this analysis, with John Huddleston providing fitness model projections and Barney Potter contributing to data curation.

With each of the reports, we generally end up focusing on a handful of emerging clades within each influenza lineage and tracking their rate of global spread and viral characteristics. In one current example, H3N2 viruses have diversified into a large number of competing lineages, however, over the course of 2019 we’ve seen the emergence and spread of A1b/197R viruses as well as A1b/137F viruses. Over the course of the past ~9 months these clades have grown from nearly 0% global frequency to a combined >50% global frequency. Previously, Richard and colleagues had identified local branching index (LBI) as a strong predictor of future strain success. The idea is basically that clades that are currently outcompeting their relatives are estimated to be higher fitness and so are predicted to continue to increase in frequency into the future. In previous reports, we’ve used LBI to project which clades will come in to dominate.

More recently, John has sought to build a fitness model that makes quantitative predictions of clade frequencies based on LBI as well as viral characteristics. There is some description of this model in the September report. We’re hoping to have a preprint and source code shared shortly. However, we’ve now elected to start including live model predictions for H3N2 at nextstrain.org/flu. The bottom panel shows frequencies of different clades up to present as well as a forecast over the following 12 months:

clade-frequencies

Here, it’s clear that the model follows LBI in predicting the further growth of 197R viruses. Additionally, in the “color by” dropdown menu you can now select “fitness” to show fitness estimates for each virus and also select “distance to future population” to show amino acid match of sampled viruses to the predicted future population.

These forecasts will now be made automatically alongside our weekly site updates.