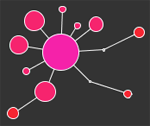
I’ve prepared a follow-up visualization to the one I did previously on coalescent genealogies. I’ve been working a lot lately with haplotype networks, in which we have a large sample of sequence variants from a population along with their frequencies and the mutational paths that connect them. I’ve been analyzing the spread of HIV variants in chronically infected individuals in this fashion. Here, I thought it would be useful to construct a simple visual display for what these networks should look like if evolution follows the standard null model with no selective effects and simple demography. I’m fairly pleased with the results. You can see them here.