Richard Neher and Boris Shraiman, along with myself, Colin Russell and Rod Daniels have just completed a new analysis of antigenic drift in the seasonal influenza virus. We’ve put a manuscript on “Prediction, dynamics, and visualization of antigenic phenotypes of seasonal influenza viruses” up on the arXiv and have created an interactive visualization of our model at HI.nextflu.org.
Much previous work on this topic, including my own, has focused on “antigenic cartography” in which antigenic phenotype is embedded into a 2D antigenic map where distances between viruses are proportional to drop in titer in the hemagglutination inhibition (HI) assay. Here, we take a complementary approach where drop in titer is directly mapped to the influenza phylogeny; specific branches are assigned drops in titer. Thus, rather than embedding into 2D Euclidean space, this model assumes embedding into tree space. As a model, it works quite well, allowing prediction of unmeasured titers at high accuracy. In the manuscript, we investigate the correlation between antigenic advancement and clade success, finding that more advanced clades tend to win in the global competition among viruses. However, we observe significant noise when the new clade is at very low frequency.
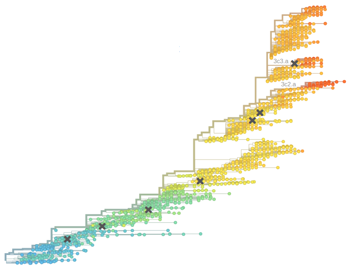
A major feature of the cartography-based approach is providing a single pictorial view of the antigenic relationships among viruses. This is enabled by the 2D basis for cartography. The tree-based model that we present here does not permit a single viewpoint. Instead, we provide an interactive visualization of the model, in which users can click on a particular reference virus in the phylogeny and see how other viruses relate to this focal virus. We allow coloring of the phylogeny by raw HI titer, as well as by model expectations, allowing exploration of why the model behaves as it does. We hope this approach will be useful in investigation of antigenic relationships among circulating influenza viruses.