It’s clear that there exists substantial global genetic diversity in influenza at any given moment. This level of diversity could be reflected in diverse local epidemics, or local epidemics could be homogeneous with specific locations encountering only a single strain each season, even while maintaining substantial diversity at the global level. This is an important distinction if we care about how local populations react to influenza epidemics and in assessing vaccine effectiveness. Here, I’ve sought to quantify this distinction.
I began by collecting all the sequences I could for influenza A/H3N2 from GenBank from 1995 to 2011, keeping only sequences with complete dates. Because we’re interested in functional diversity, I reduced this to only amino acid sequences from the HA1 protein and further reduced these sequences to 129 epitope sites following Munoz and Deem (2005). These epitope sites represent residues that when mutated often result in proteins that elicit a novel immune response, and hence mutations to these sites often provide a transmission advantage to the virus. I removed sequences which possessed gaps at any of these 129 sites, leaving a total of 8482 sequences to work from.
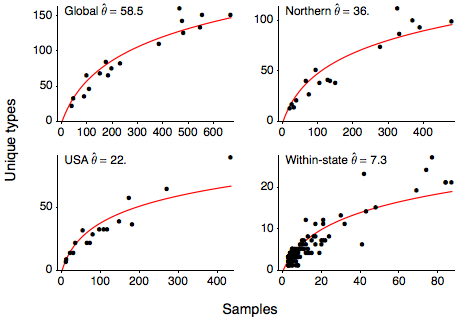
I next calculated the number of unique variants present for each Northern Hemisphere influenza season (October to March), giving the relationship between sample count and number of unique sequence types shown here. I calculated this relationship for the entire global sample, for the USA, Europe, Japan and Korea (Northern), for just the USA and within each state in the US. This relationship can be quantified with the Ewen’s sampling formula, giving an expectation for the number of unique variants k observed in a sample of n sequences
where θ represents the level of mutational input into the population. I estimate θ from the these relationships getting a global estimate of θ of 58.5 and a within-state estimate of θ of 7.3. Using the Ewen’s sampling formula, we predict that, in the average influenza season, 100 random infections sampled from the global population will yield 59 unique variants and 100 random infections sampled at the state-level will yield 23 unique variants.
It is common is measure diversity in terms of pairwise identity. In population genetics this is often referred to as heterozygosity, named because it is the probability that two randomly chosen haploid individuals (or chromosomes within a diploid individual) are distinct. This is the same measure as 1 minus the Simpson index (1 - λ) in ecology. Here, I find that 89% of pairs sampled from the global population are distinct and 72% of pairs sampled from within-state populations are distinct. Along these lines, it’s common to measure sequence “diversity” or π as the average number of mutations that separate random pairs of sequences. In this case, I find that pairs of sequences sampled from the global population are separated by 4.1 epitope mutations, and pairs of sequences sampled from within-state populations are separated by 2.6 epitope mutations. You may have noticed that θ estimated by Ewen’s doesn’t match up with θ estimated from pairwise diversity (58.5 vs. 4.1 and 7.3 vs. 2.6 for global and local samples, respectively). This is essentially a Ewens-Watterson test showing an overabundance of rare variants, consistent with the actions of natural selection or otherwise non-neutral demography.
So, although there is significantly more genetic variation at the global level, local variation is still substantial. We expect two people who get the flu within a state (and most likely a community) in the same season to have been infected by distinct viruses. It’s not clear whether viruses differing at one of these 129 epitope sites are always immunologically distinct, but many of these mutations to epitope sites should have an immunological impact.