Real-time tracking of virus evolution
Trevor Bedford (@trvrb)
31 Mar 2016
Structure and Computation Affinity Group Seminar
Scripps Research Institute
Slides at bedford.io/talks/
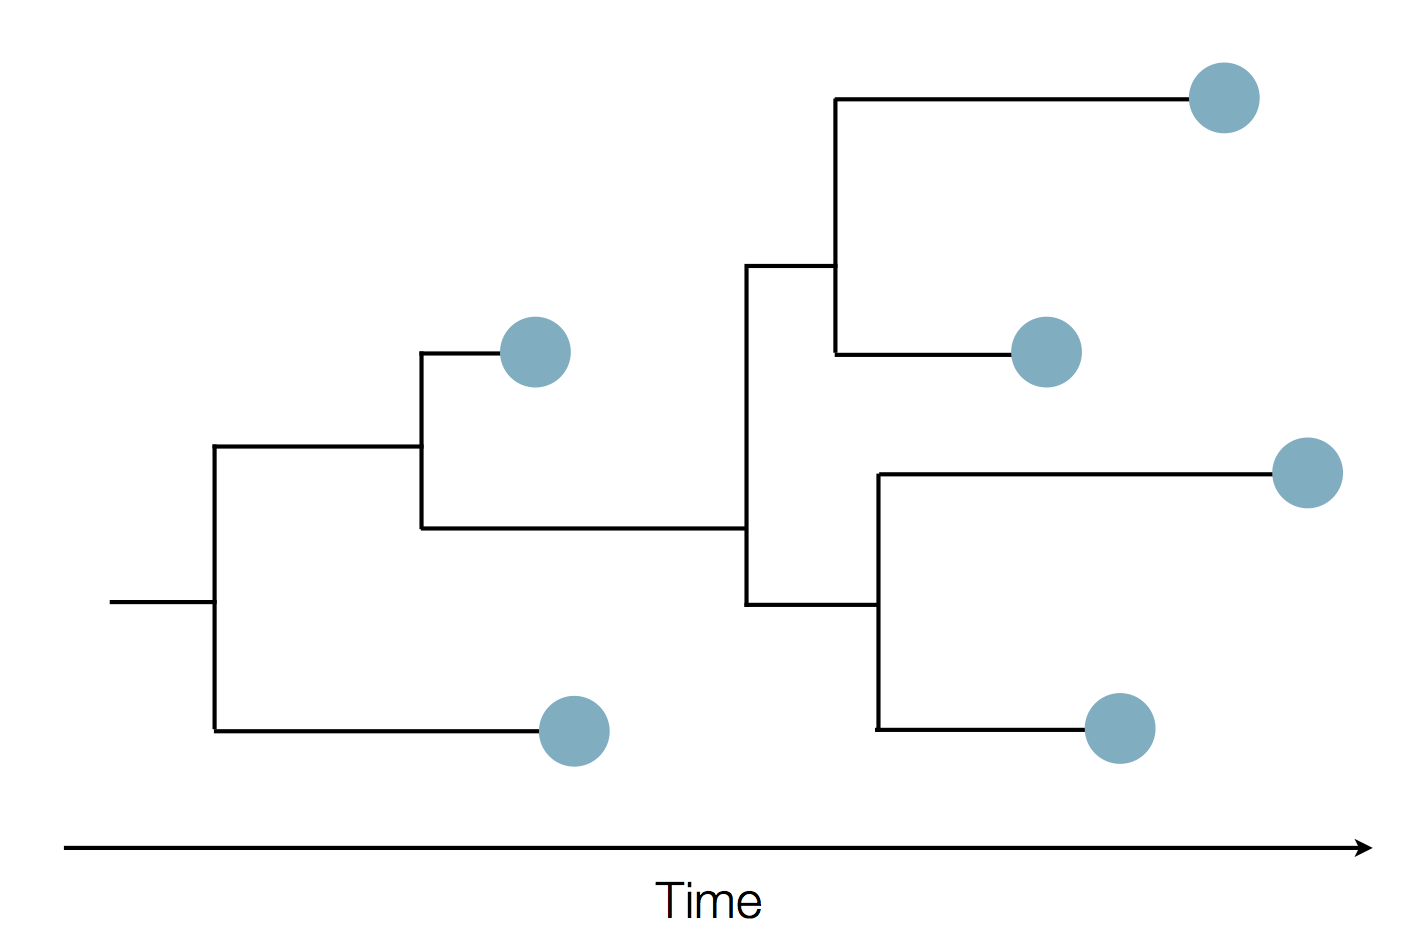
Phylogenies
Phylogenies describe history
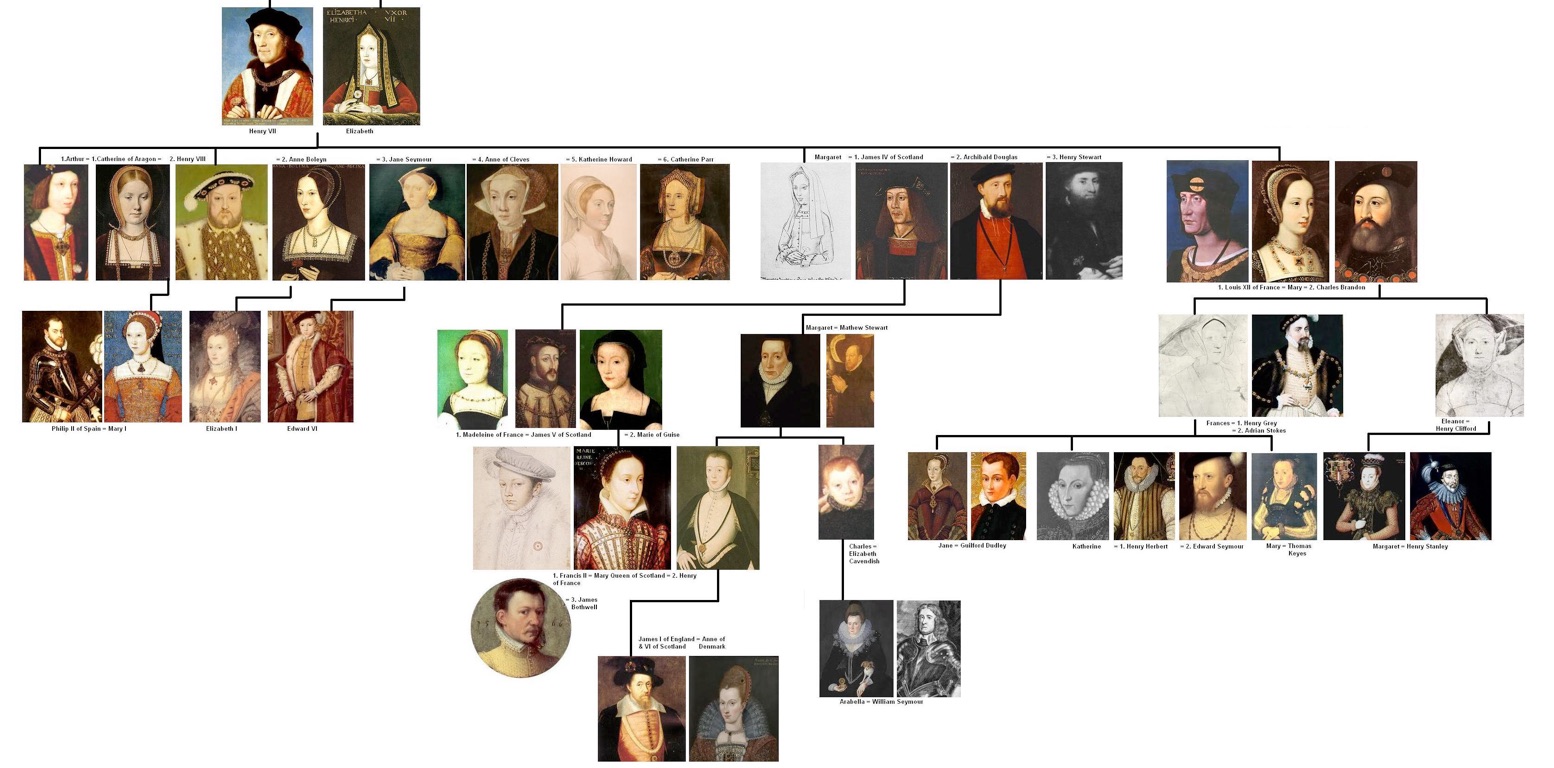
Phylogenies describe history
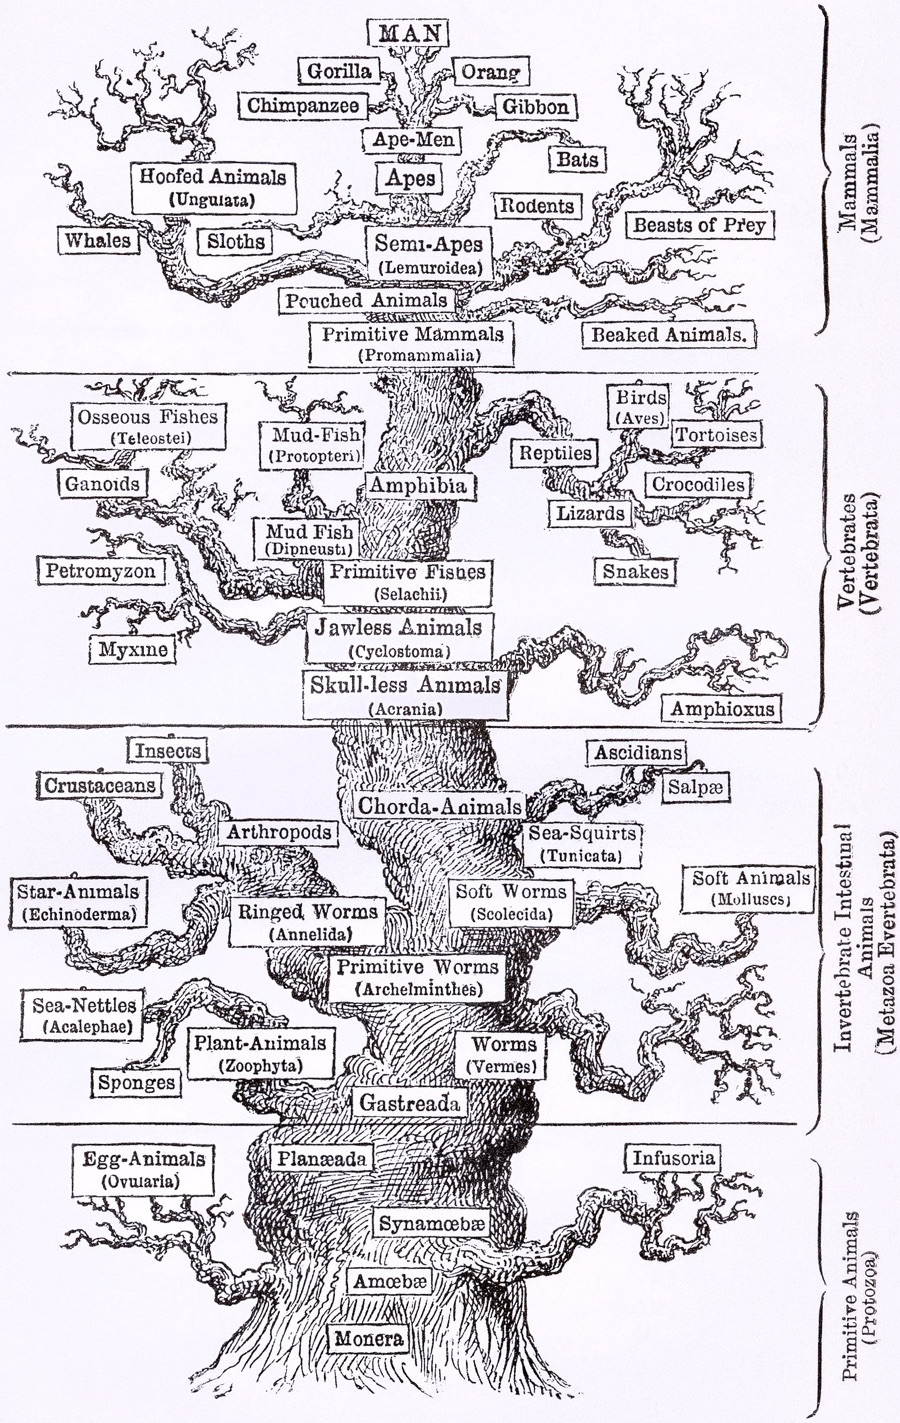
Phylogenies describe history
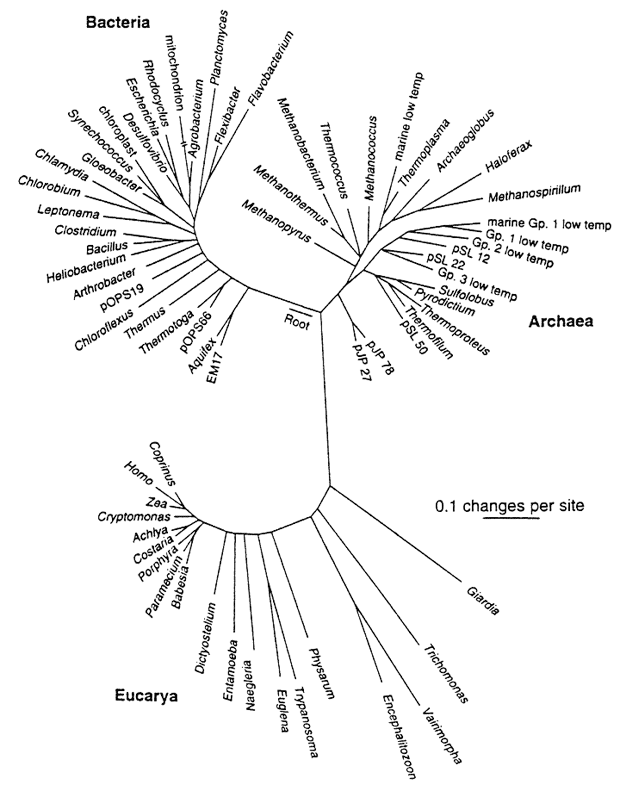
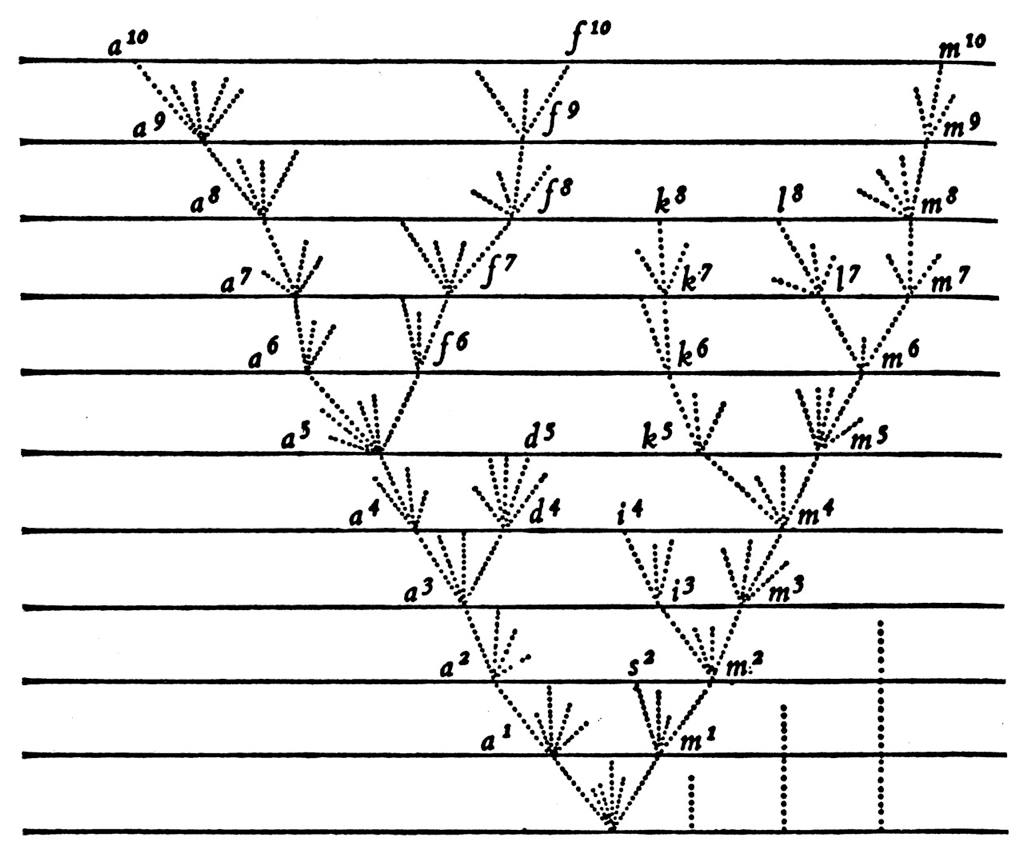
Phylogenies reveal process
Epidemics
Epidemic process
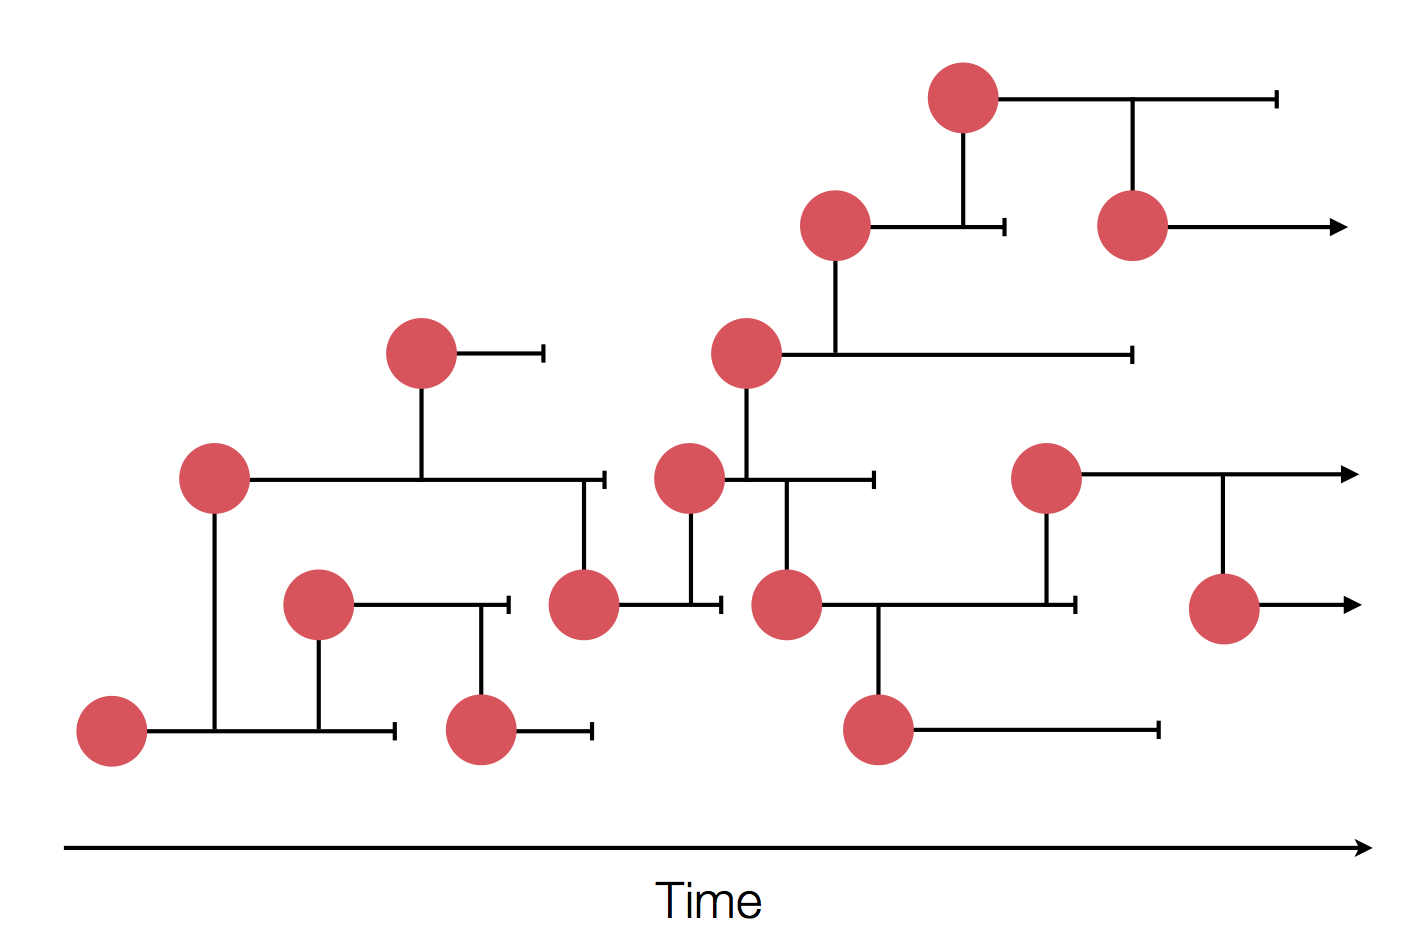
Sample some individuals
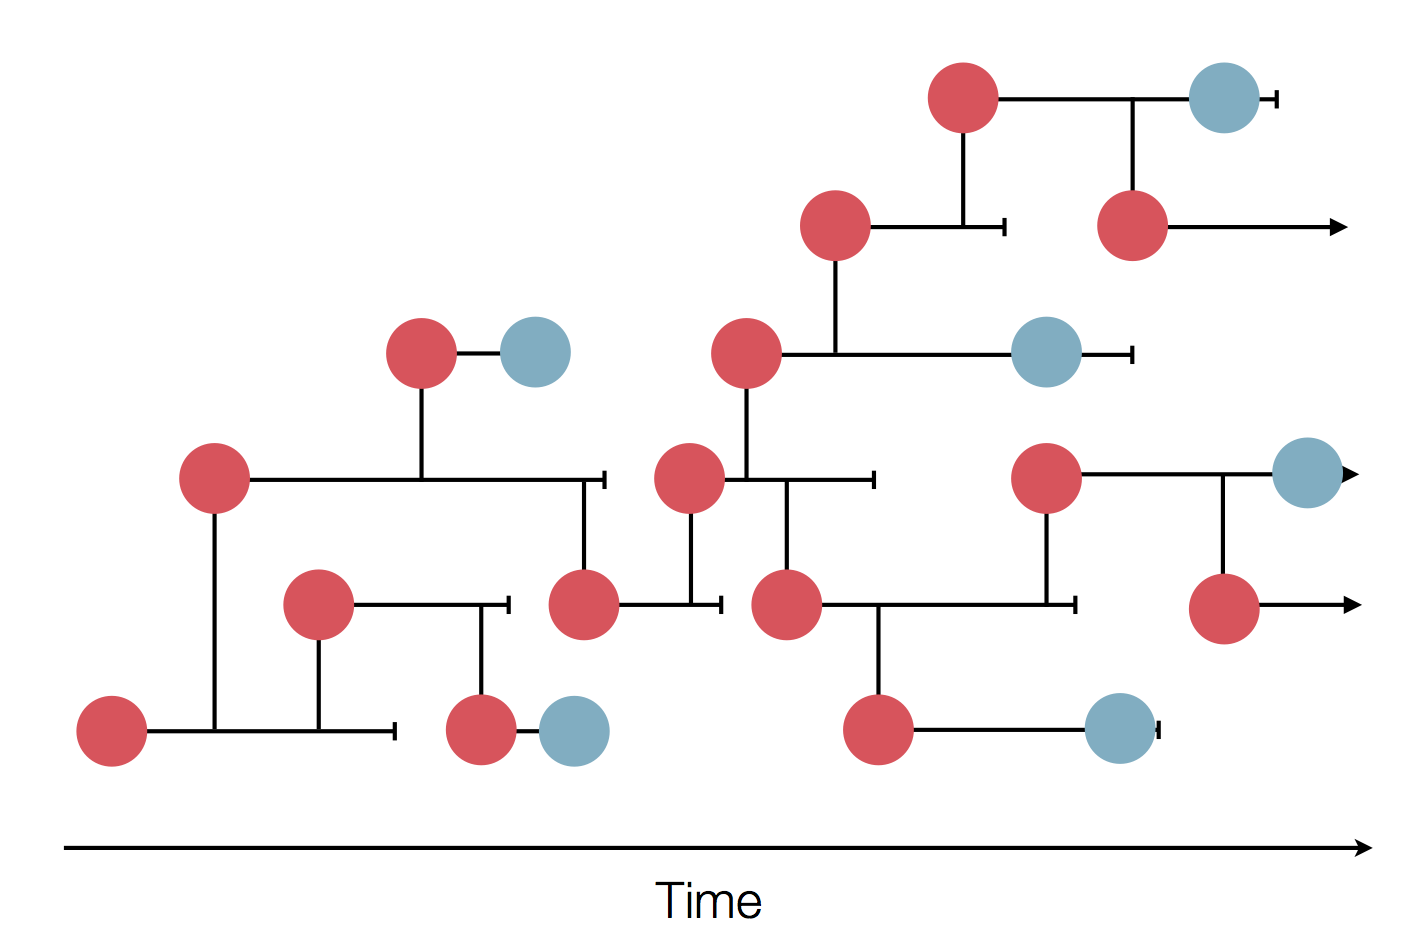
Sequence and determine phylogeny
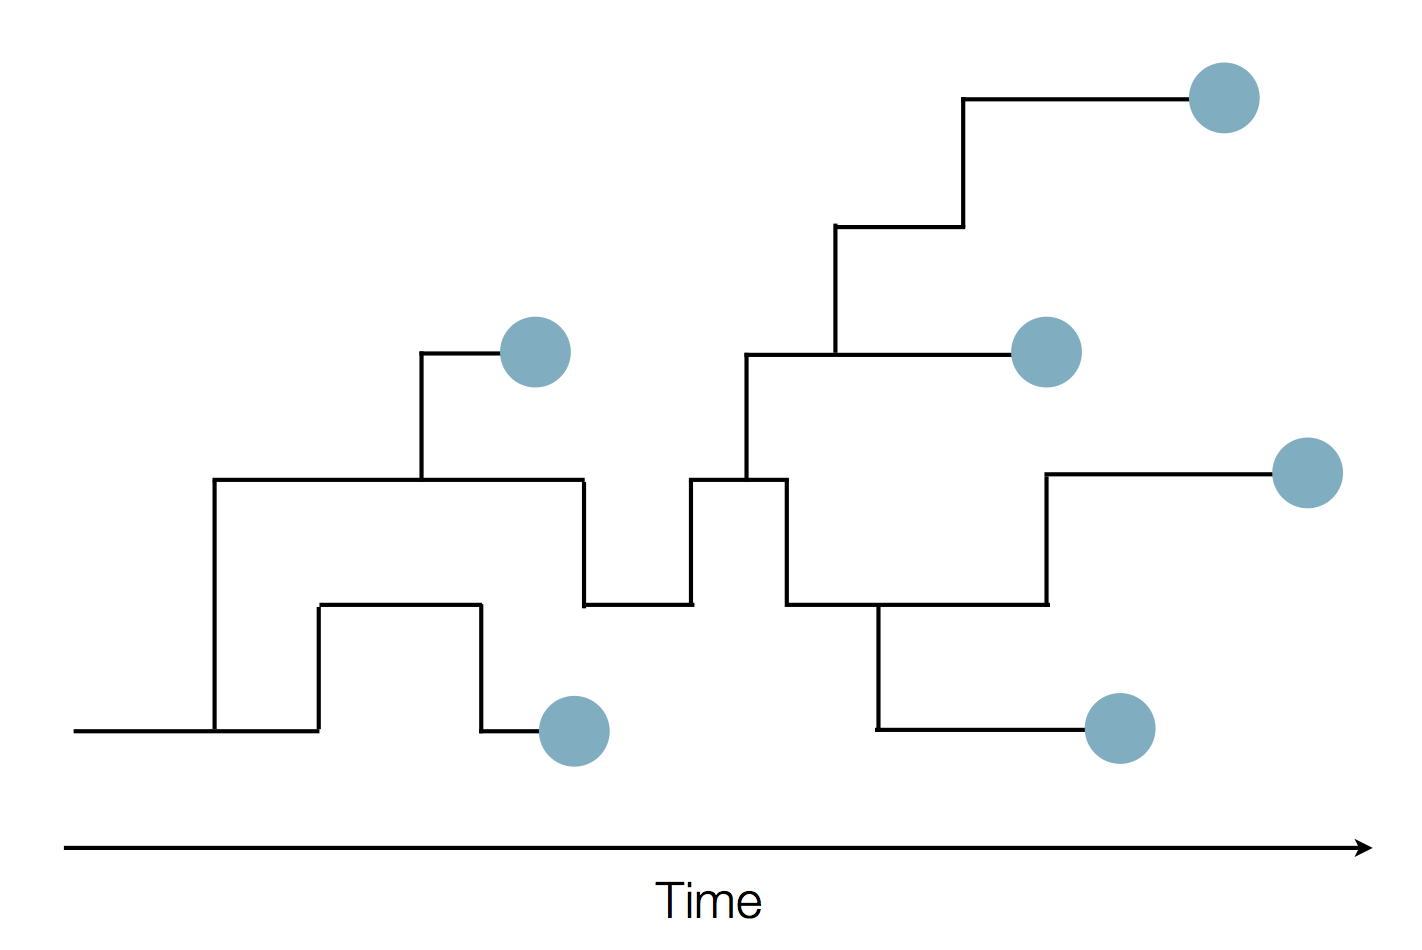
Sequence and determine phylogeny
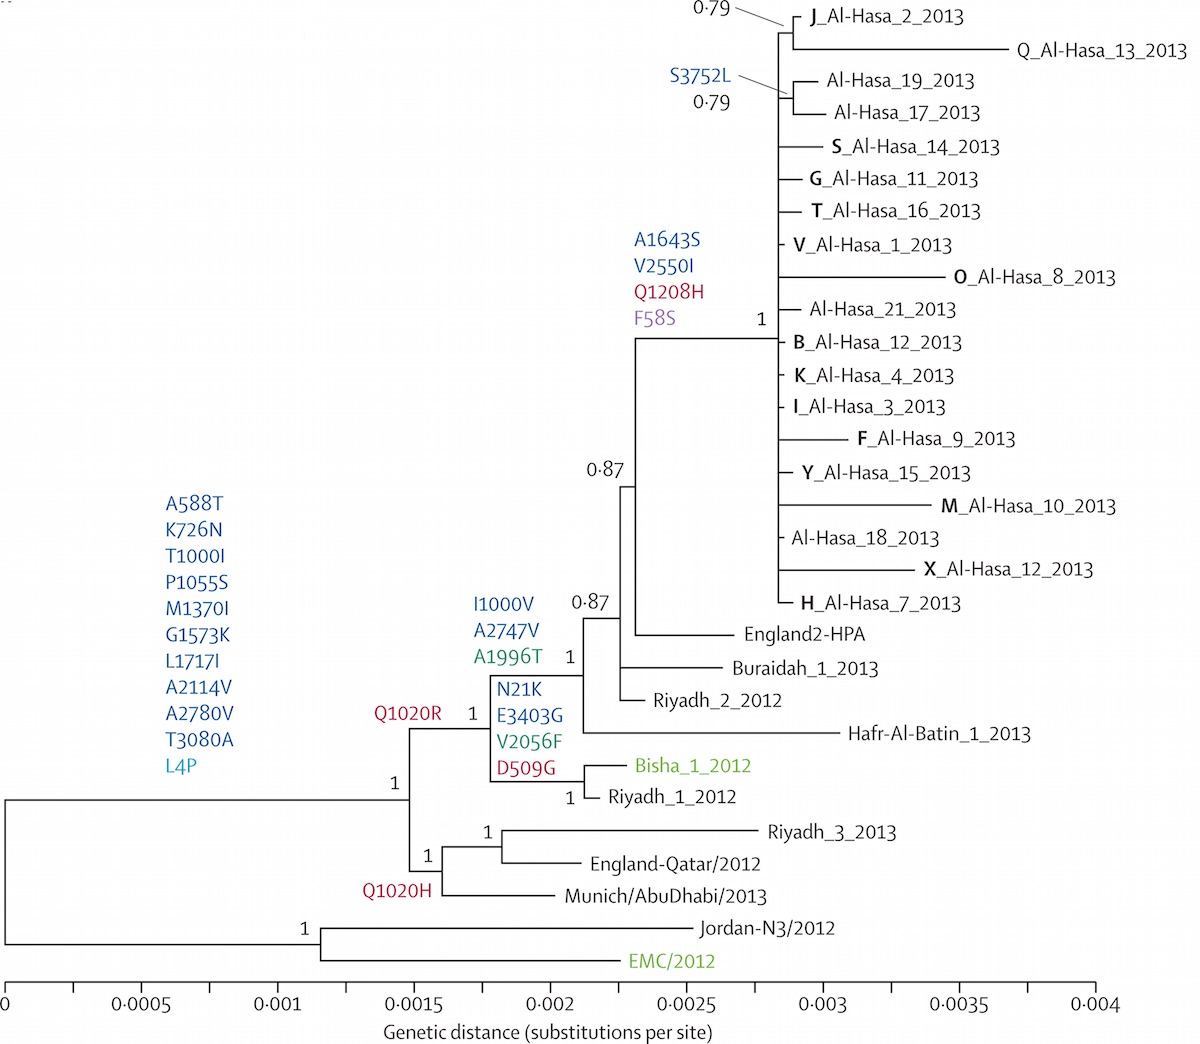
Localized Middle Eastern MERS-CoV phylogeny
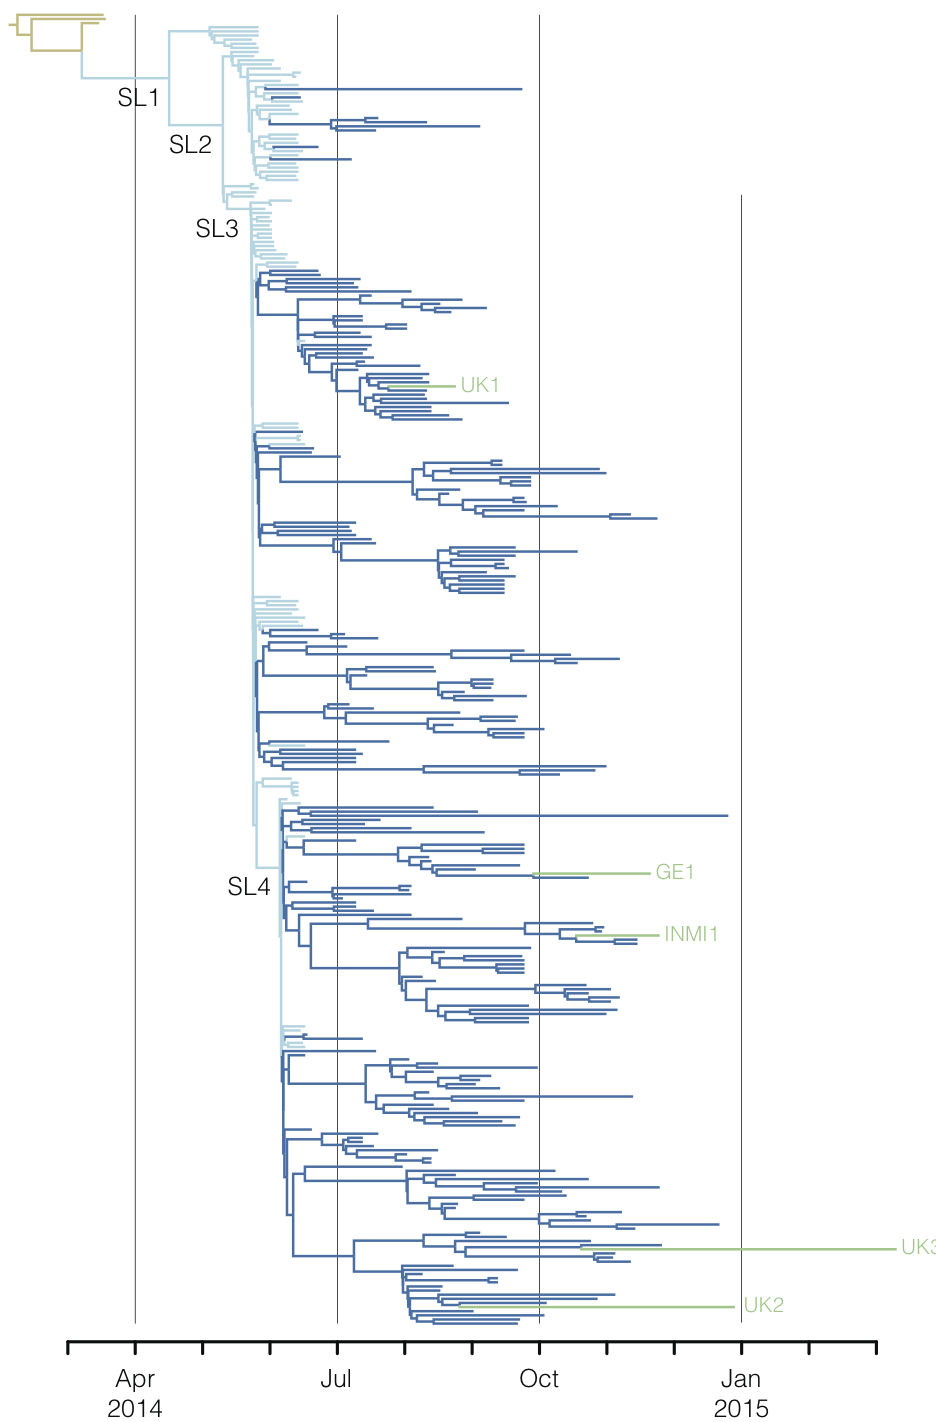
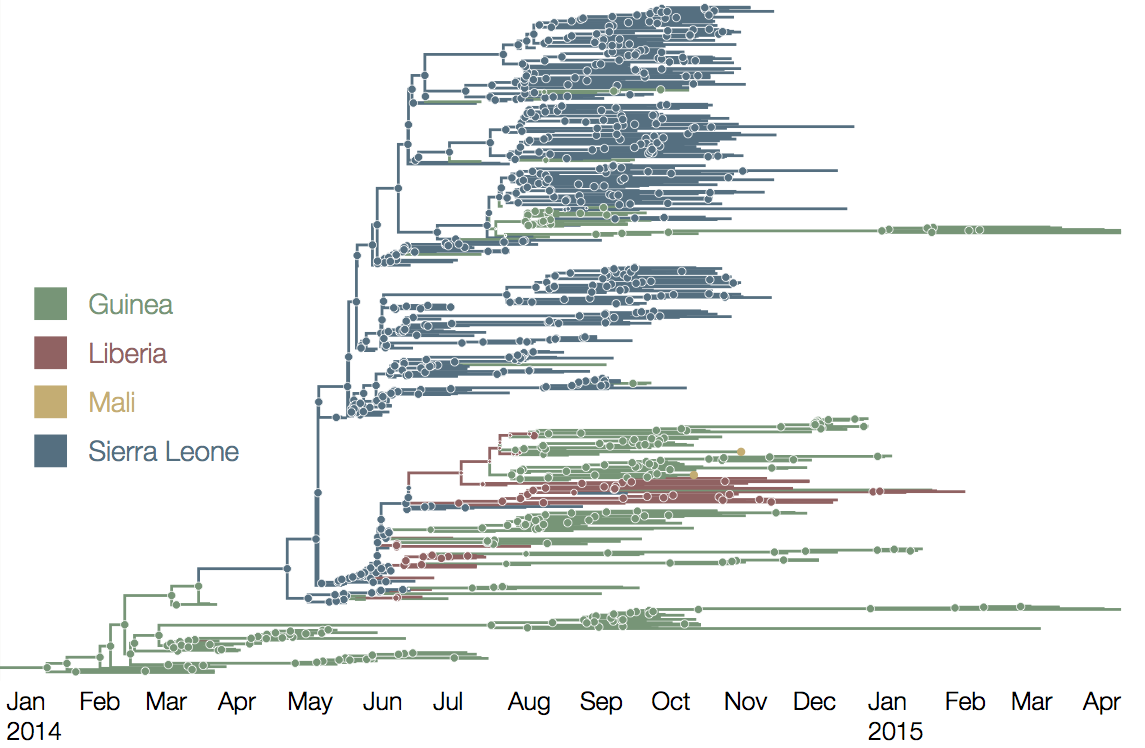
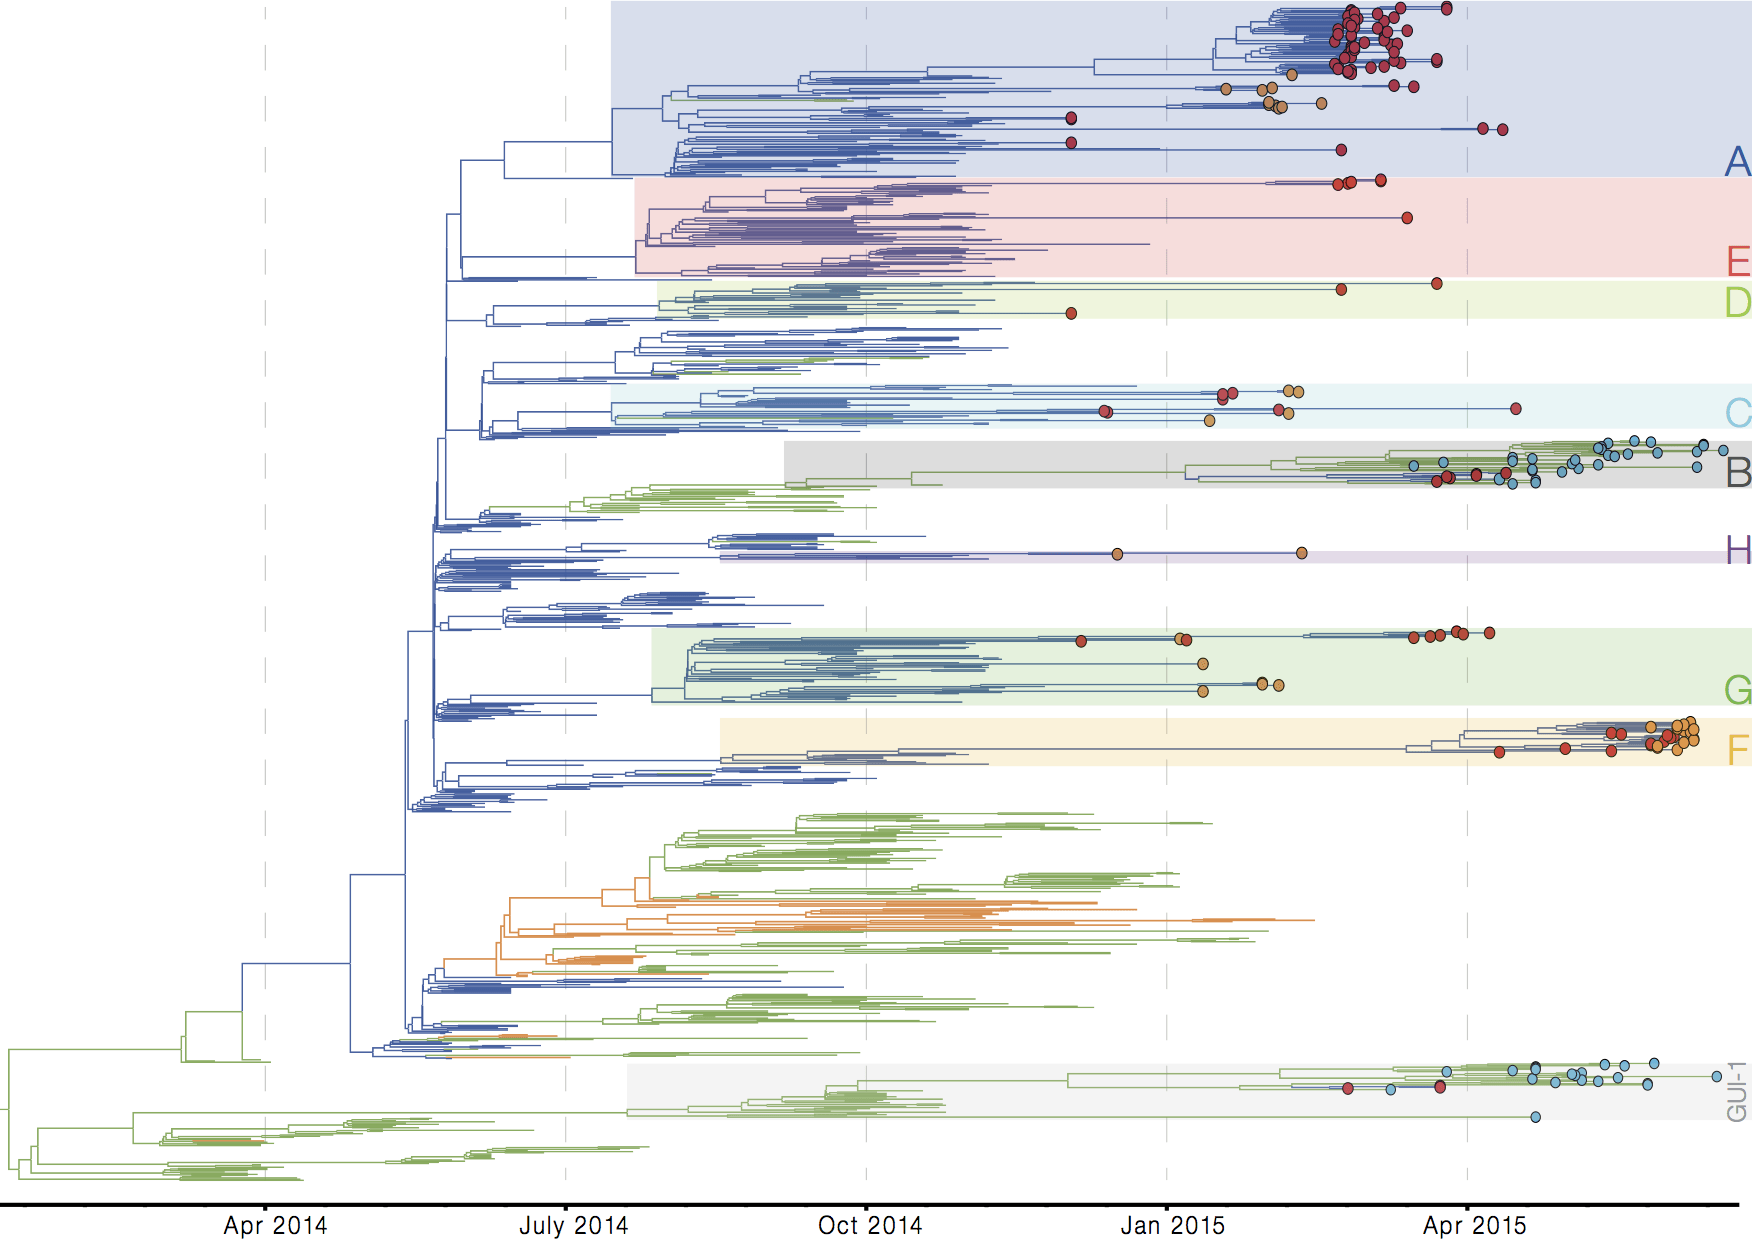
Regional West African Ebola phylogeny
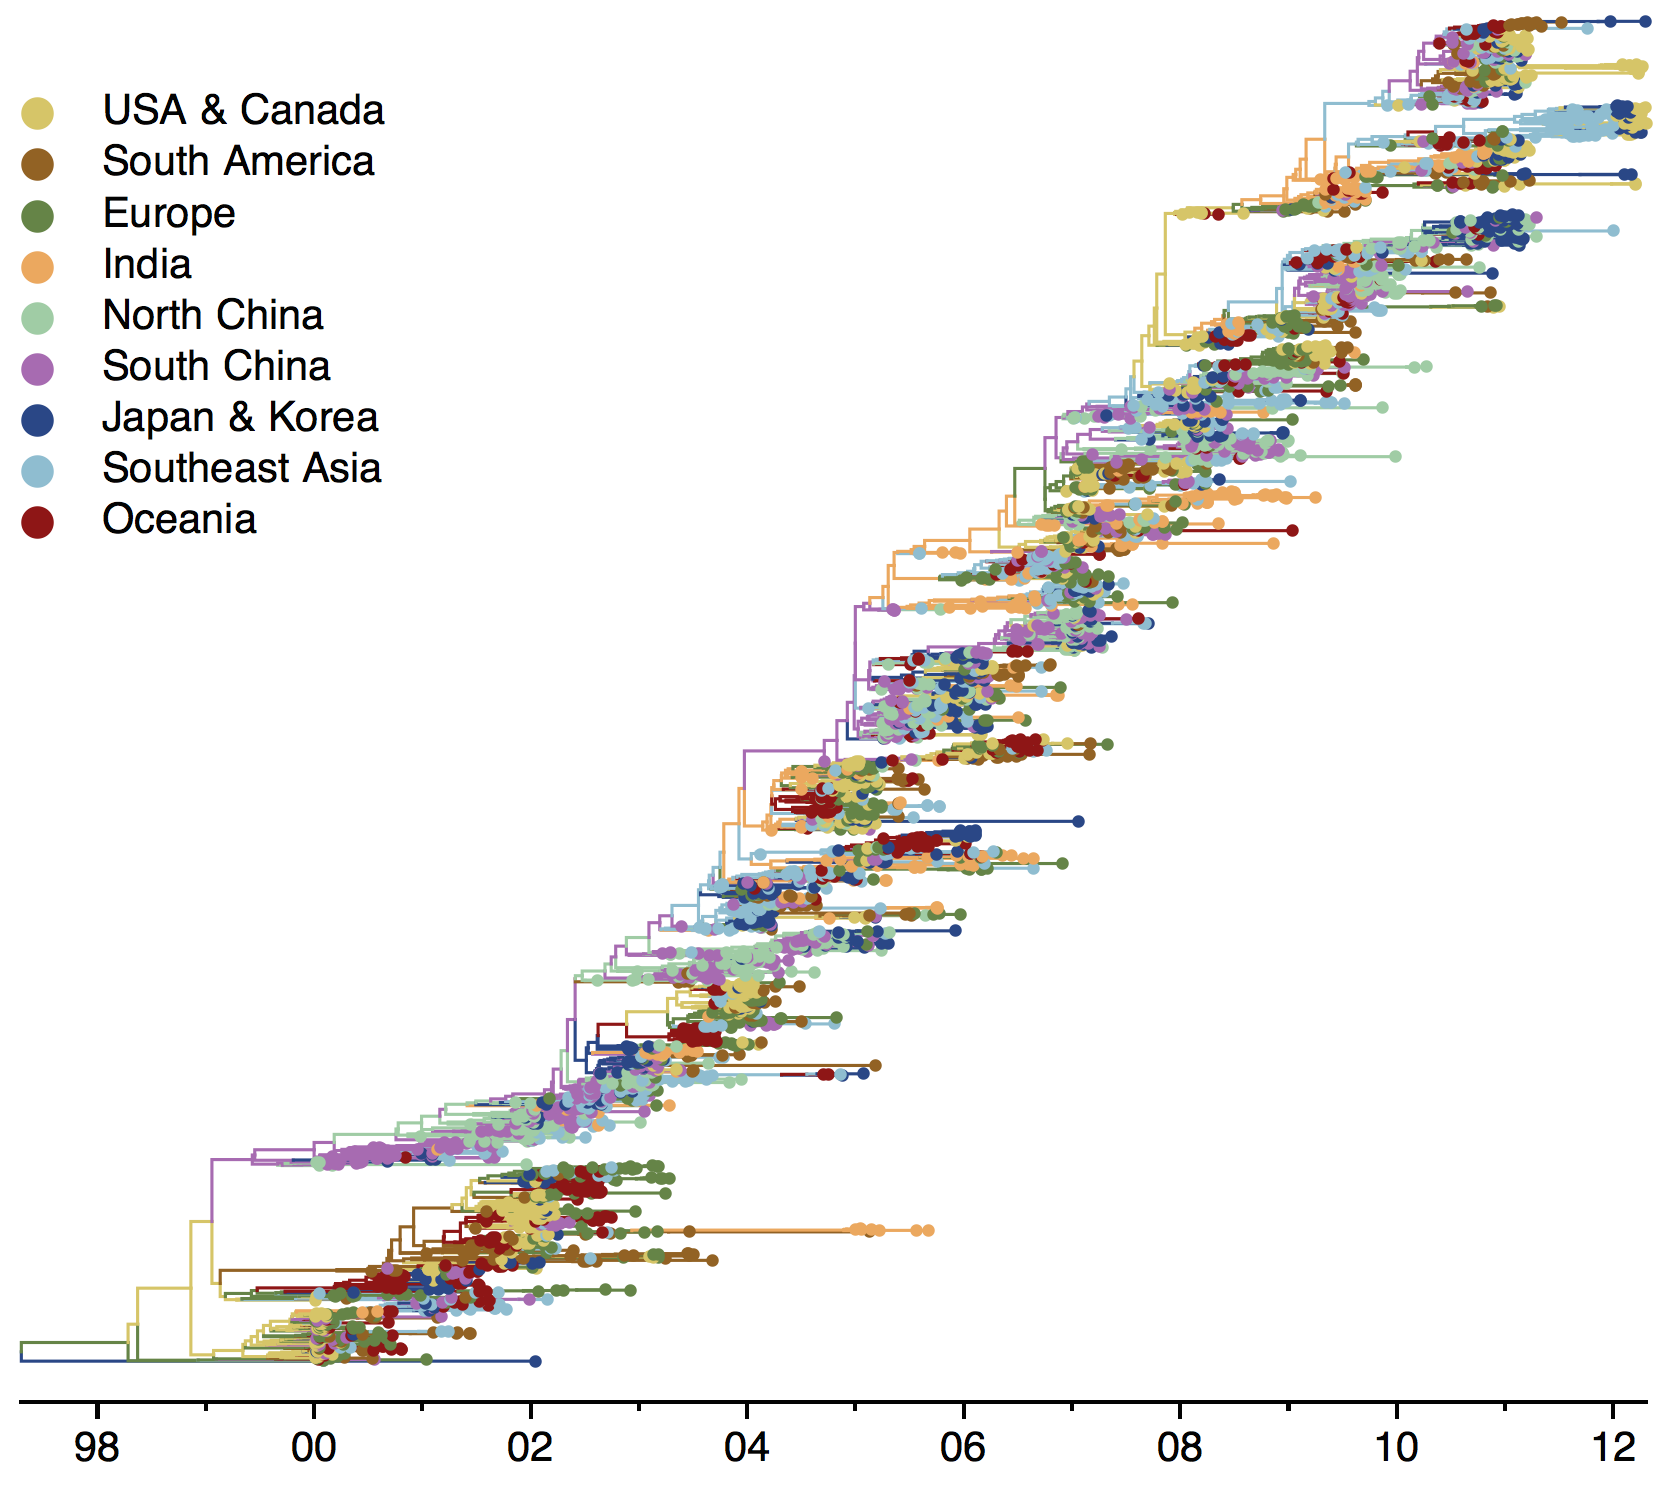
Global influenza phylogeny
Applications of evolutionary analysis for influenza vaccine strain selection and charting spread of Ebola and Zika
Influenza
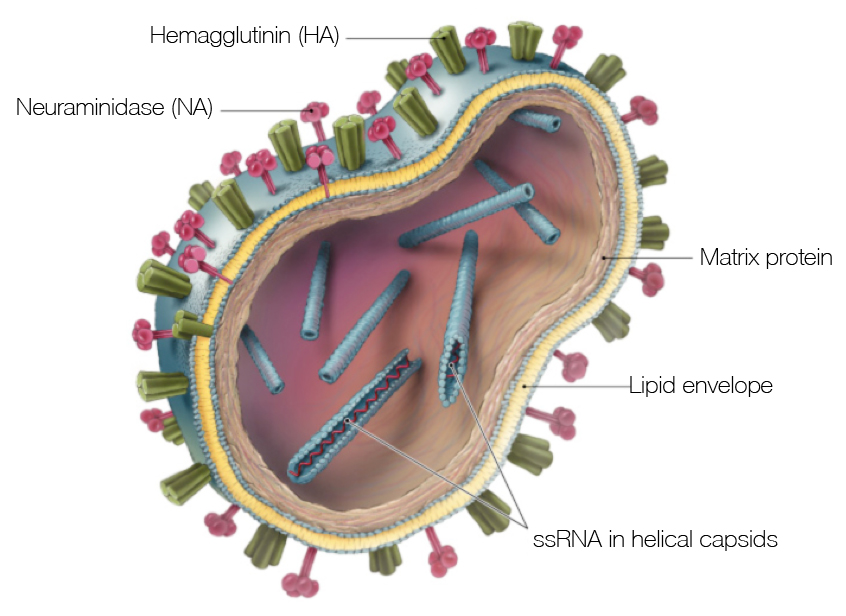
Influenza virion
Influenza H3N2 vaccine updates
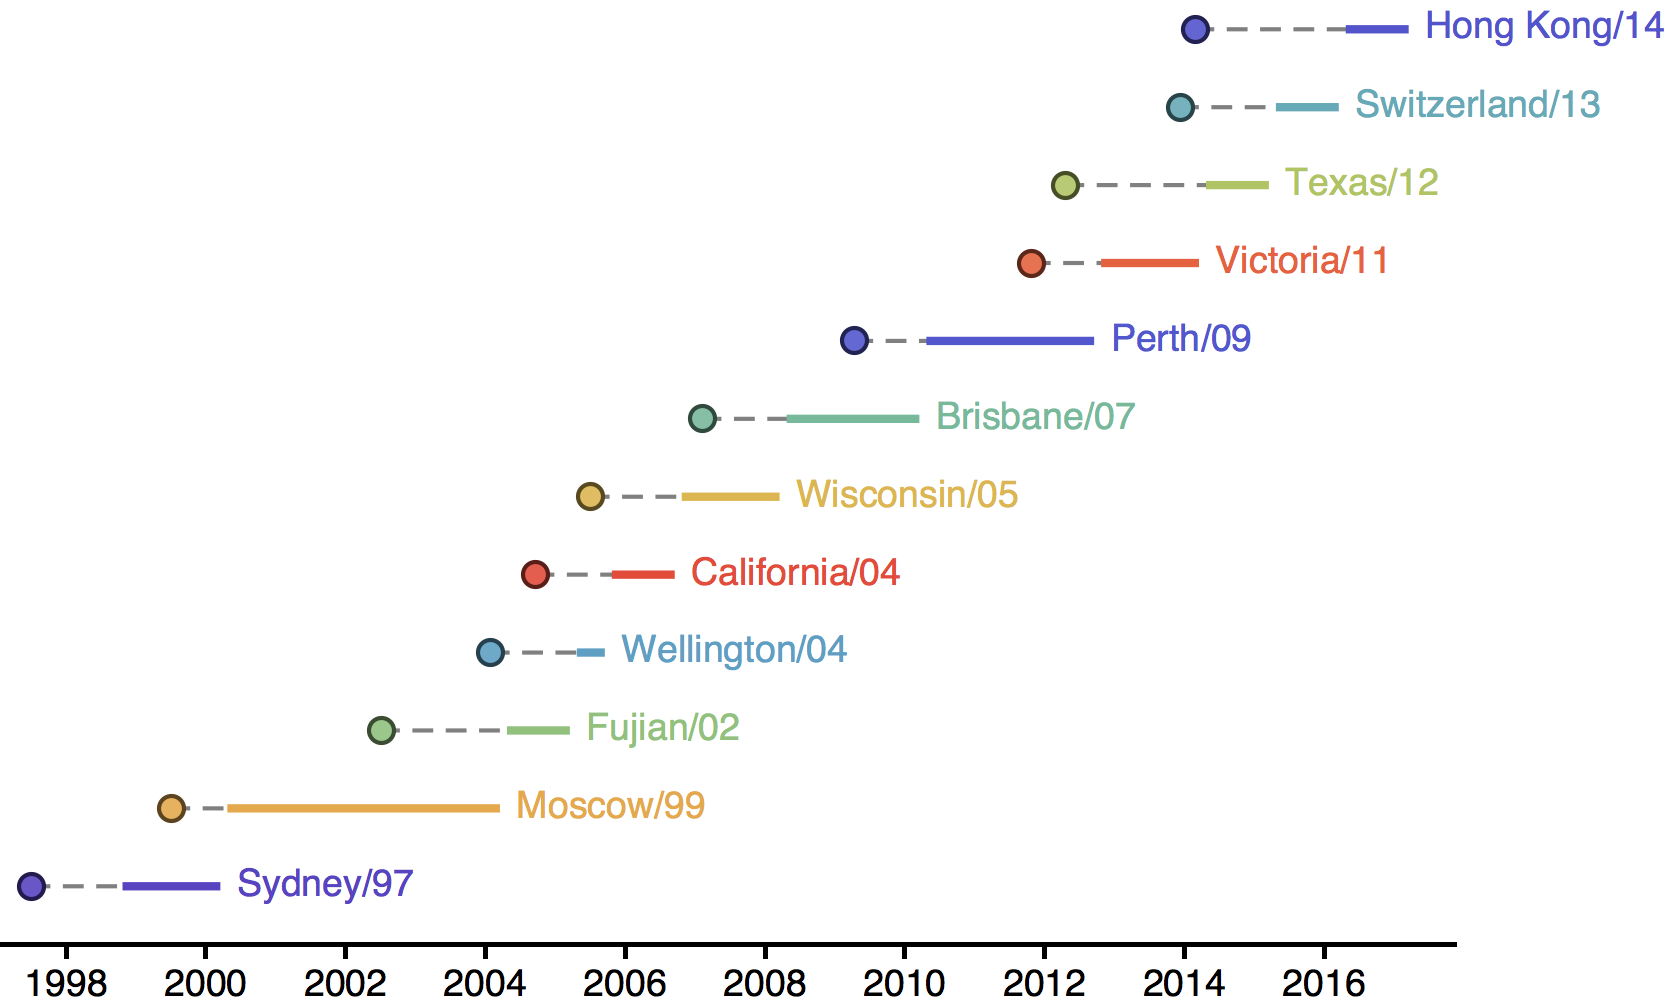
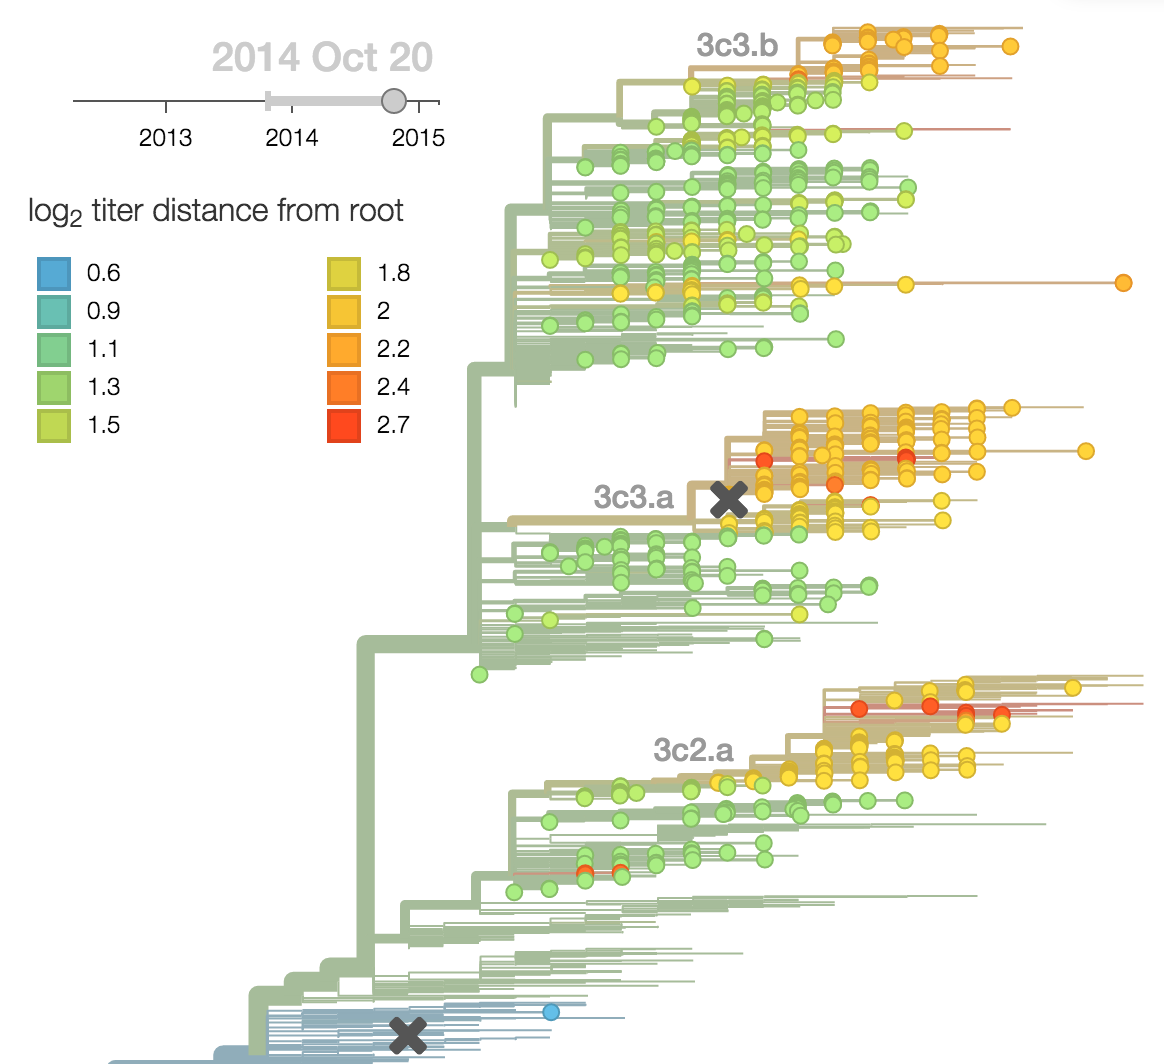
H3N2 phylogeny showing antigenic drift
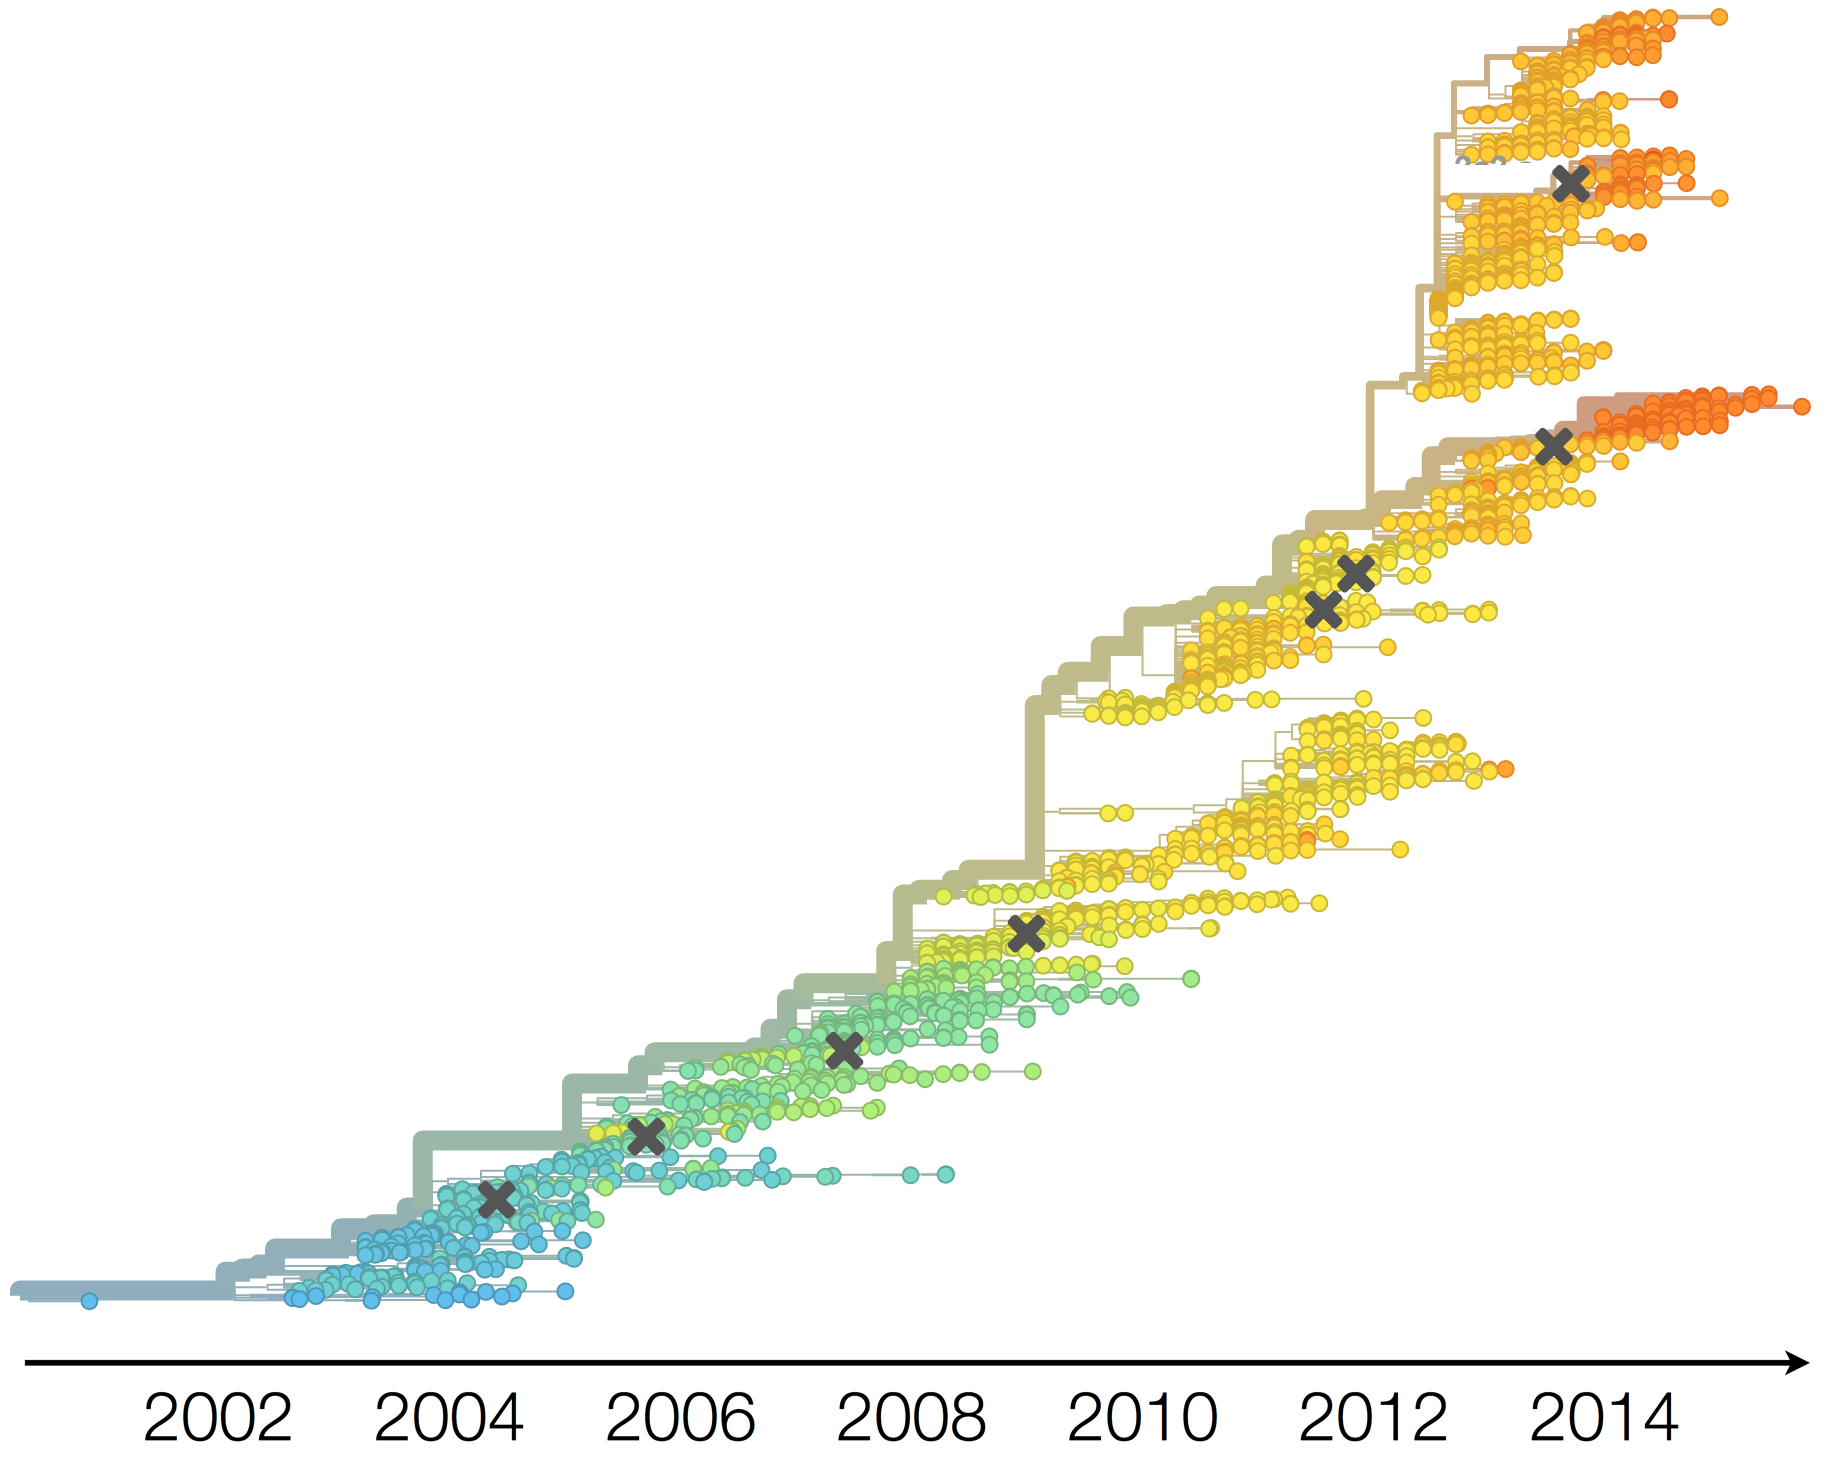
H3N2 phylogeny showing antigenic drift
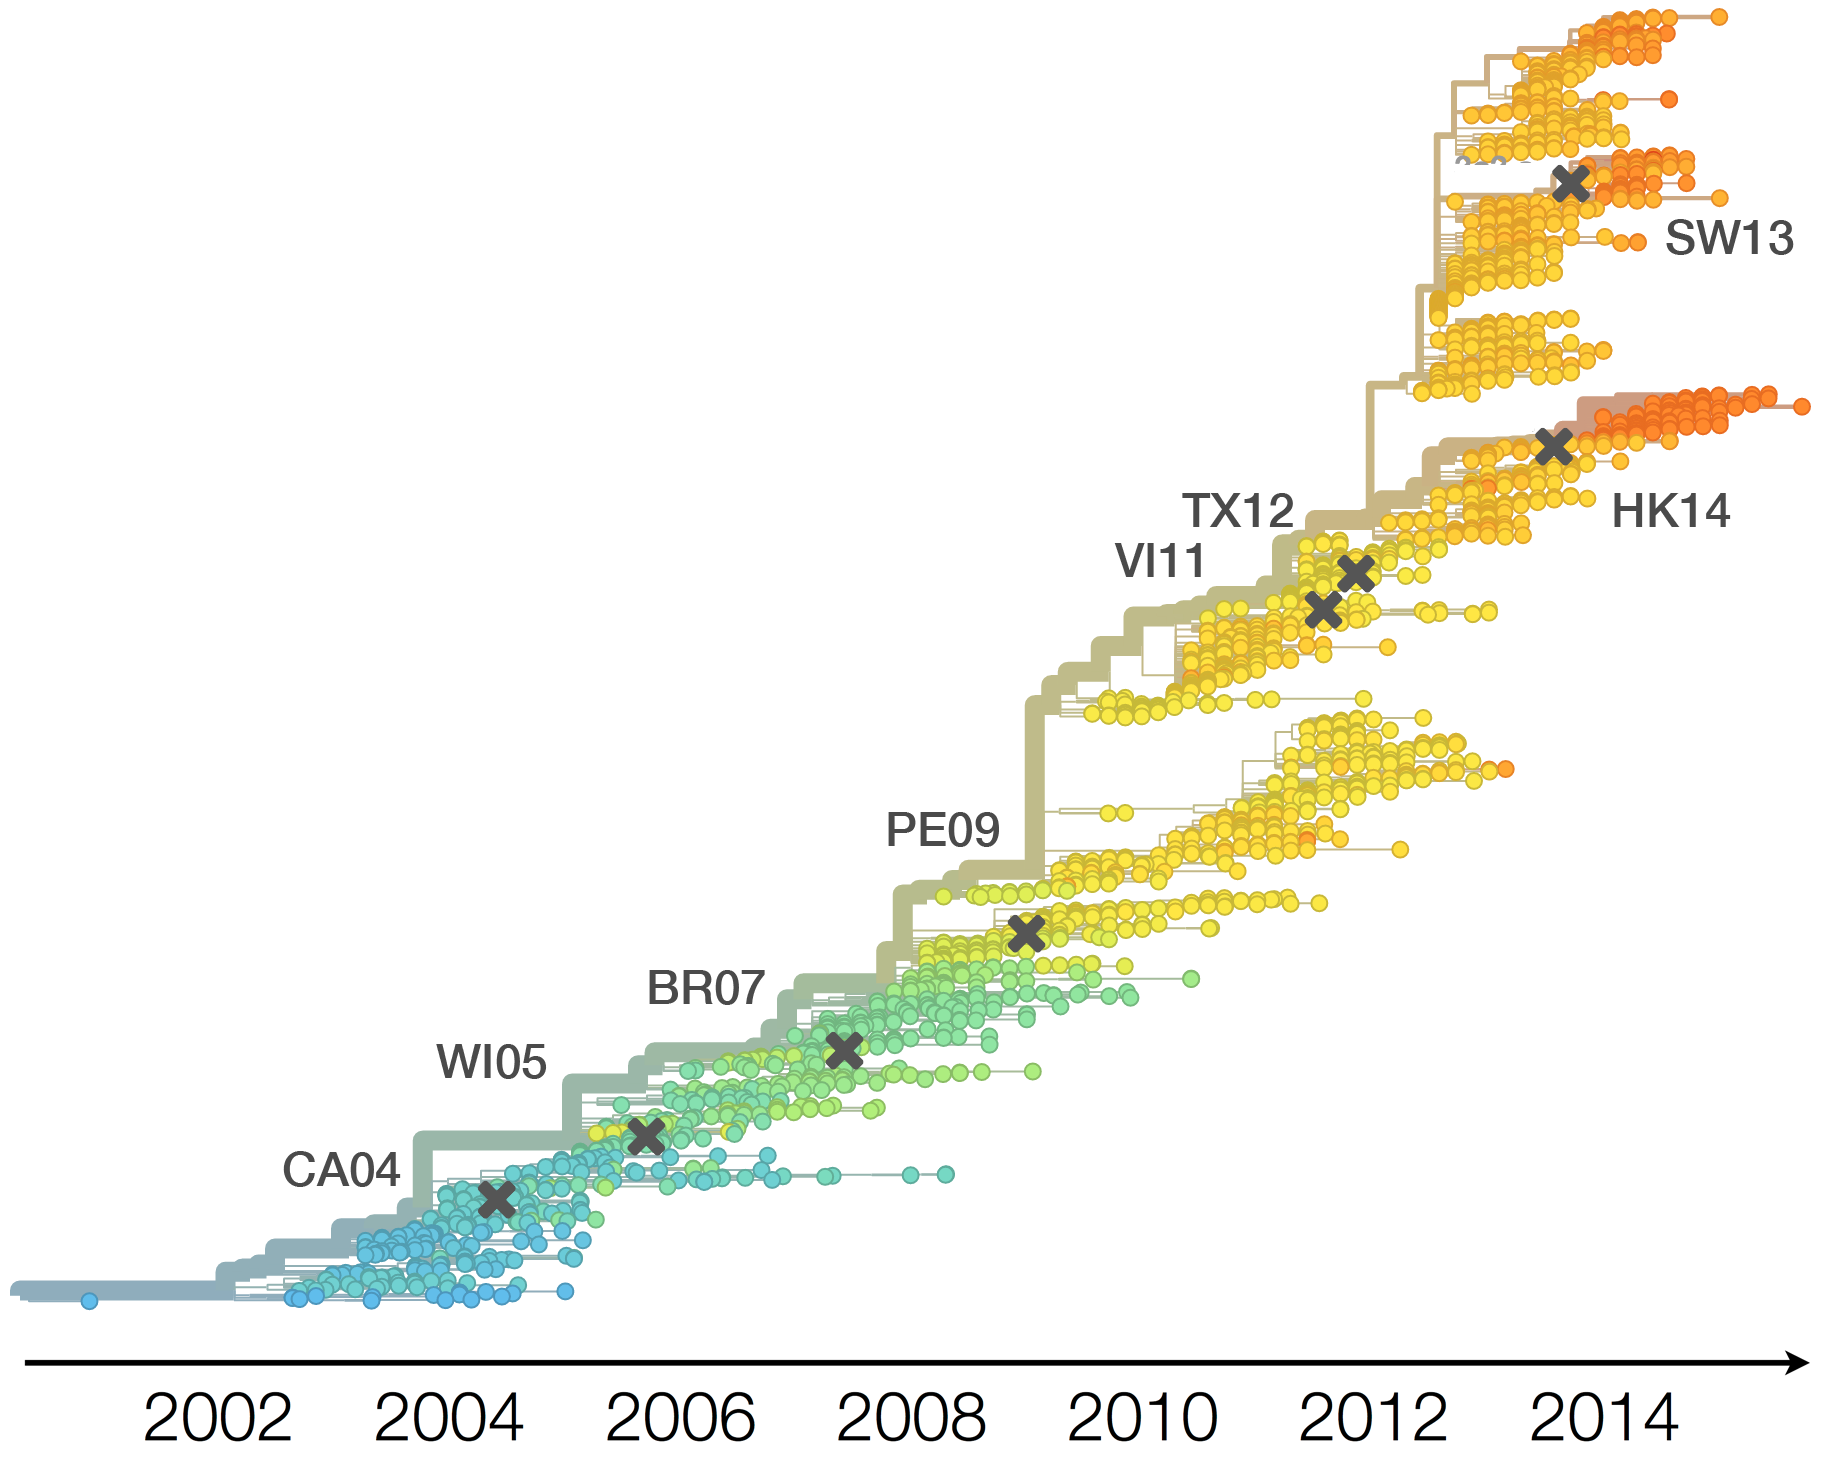
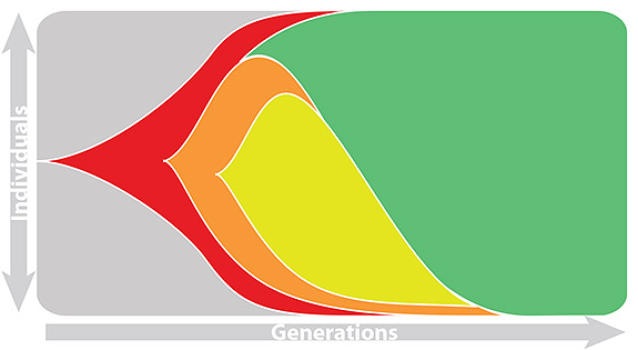
Drift variants rapidly take over the virus population
Timely surveillance and rapid analysis essential to understand ongoing influenza evolution
nextflu
Project to provide a real-time view of the evolving influenza population
All in collaboration with Richard Neher

nextflu pipeline
- Download all recent HA sequences from GISAID
- Filter to remove outliers
- Subsample across time and space
- Align sequences
- Build tree
- Estimate frequencies
- Export for visualization
Up-to-date analysis publicly available at:
nextflu.org
Antigenic evolution
Influenza hemagglutination inhibition (HI) assay
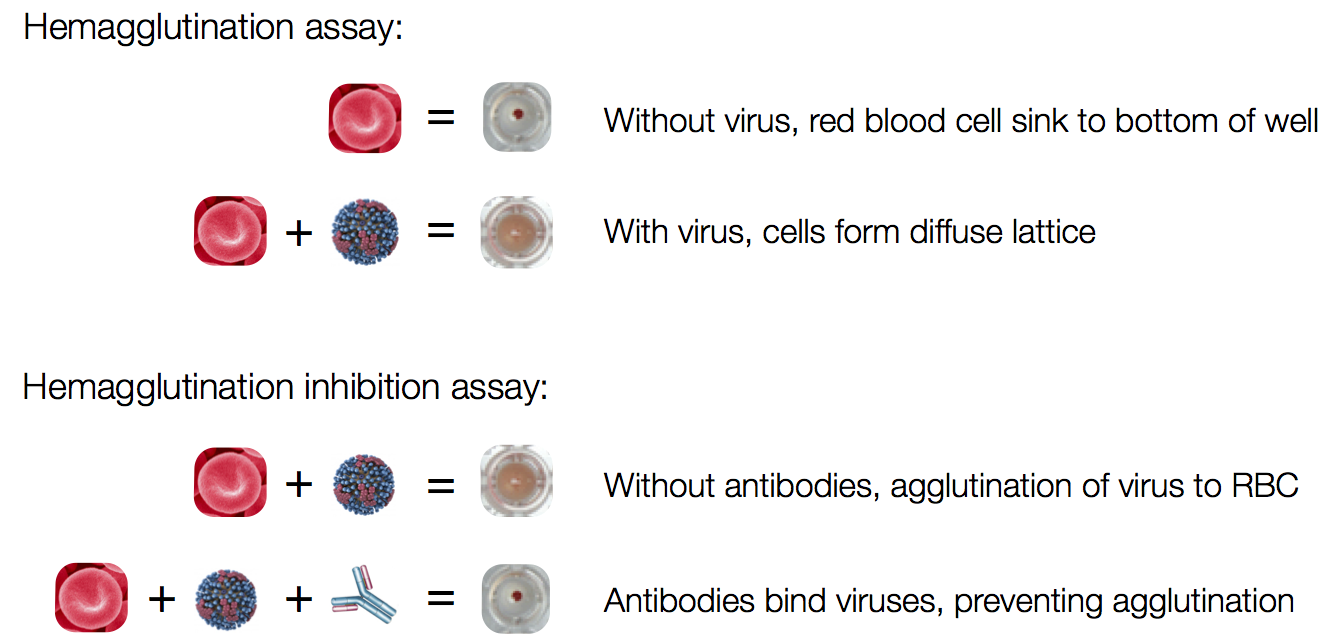
HI measures cross-reactivity across viruses
Data in the form of table of maximum inhibitory titers
Fit HI titer drops to phylogeny branches
Model is highly predictive of missing titer values
Recent HI data from WHO CC London annual and interim reports
Up-to-date analysis at:
nextflu.org
Forecasting
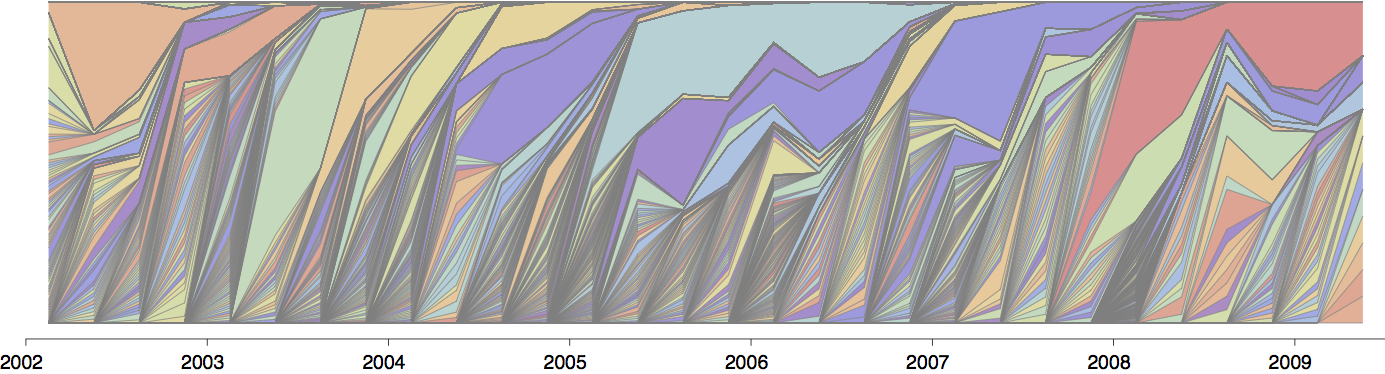
The future is here, it's just not evenly distributed yet
— William Gibson
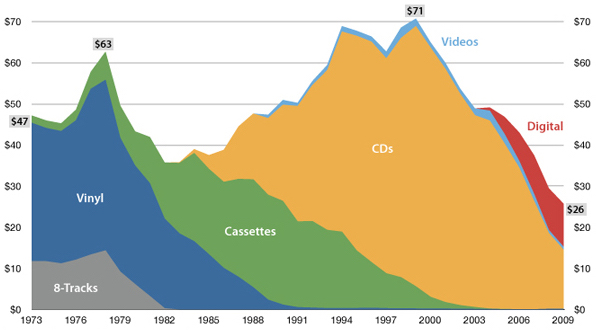
USA music industry, 2011 dollars per capita
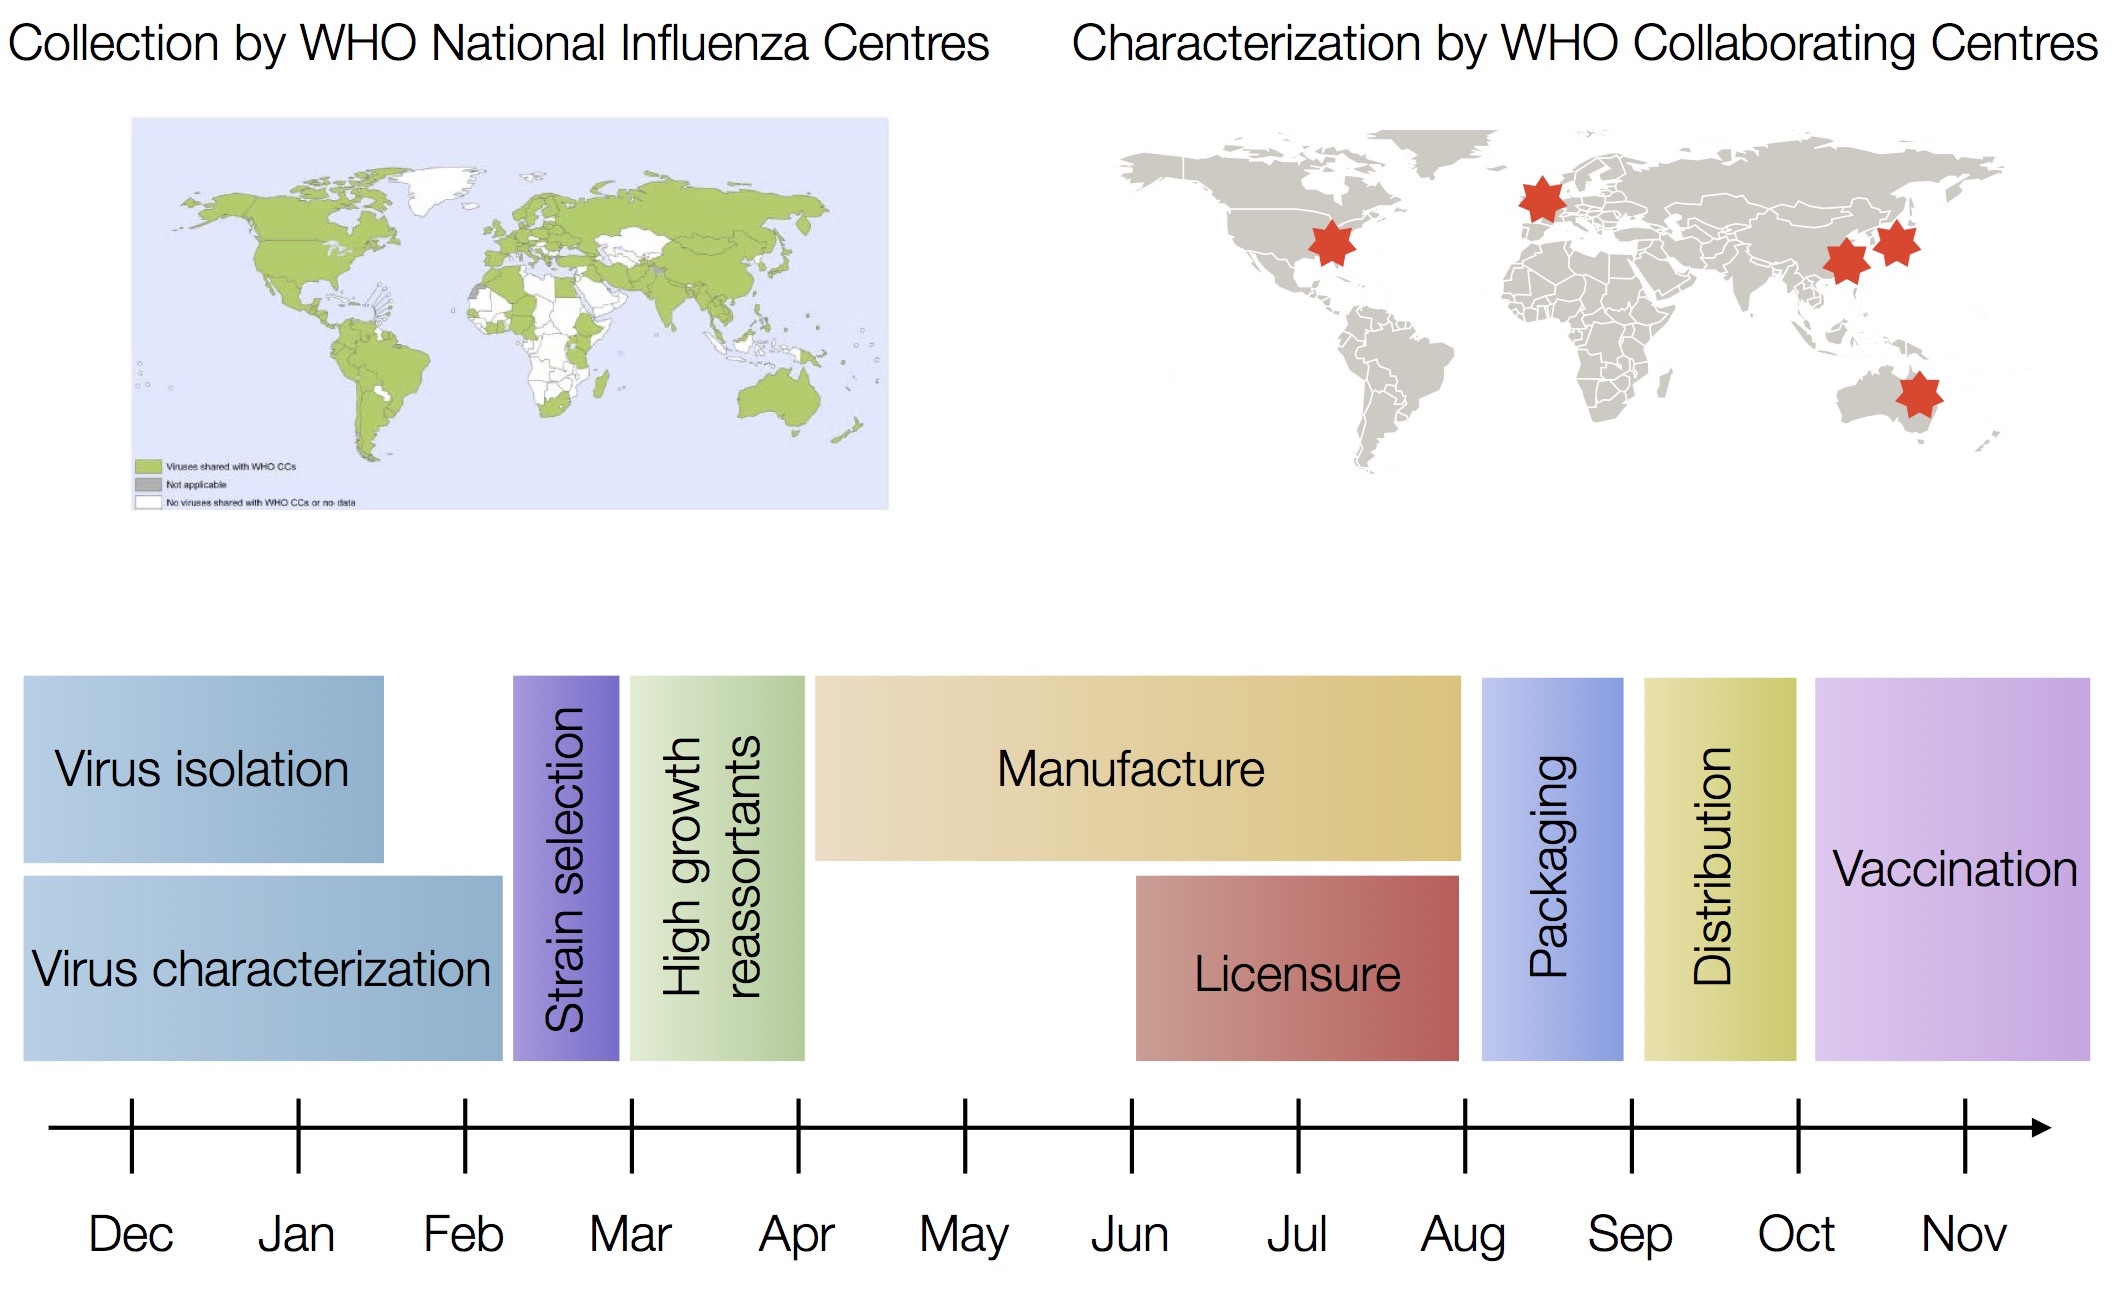
Influenza population turnover
Vaccine strain selection timeline
Seek to explain change in clade frequencies over 1 year
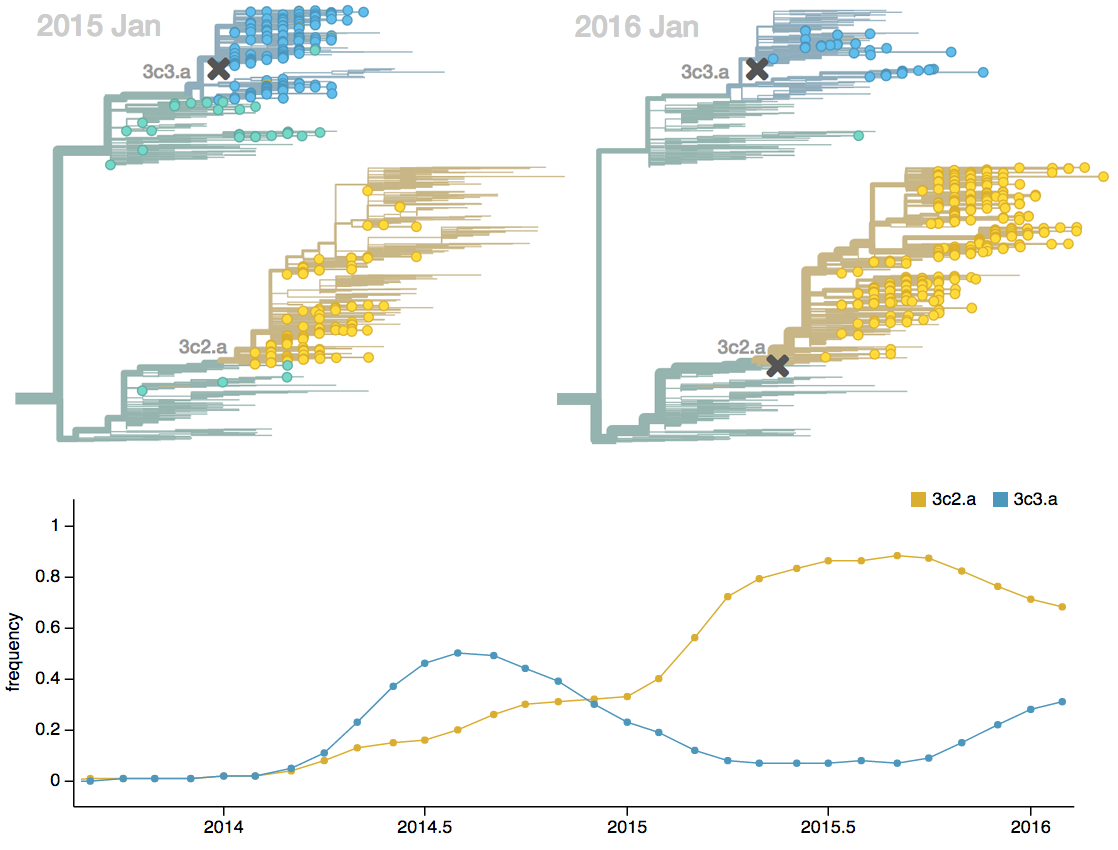
Fitness models can project clade frequencies
Clade frequencies $X$ derive from the fitnesses $f$ and frequencies $x$ of constituent viruses, such that
$$\hat{X}_v(t+\Delta t) = \sum_{i:v} x_i(t) \, \mathrm{exp}(f_i \, \Delta t)$$
This captures clonal interference between competing lineages
Predictive fitness models
A simple predictive model estimates the fitness $f$ of virus $i$ as
$$\hat{f}_i = \beta^\mathrm{ep} \, f_i^\mathrm{ep} + \beta^\mathrm{ne} \, f_i^\mathrm{ne}$$
where $f_i^\mathrm{ep}$ measures cross-immunity via substitutions at epitope sites and $f_i^\mathrm{ep}$ measures mutational load via substitutions at non-epitope sites
We implement a similar model based on two predictors
- Clade frequency change
- Antigenic advancement
Project frequencies forward,
growing clades have high fitness
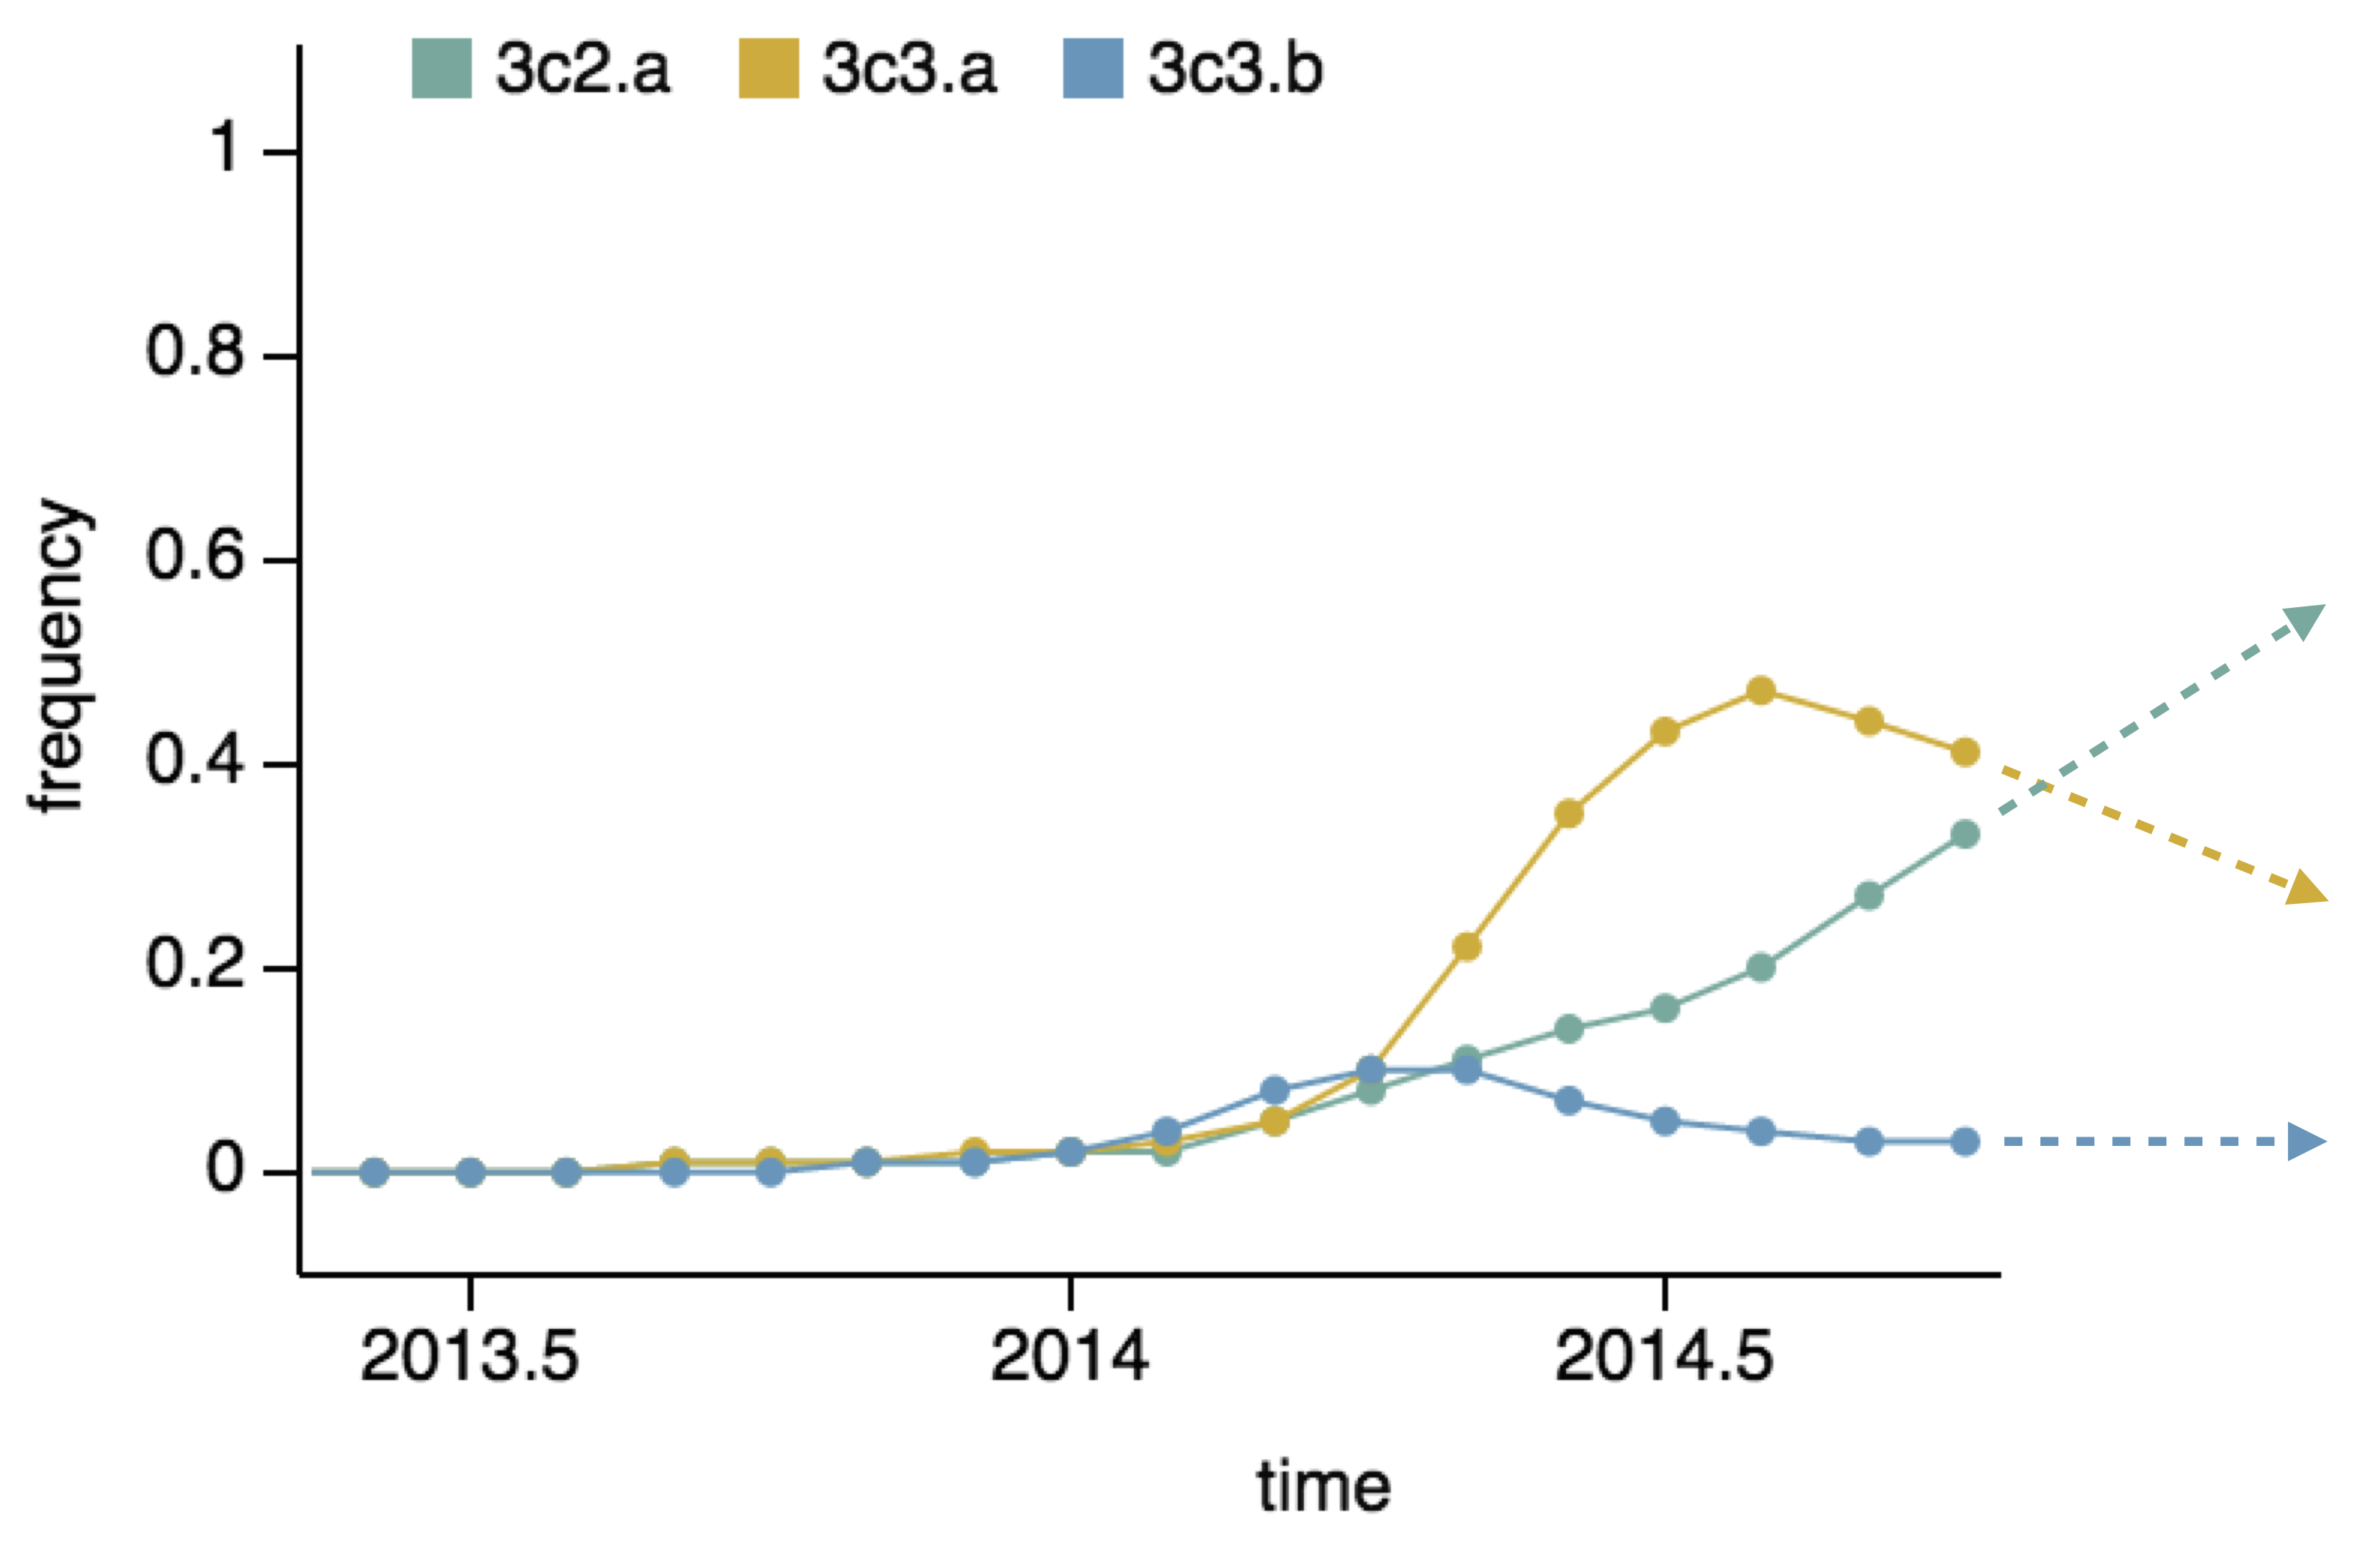
Calculate HI drop from ancestor,
drifted clades have high fitness
Fitness model parameterization
Our predictive model estimates the fitness $f$ of virus $i$ as
$$\hat{f}_i = \beta^\mathrm{freq} \, f_i^\mathrm{freq} + \beta^\mathrm{HI} \, f_i^\mathrm{HI}$$
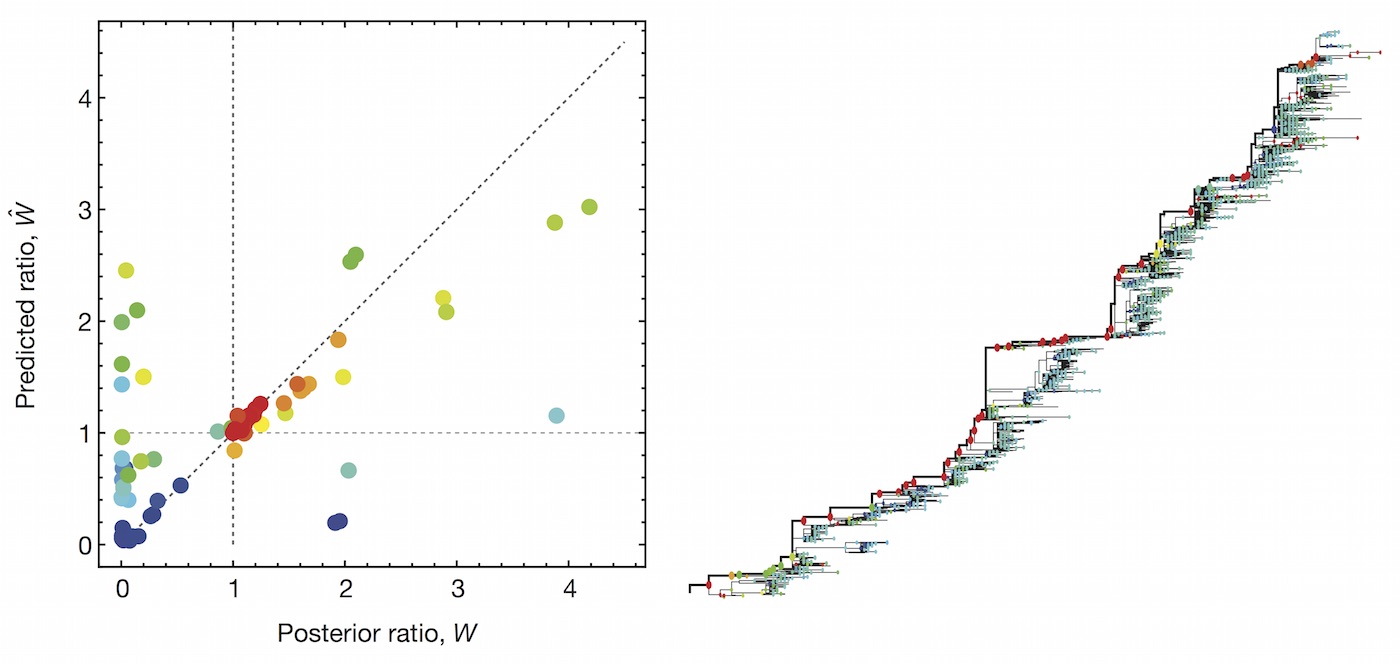
We learn coefficients and validate model based on previous 15 H3N2 seasons
Clade growth rate is well correlated (ρ = 0.66)
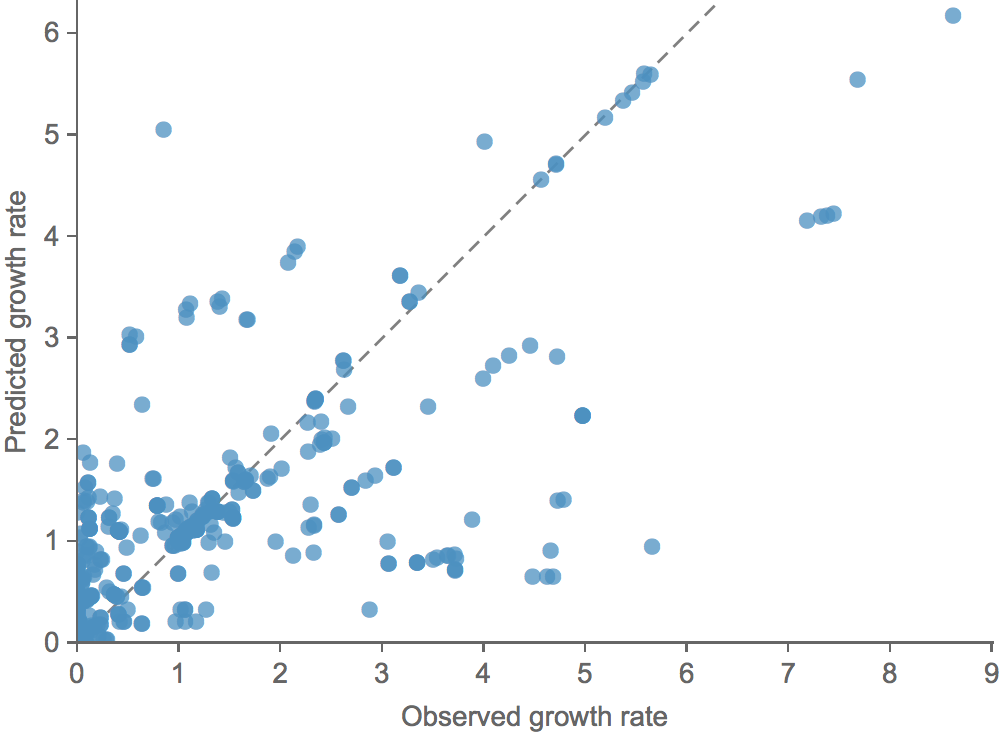
Growth vs decline correct in 84% of cases
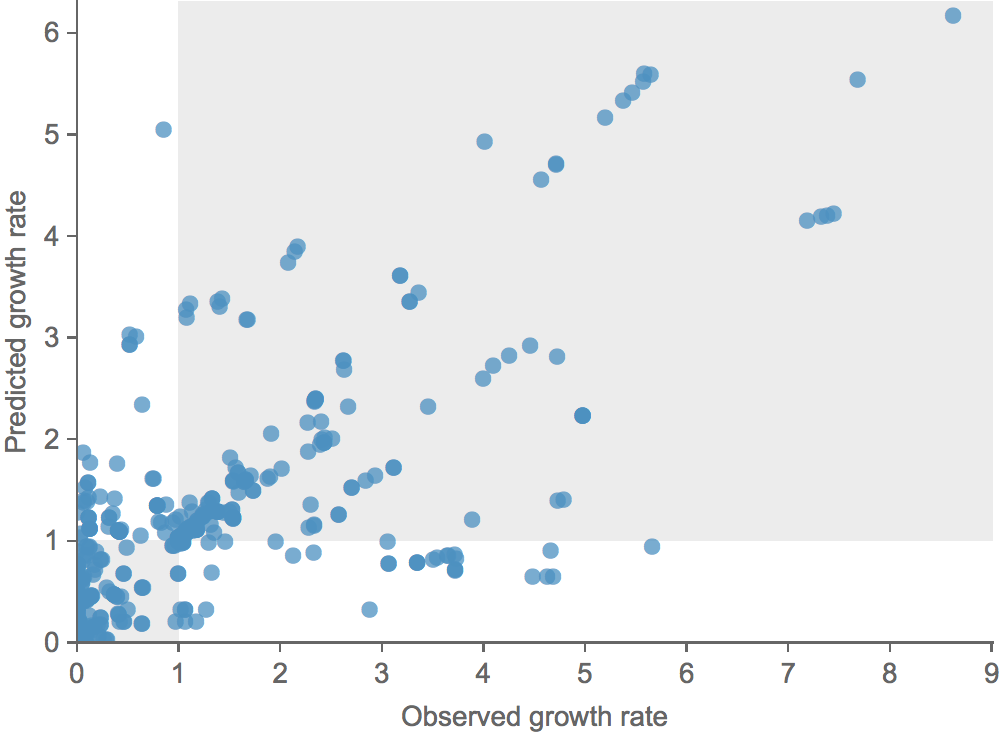
Trajectories show more detailed congruence
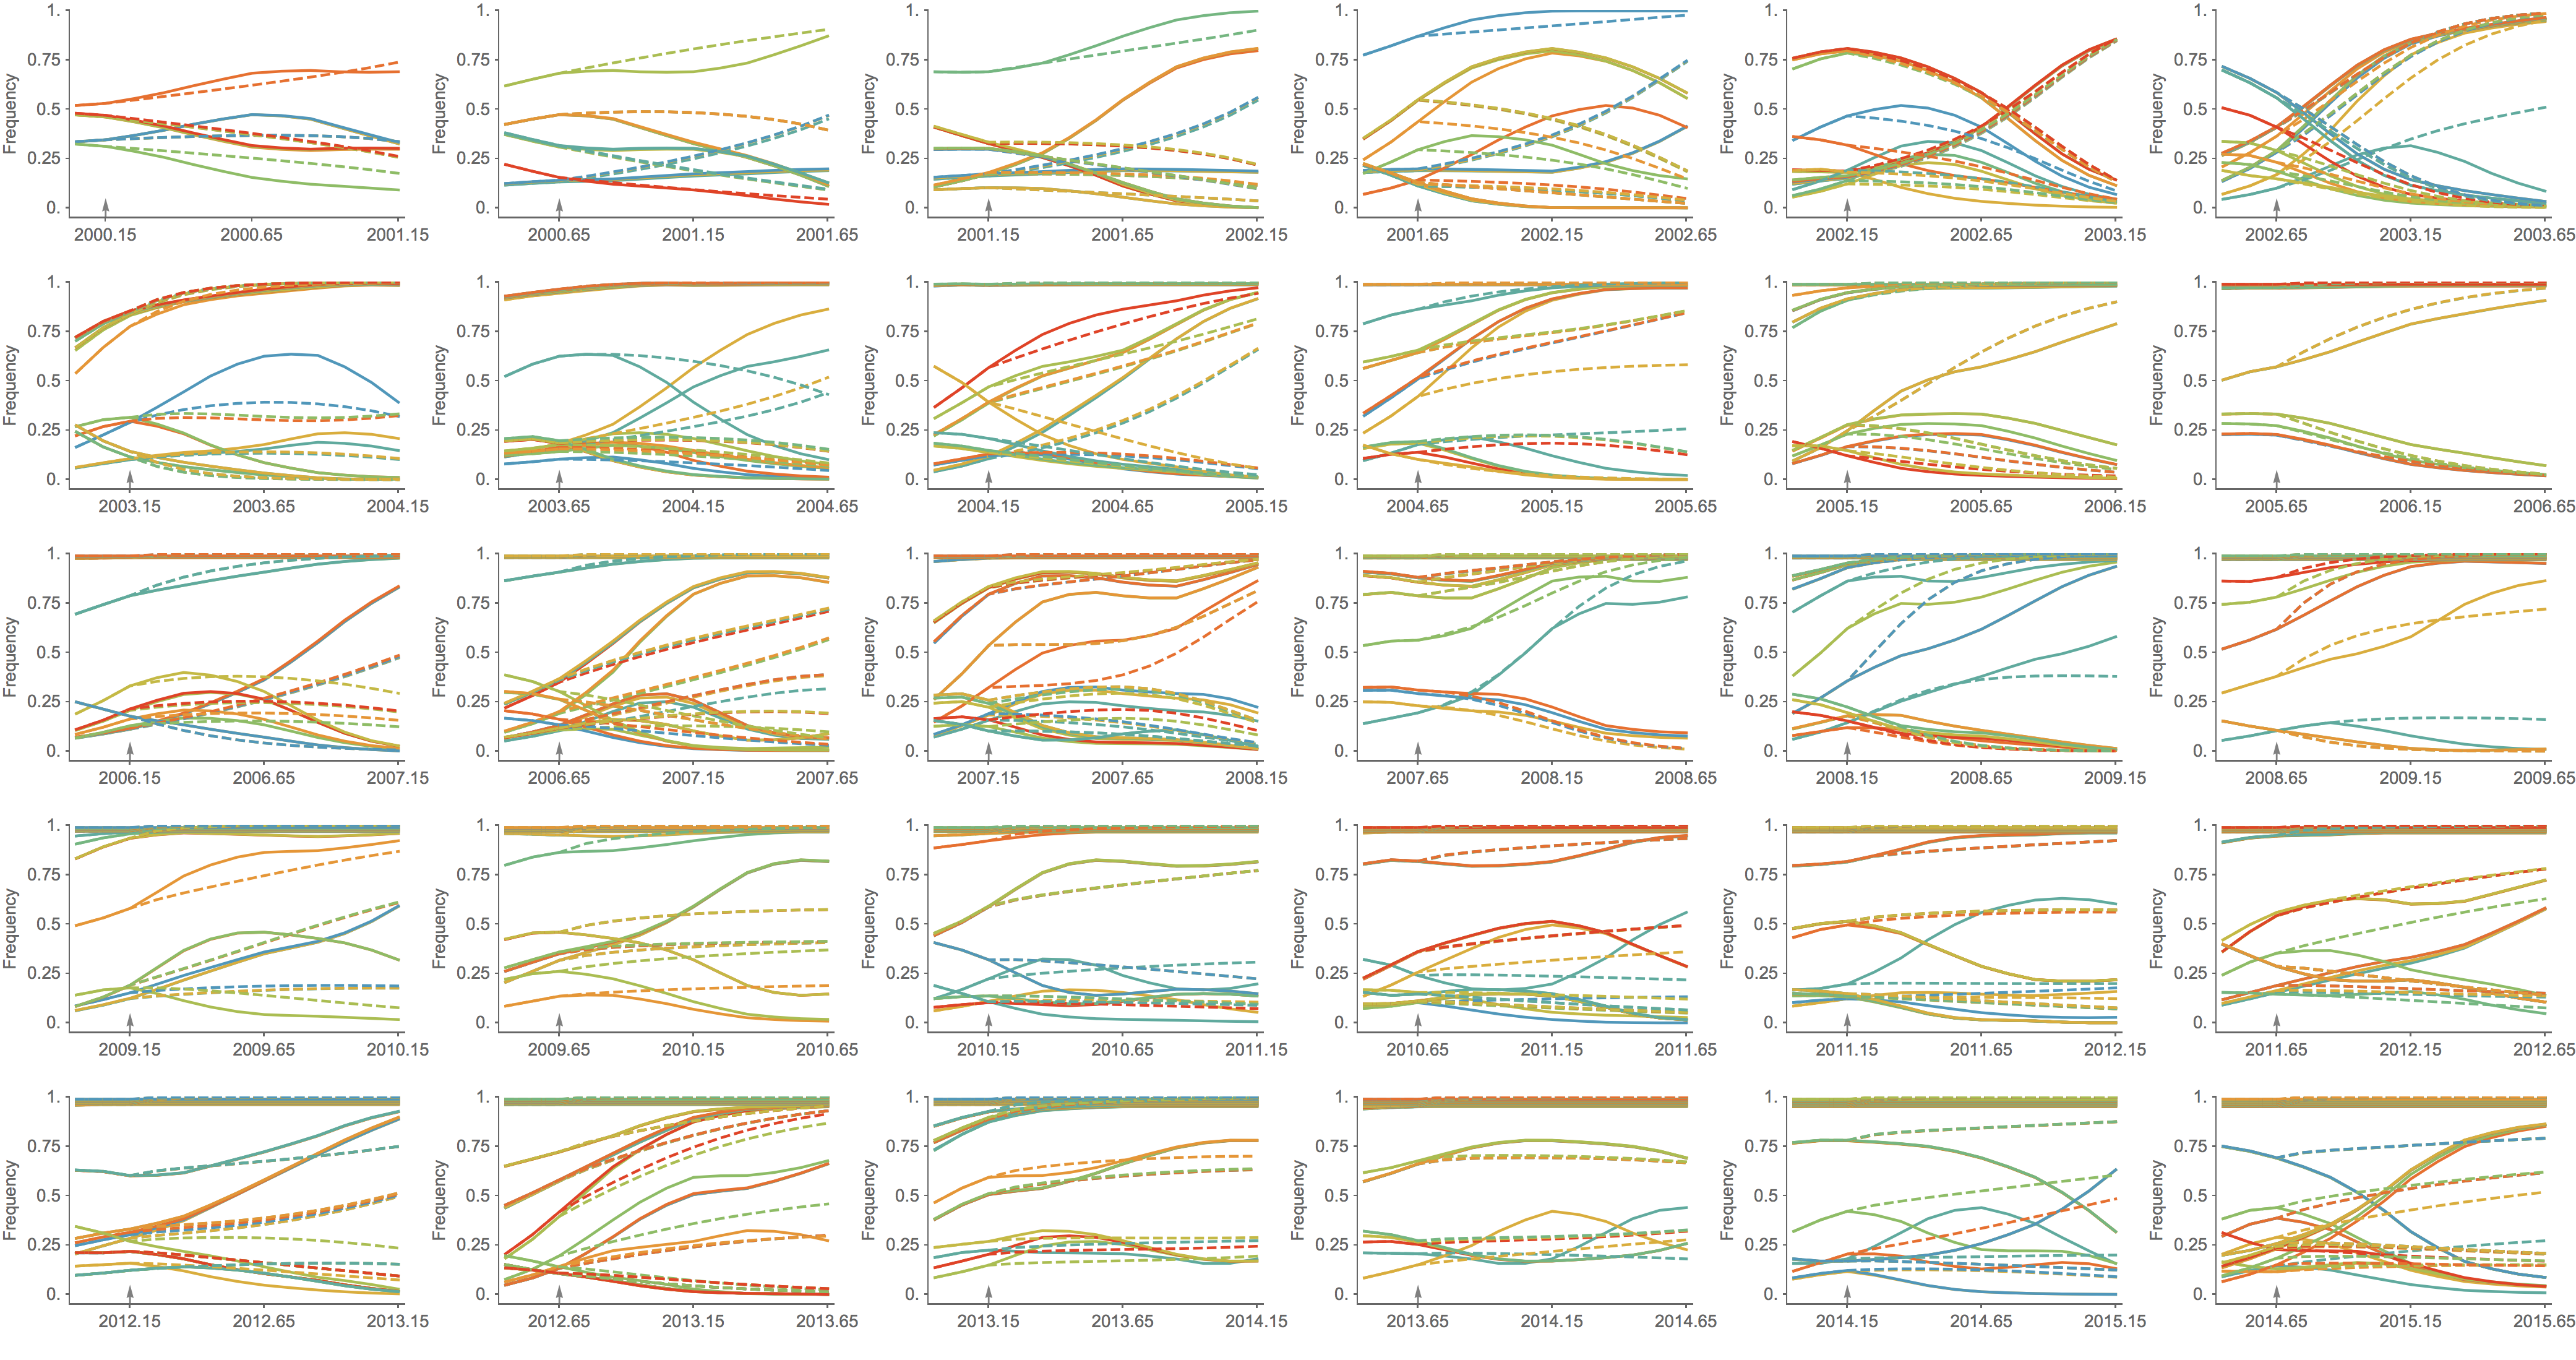
Formalizes intuition about drivers of influenza dynamics
| Model | Ep coefficient | HI coefficient | Freq error | Growth corr |
|---|---|---|---|---|
| Epitope only | 2.36 | -- | 0.10 | 0.57 |
| HI only | -- | 2.05 | 0.08 | 0.63 |
| Epitope + HI | -0.11 | 2.15 | 0.08 | 0.67 |
Further work on predictive modeling
- Integrate data predictors and data sources, e.g. geography
- Possible to build predictive models for H1N1 and B and to forecast NA evolution
Phylogeny of H3 with geographic history
Geographic location of phylogeny trunk
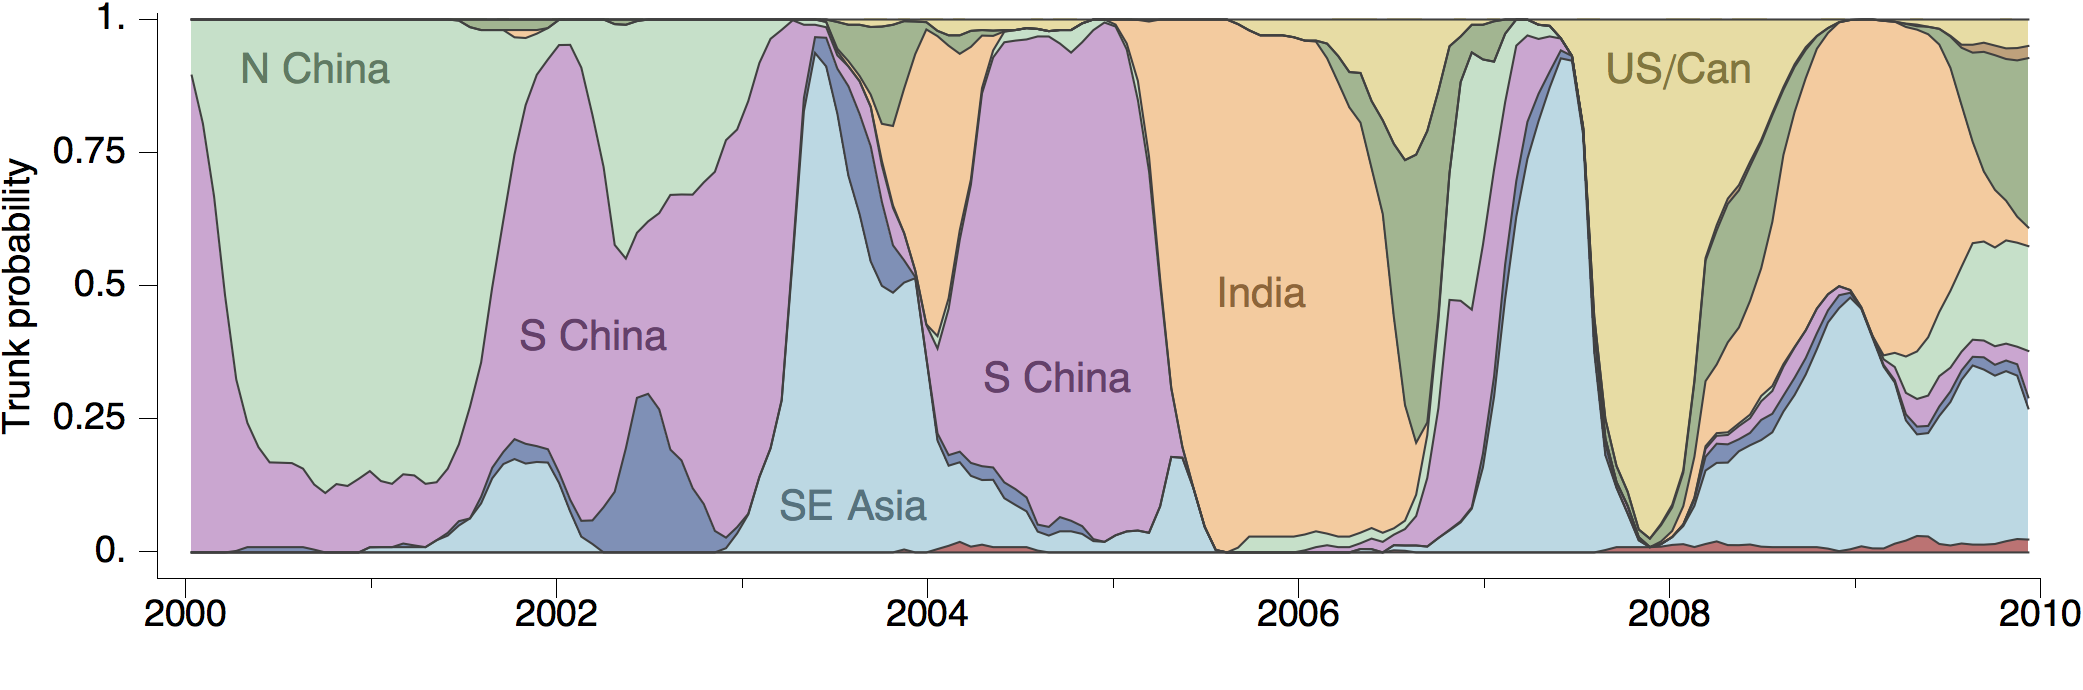
Real-time analyses are actionable and thus, may inform influenza vaccine strain selection
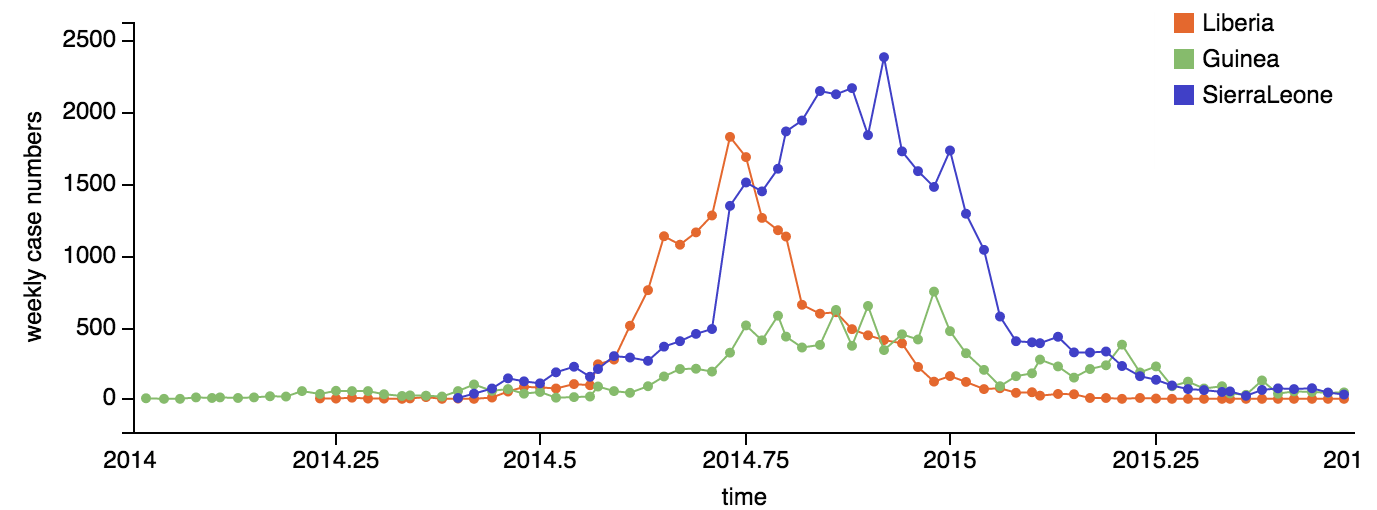
Outbreak analysis
Ebola
Epidemic nearly contained, but resulted in >28,000 confirmed cases and >11,000 deaths
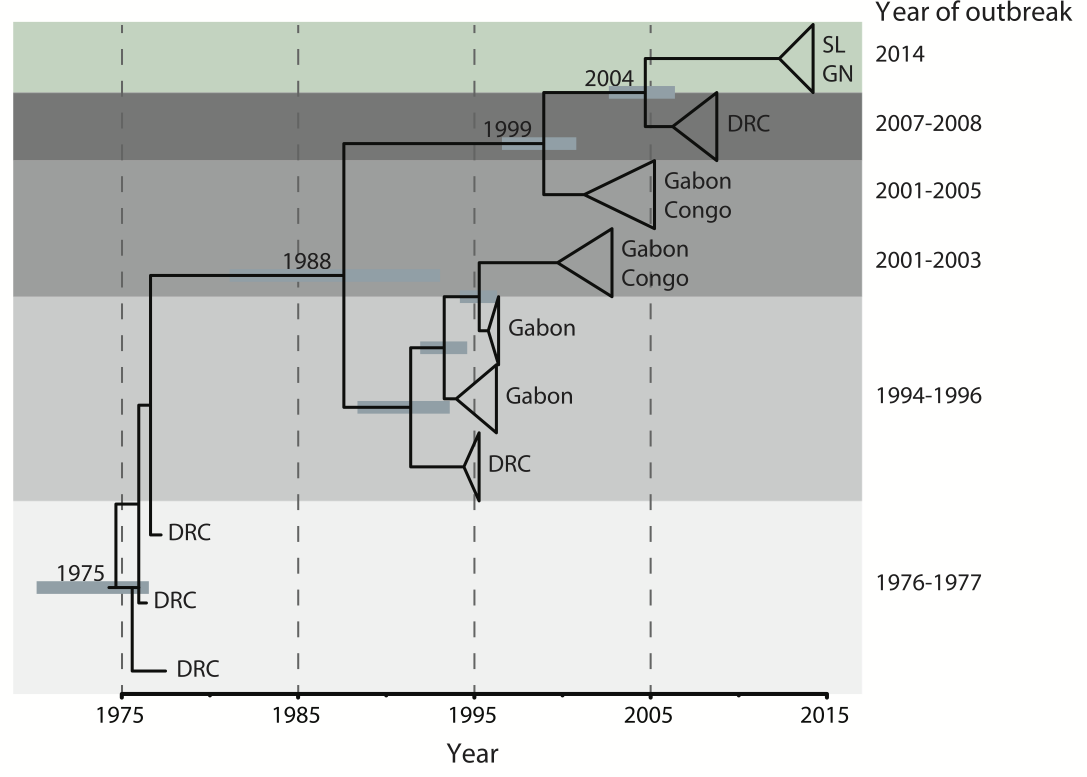
Outbreaks are independent spillovers from the animal reservoir
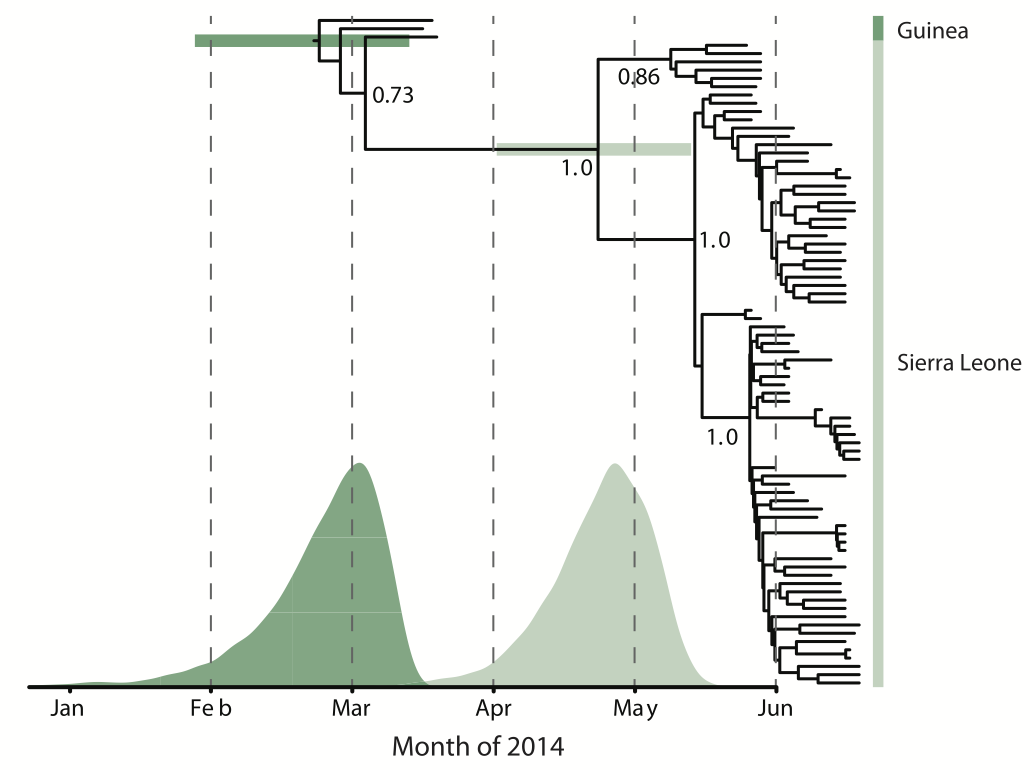
Person-to-person spread in the early West African outbreak
Continued spread through Dec 2014
At epidemic height, geographic spread of particular interest
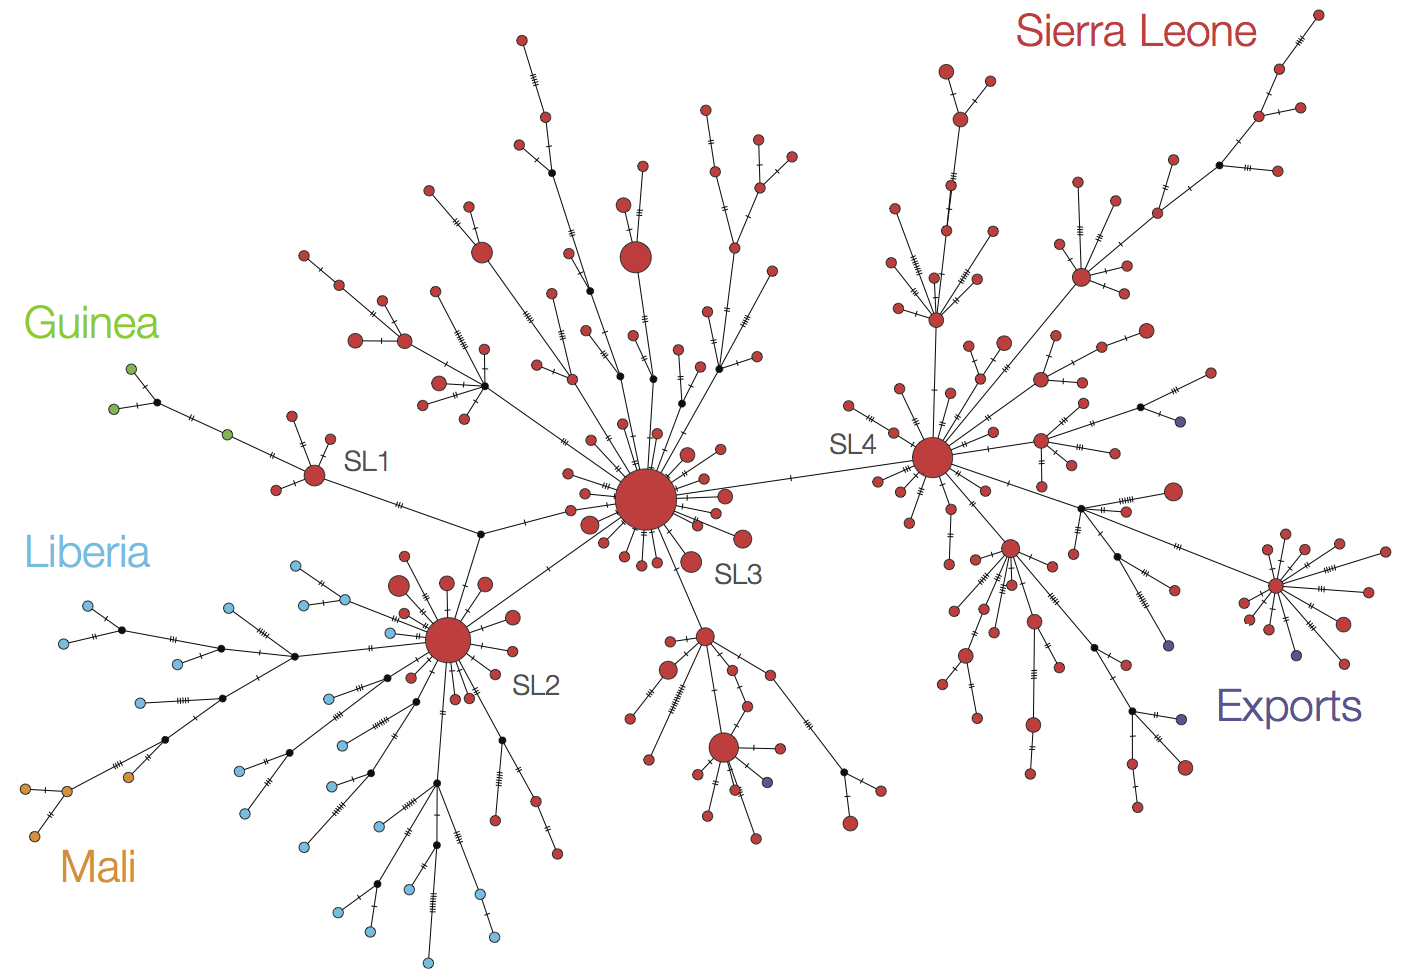
Later on, tracking transmission clusters of primary importance
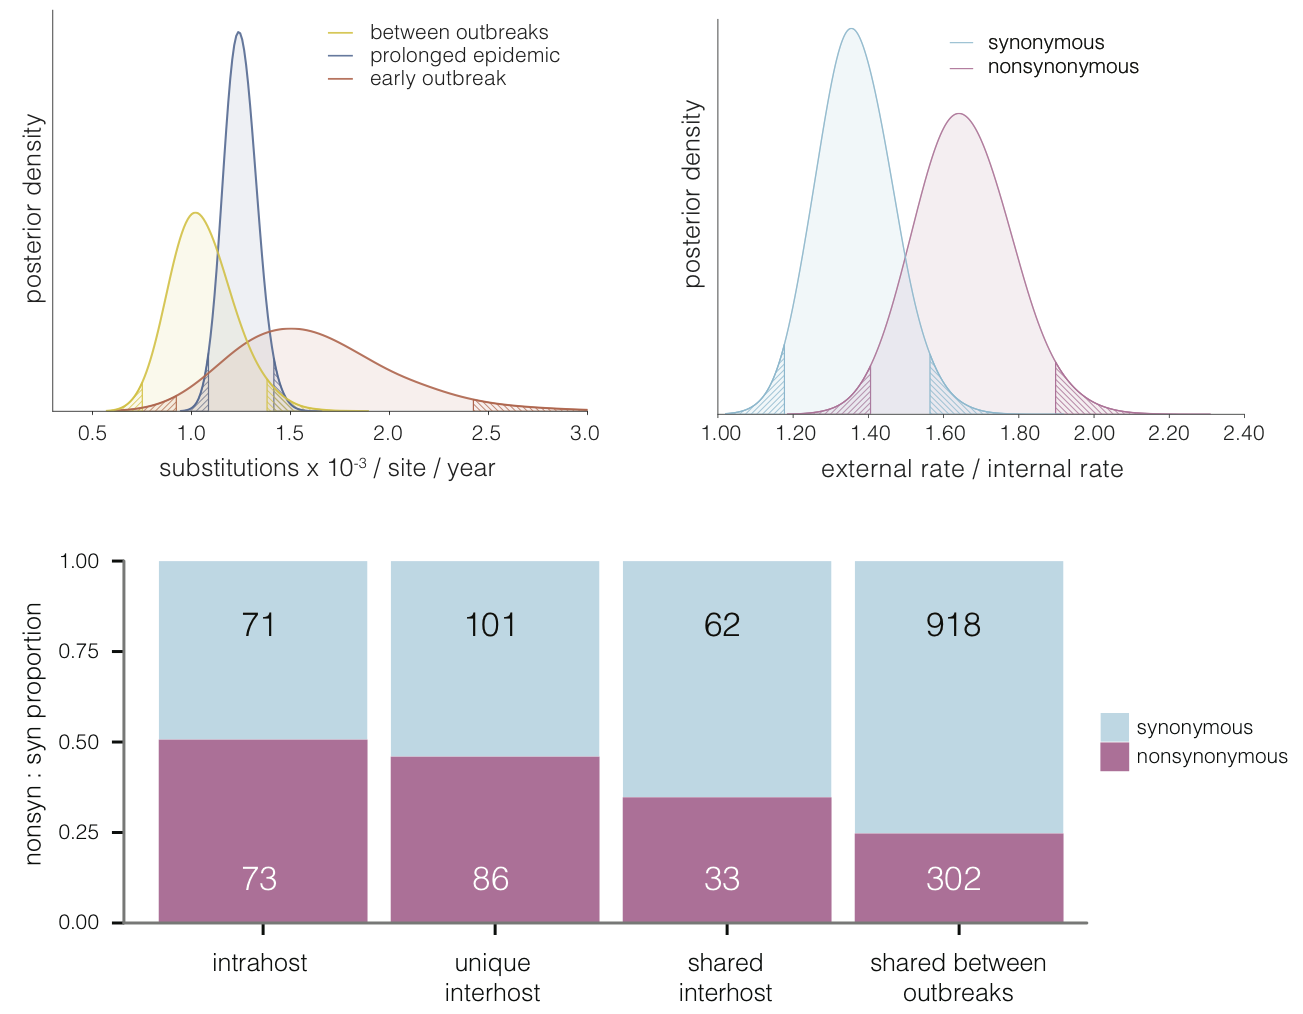
Evolutionary analyses helped to establish the degree of adaptive evolution occurring
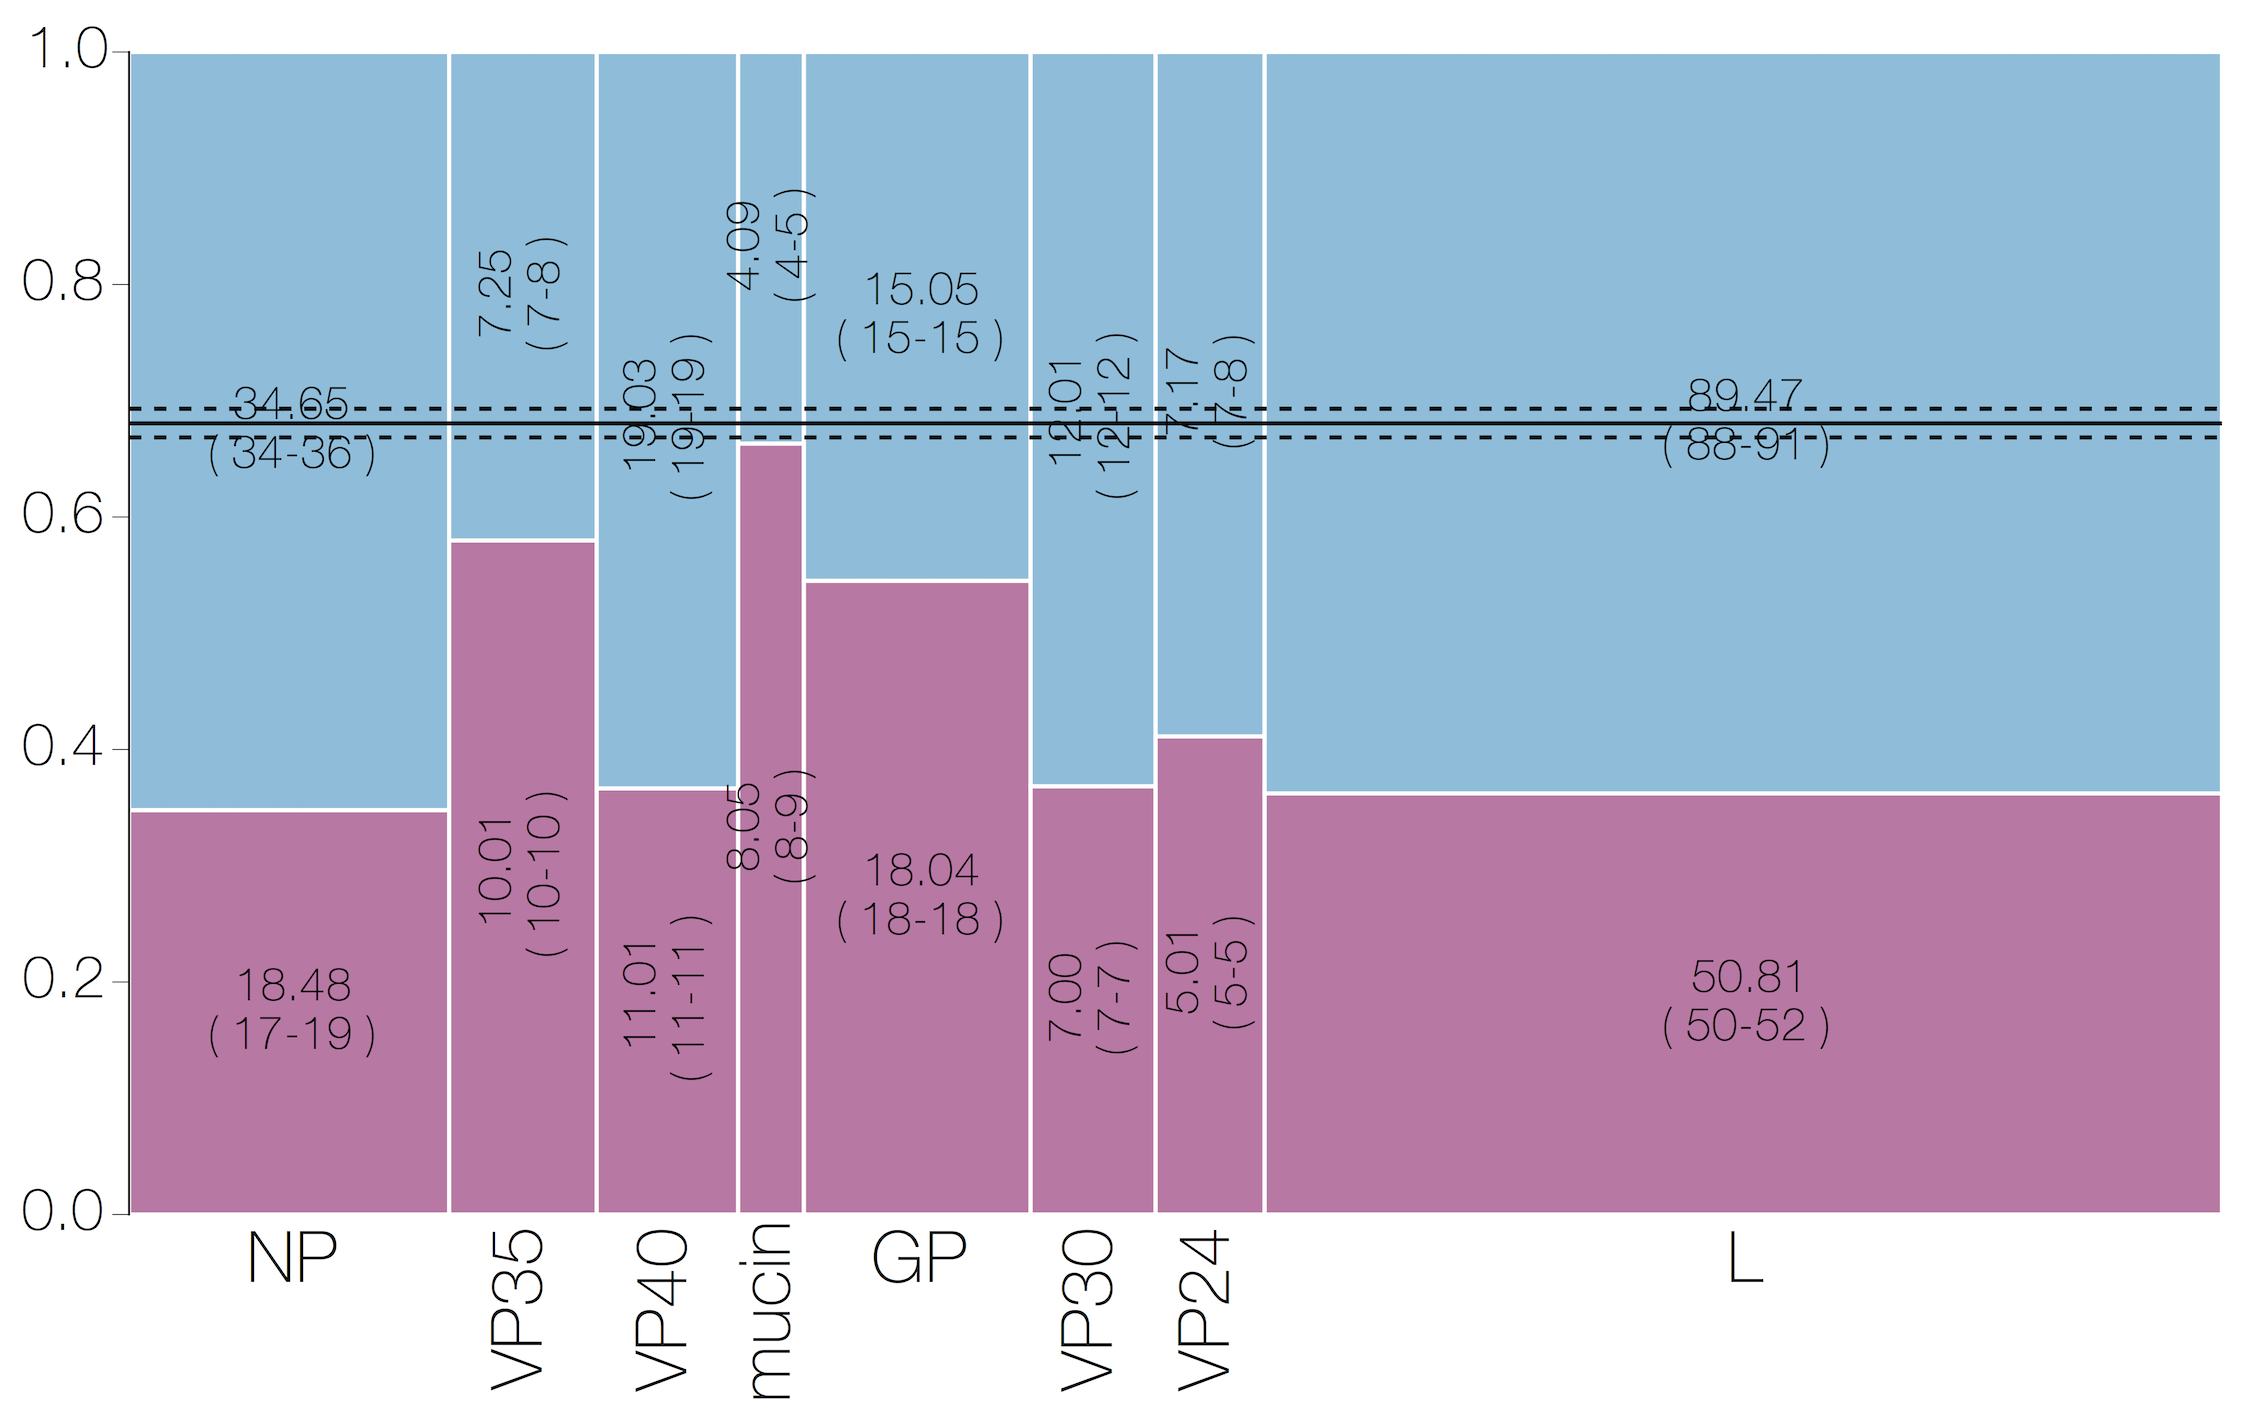
Selective patterns differ across genome
Phylogeographic analyses reveal detailed patterns of spatial movement
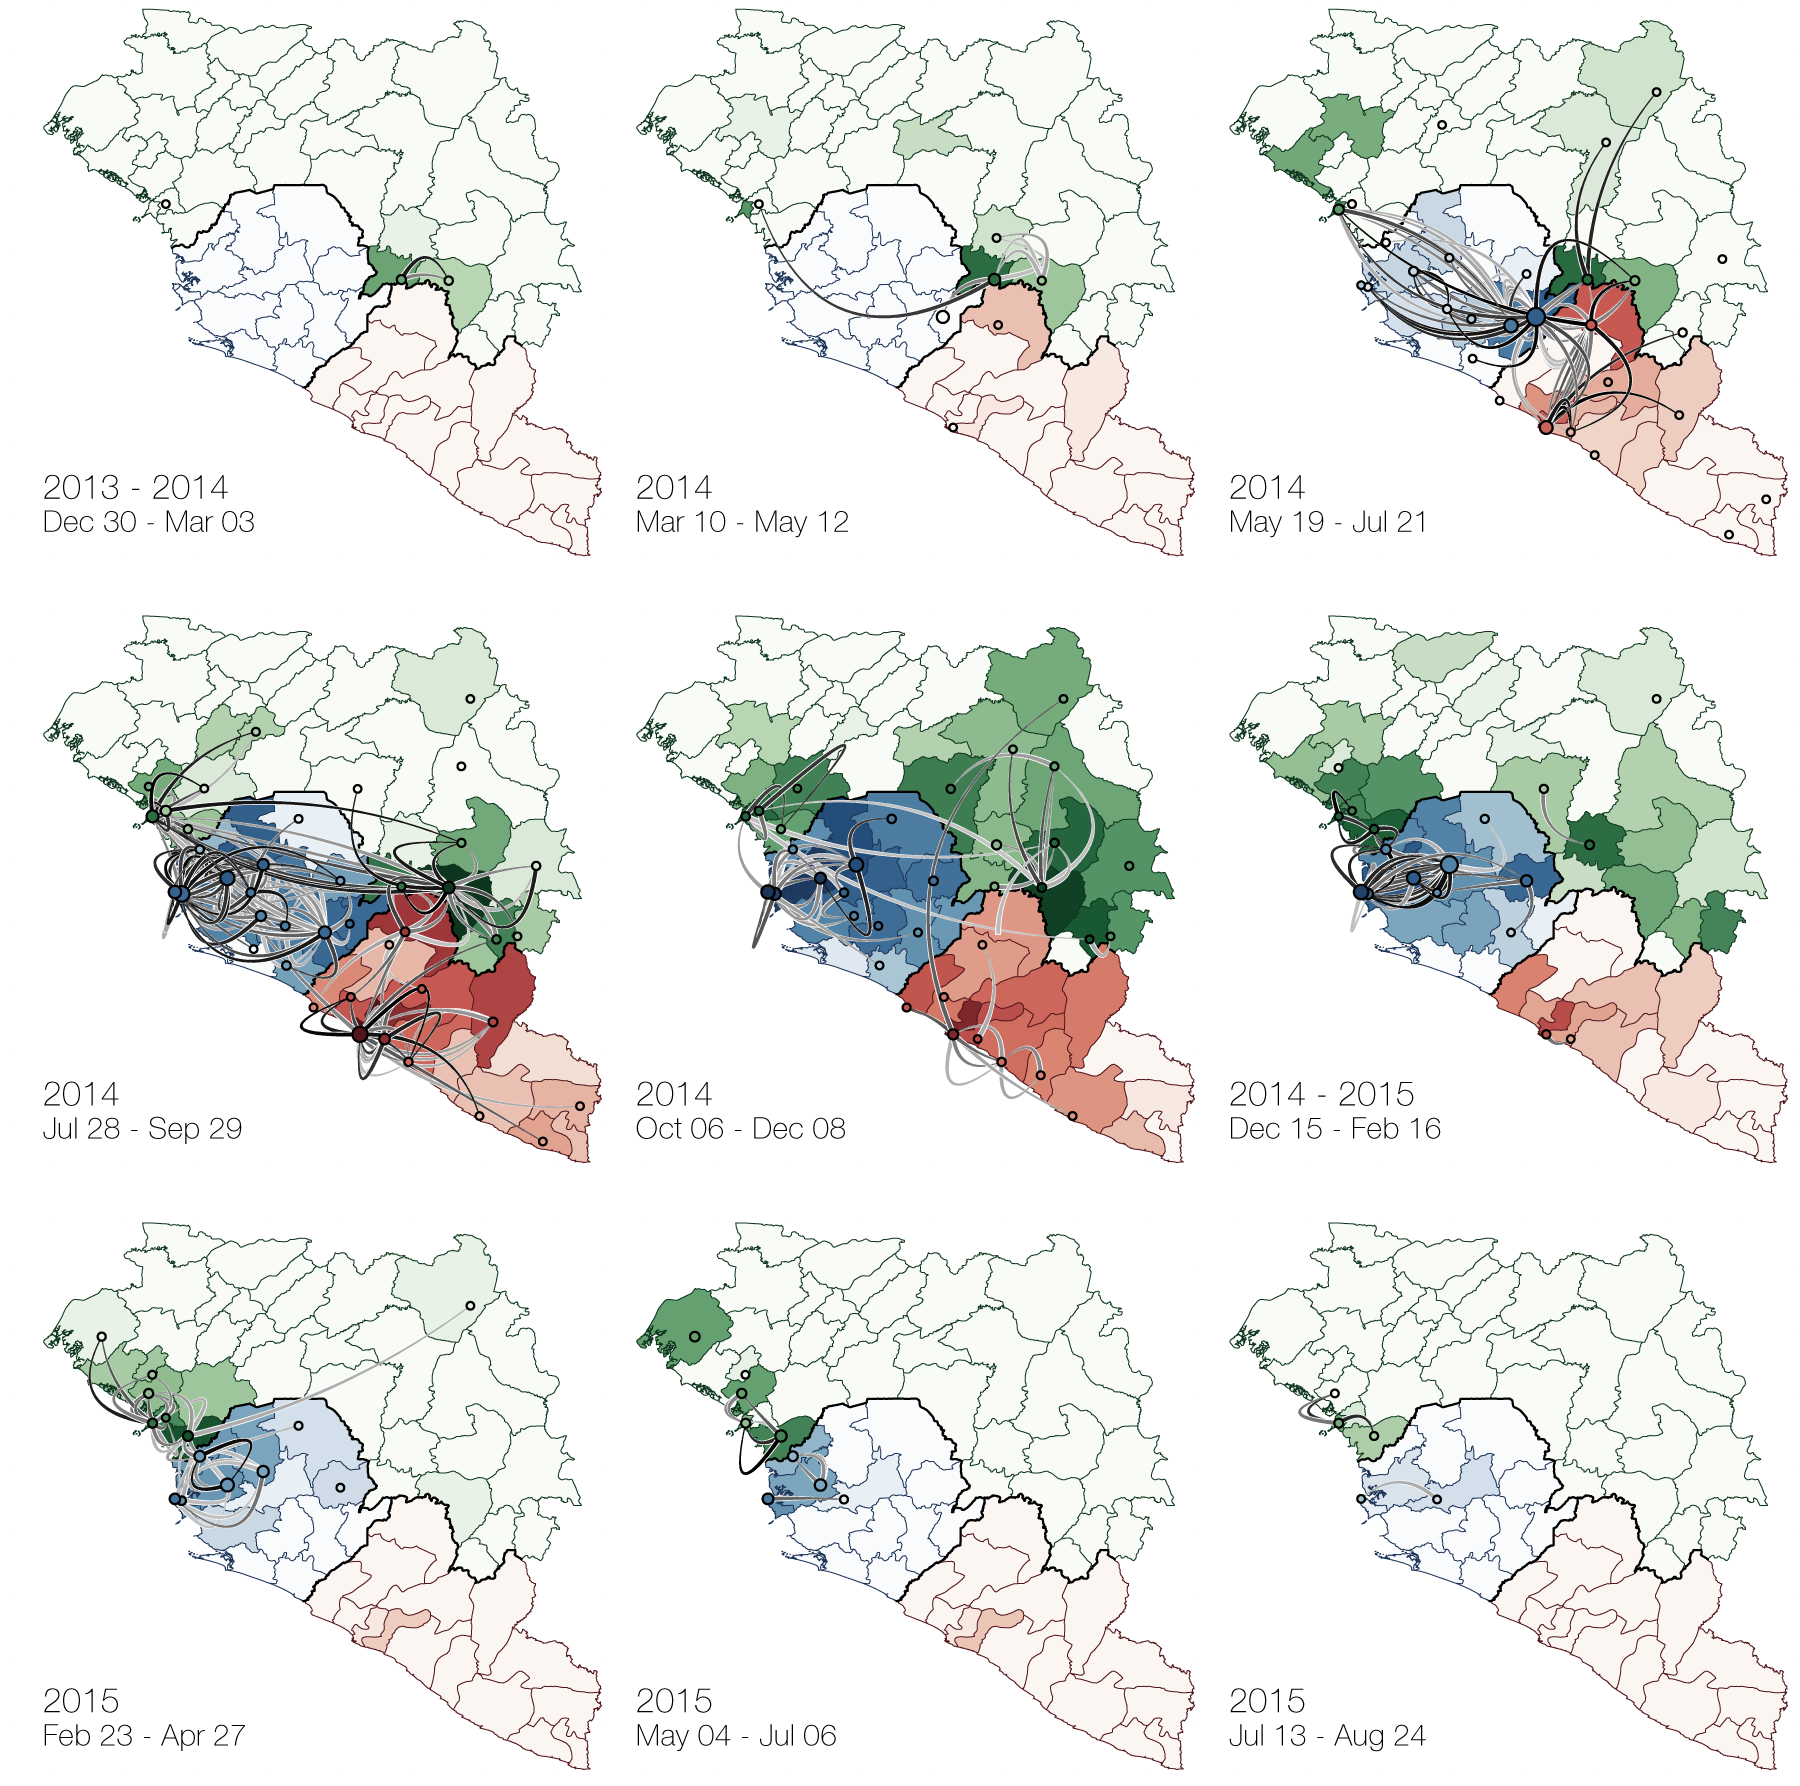
Animation by Gytis Dudas
Important analyses, let's make them more rapid and more automated
Tracking epidemic spread in real-time:
ebola.nextstrain.org
Zika
Virus endemic to Africa, emergence in Southeast Asia in the last century
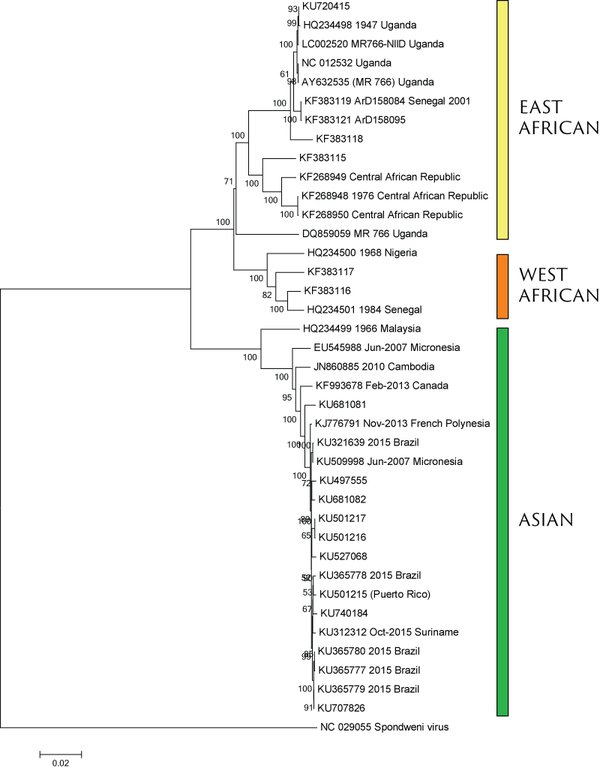
Spread eastward through the South Pacific
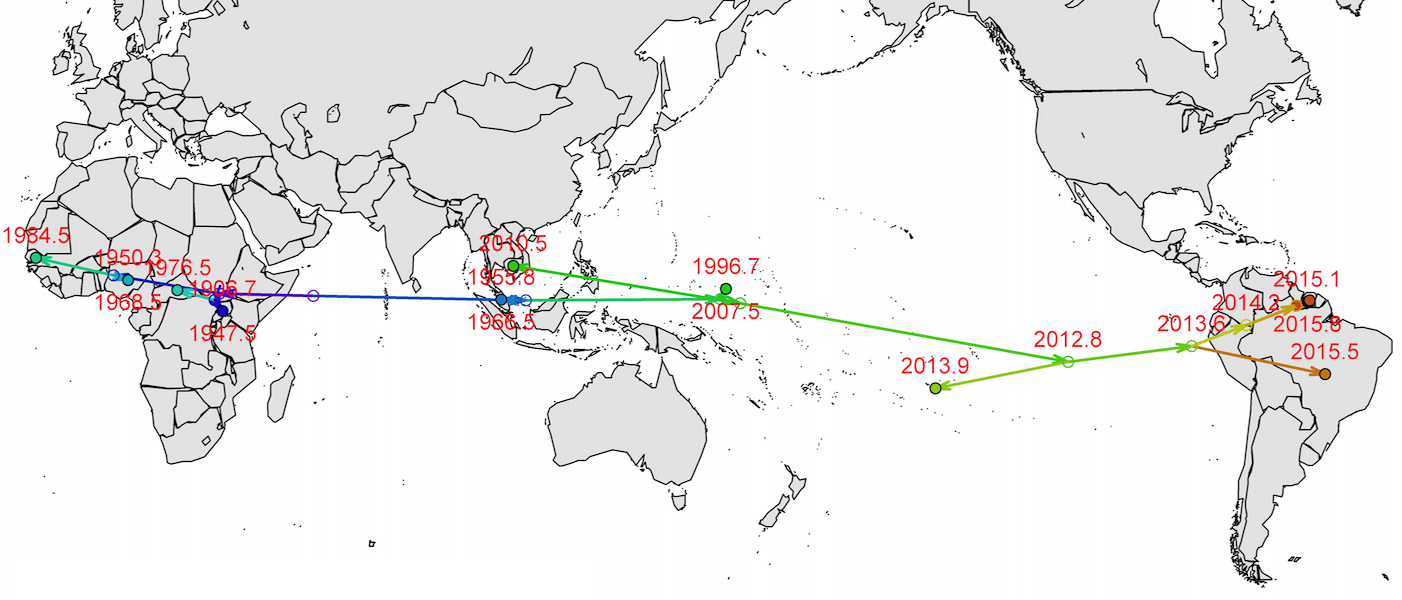
Isolated epidemics in the South Pacific

Single arrival into the Americas in early 2014
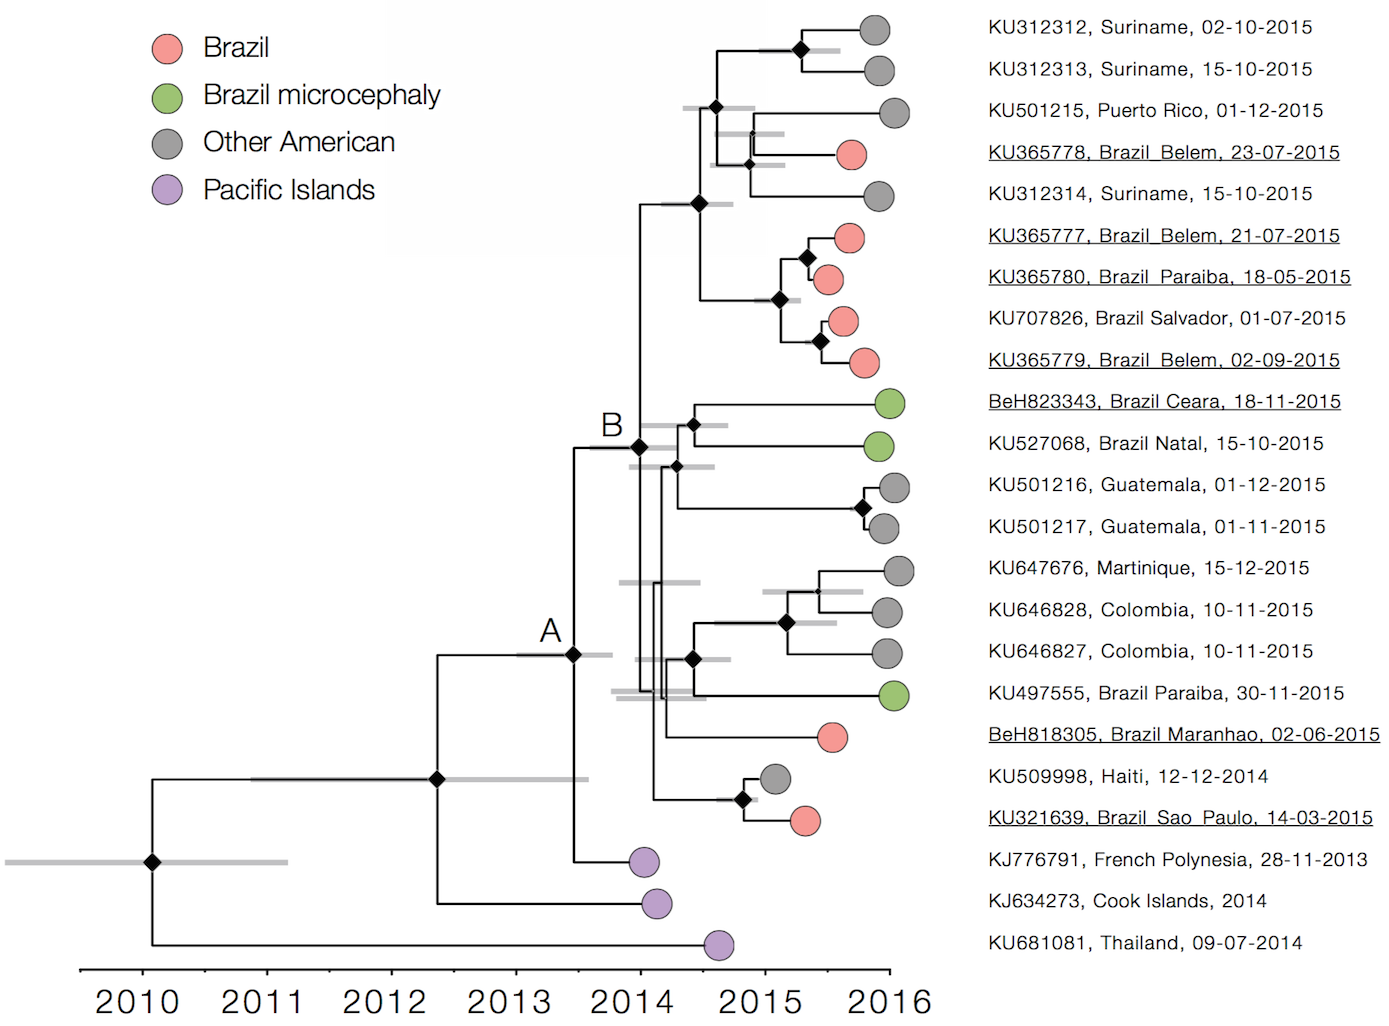
Working on analysis of ongoing evolution:
nextstrain.org/zika/
Moving forward, genetically-informed outbreak response requires:
- Rapid sharing of sequence data, genetic context critical
- Technologies to rapidly conduct phylogenetic inference
- Technologies to explore genetic relationships and inform epidemiological investigation
Future work

Acknowledgements
Influenza: WHO Global Influenza Surveillance Network, GISAID, Worldwide Influenza Centre at the Francis Crick Institute, Richard Neher, Colin Russell, Andrew Rambaut
Ebola: data producers, Gytis Dudas, Andrew Rambaut, Philipe Lemey, Richard Neher, Nick Loman, Ian Goodfellow, Paul Kellam, Danny Park, Kristian Andersen, Pardis Sabeti
Zika: data producers, Nuno Faria, Andrew Rambaut, Richard Neher, Charlton Callender
Contact
- Website: bedford.io
- Twitter: @trvrb
- Slides: bedford.io/talks/real-time-tracking-scripps/