Data integration, real-time pipelines and visualization strategies
Trevor Bedford (@trvrb)
4 Oct 2017
ARTIC Network Meeting
University of Edinburgh
This talk
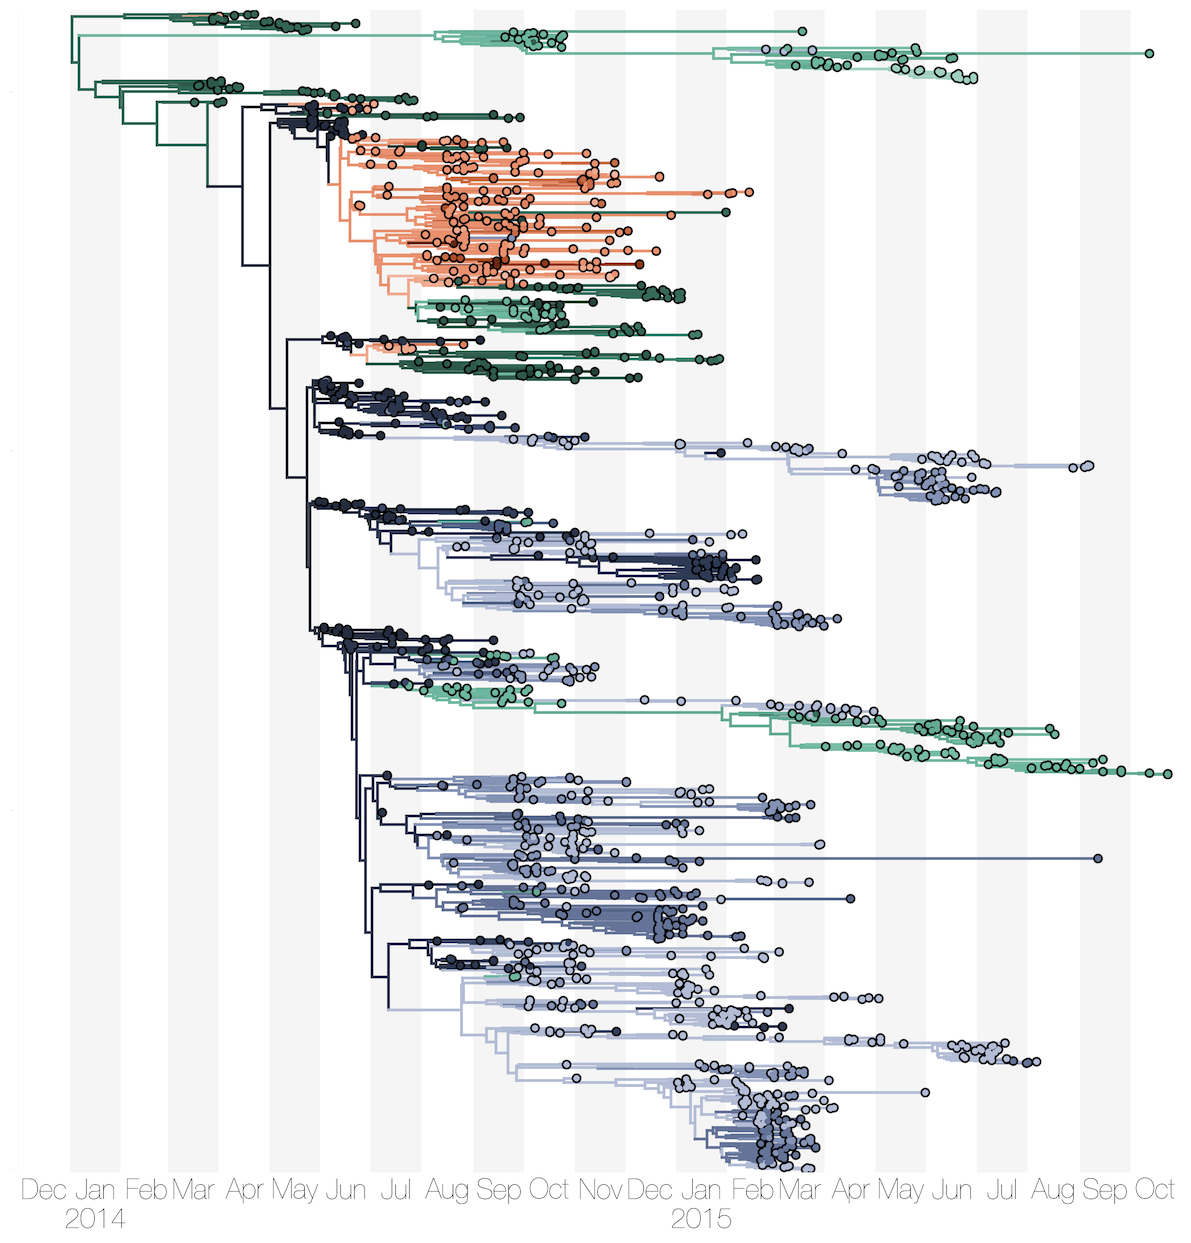
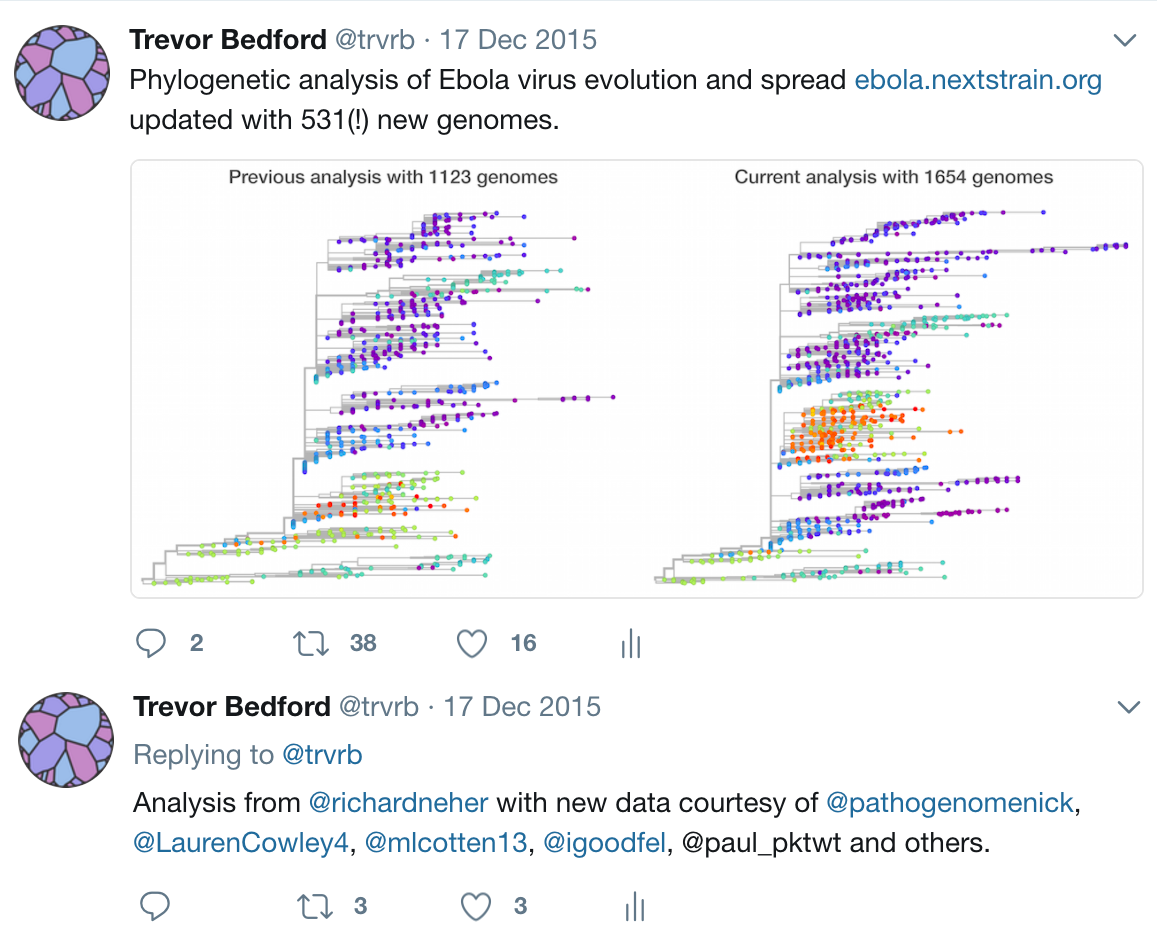
Studies of Ebola phylogenetics published alongside outbreak
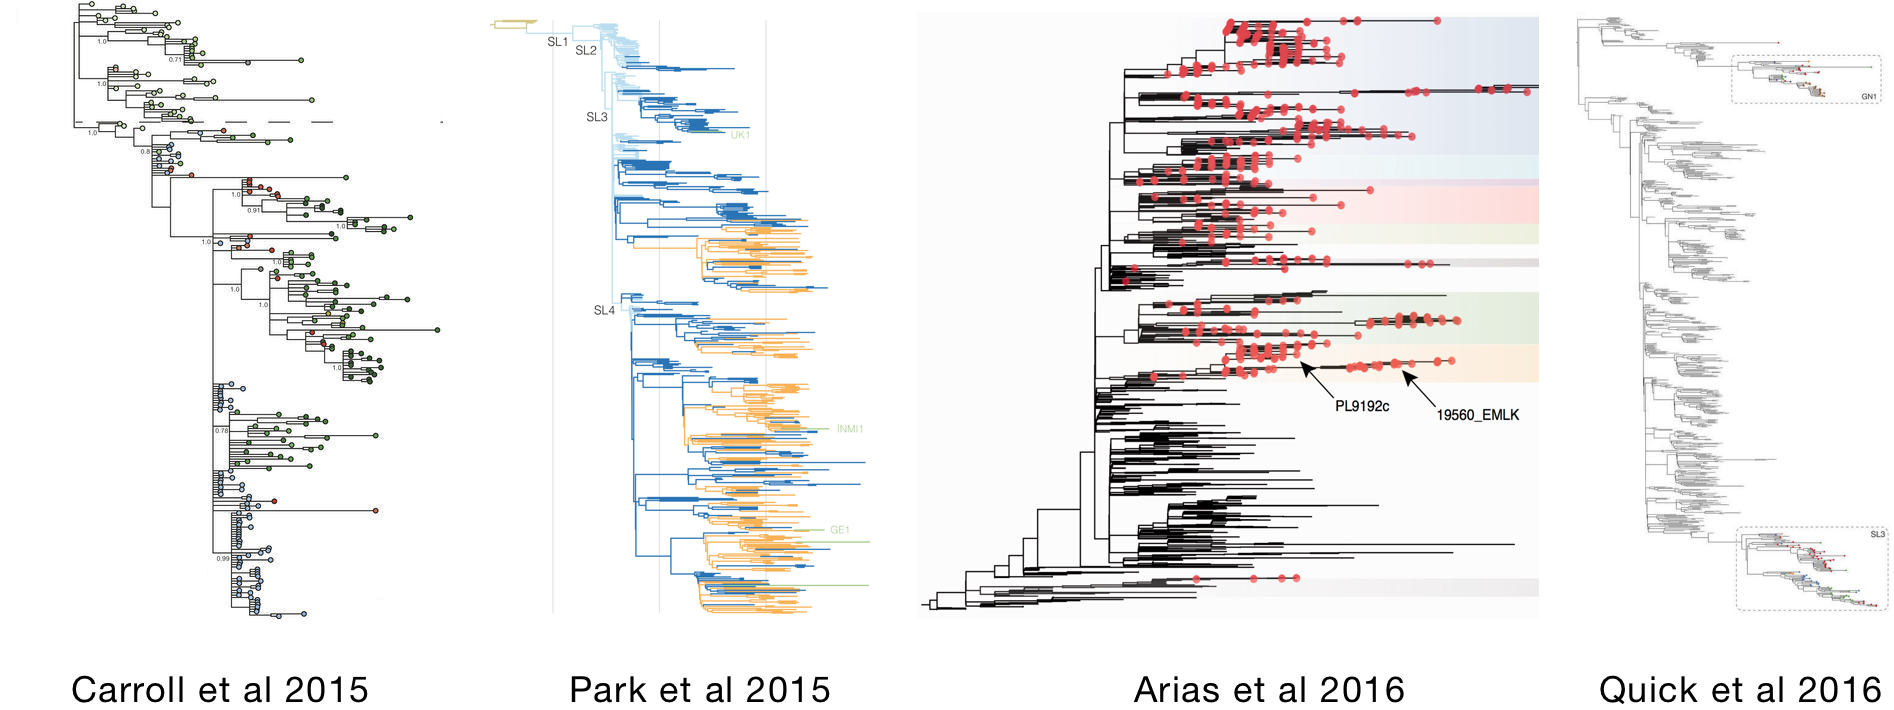
Difficult to extract a comprehensive picture from these studies
Comprehensive analysis published in Apr 2017 (on bioRxiv Sep 2016)
There have also been publications on the ongoing Zika epidemic
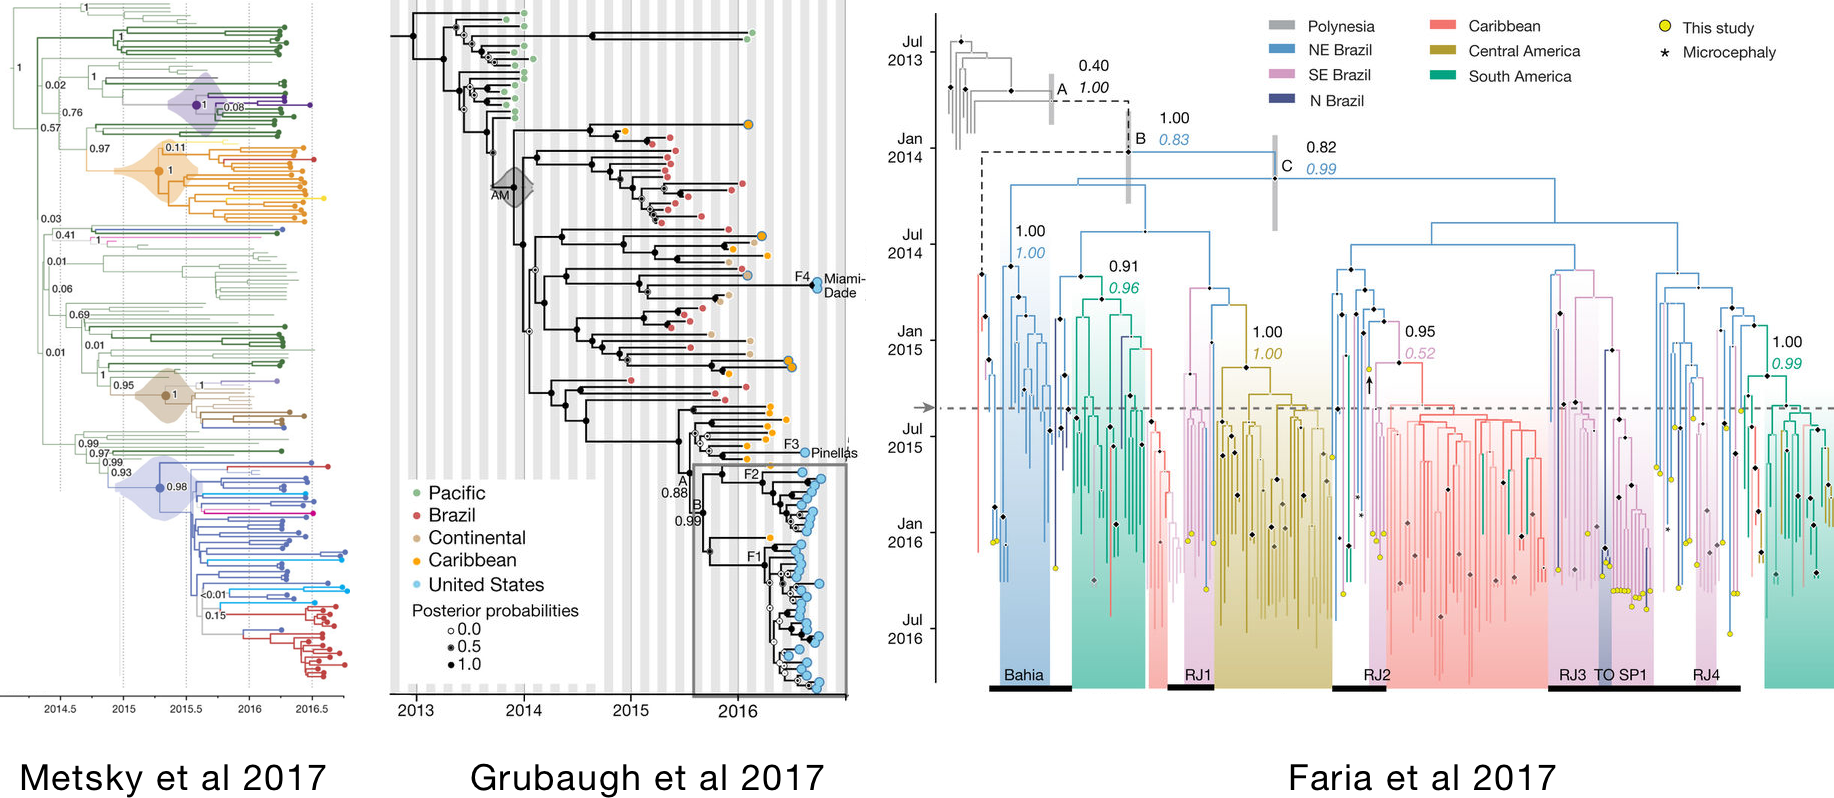
There currently does not exist a comprehensive Zika phylogeny in the literature (or bioRxiv)
- Trees in these papers used 174, 104 and 200 genomes, respectively
- There are now 542 genomes in Genbank
Even if these genomes did not change the story told by these papers, they could improve credible intervals and connect dots not available to the original papers
Outline
- What we're trying to do
- Brief overview of approach
- Design choices we've made
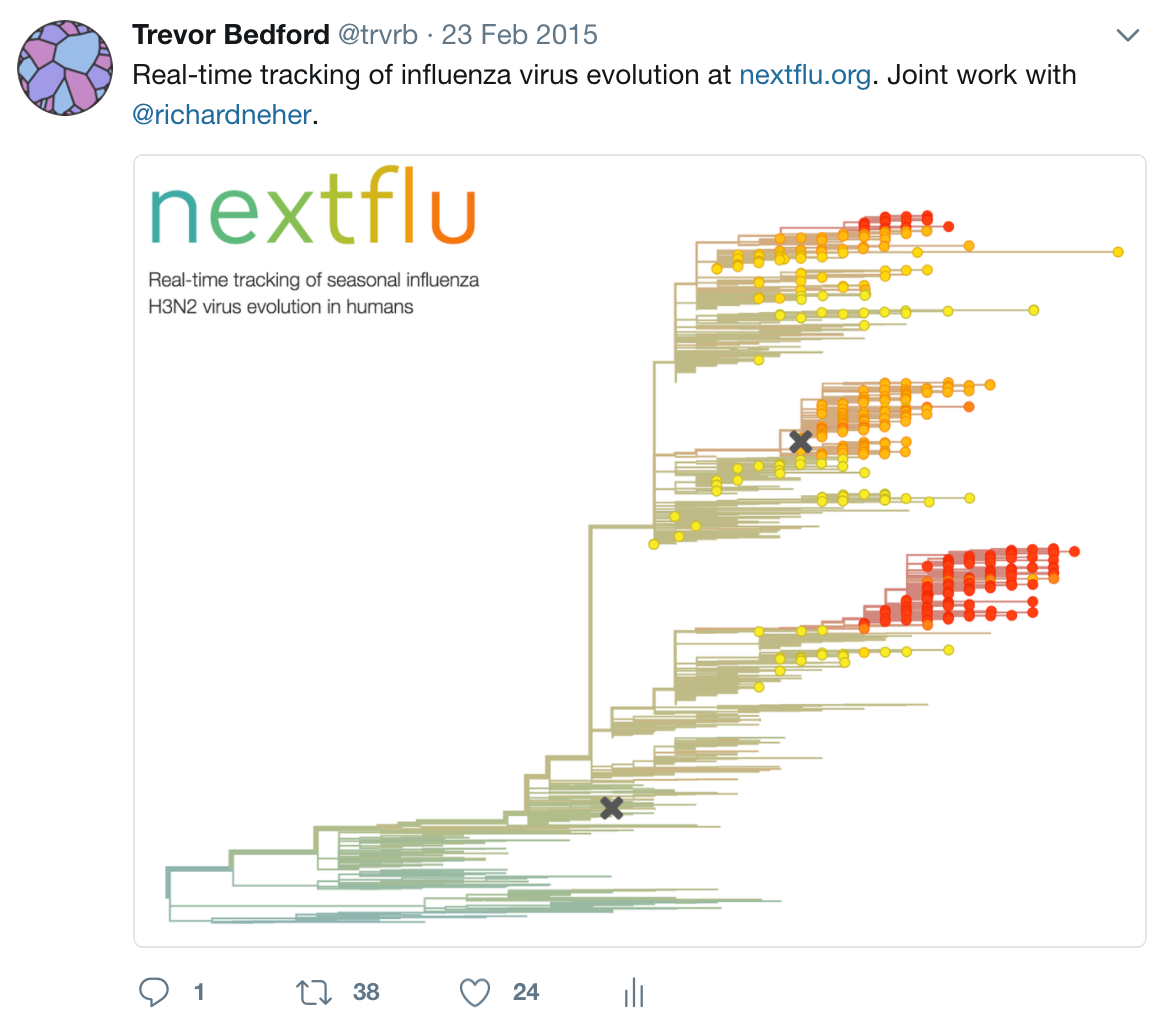
nextstrain
Project to conduct real-time molecular epidemiology and evolutionary analysis of emerging epidemics
with
![]() Richard Neher,
Richard Neher,
![]() James Hadfield,
James Hadfield,
![]() Colin Megill,
Colin Megill,
![]() Sidney Bell,
Sidney Bell,
![]() Charlton Callender,
Charlton Callender,
![]() Barney Potter,
Barney Potter,
and ![]() John Huddleston
John Huddleston
Timeline
Key challenges
- Timely analysis and sharing of results critical
- Dissemination must be scalable
- Integrate many data sources
- Results must be easily interpretable and queryable
Nextstrain architecture
All code open source at github.com/nextstrain
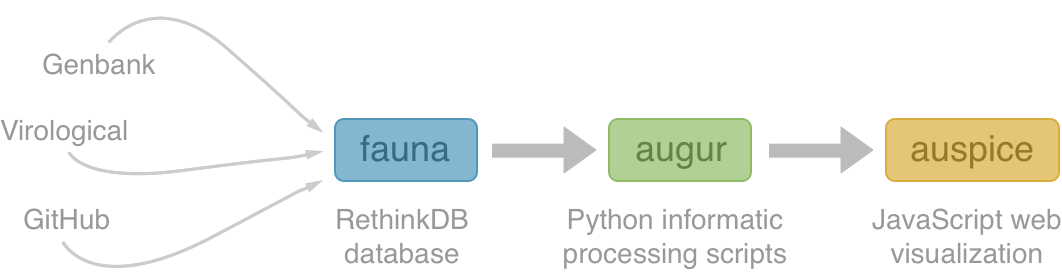
Fauna
Rethink database of virus and titer data
- Harmonizes data from different sources
- Integrates different types of data (serology, sequences, case details)
- Provides an interface for downstream analysis
Augur
Build scripts to align sequences, build trees and annotate
- Flexible build scripts to incorporate different viruses and analyses
- Constructs time-resolved phylogenies
- Annotates with geographic transitions and mutation events
Example augur pipeline for 1600 Ebola genomes
- Align with MAFFT (34 min)
- Build ML tree with RAxML (54 min)
- Temporally resolve tree and geographic ancestry with TreeTime (16 min)
- Total pipeline (1 hr 46 min)
Auspice
Web visualization of resulting trees
- Interactive data exploration and filtering
- Framework through React / D3
- Connects phylogeny, geography and genotypes
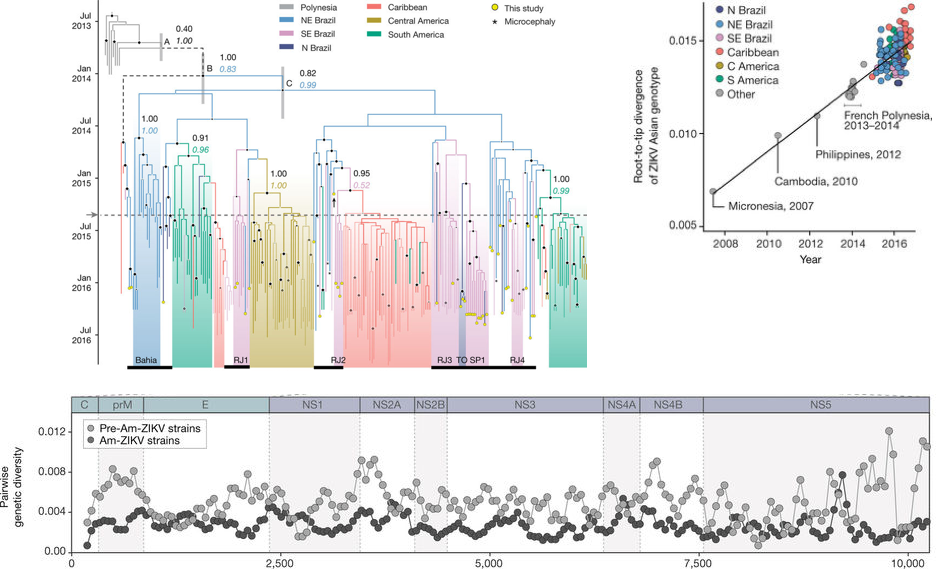
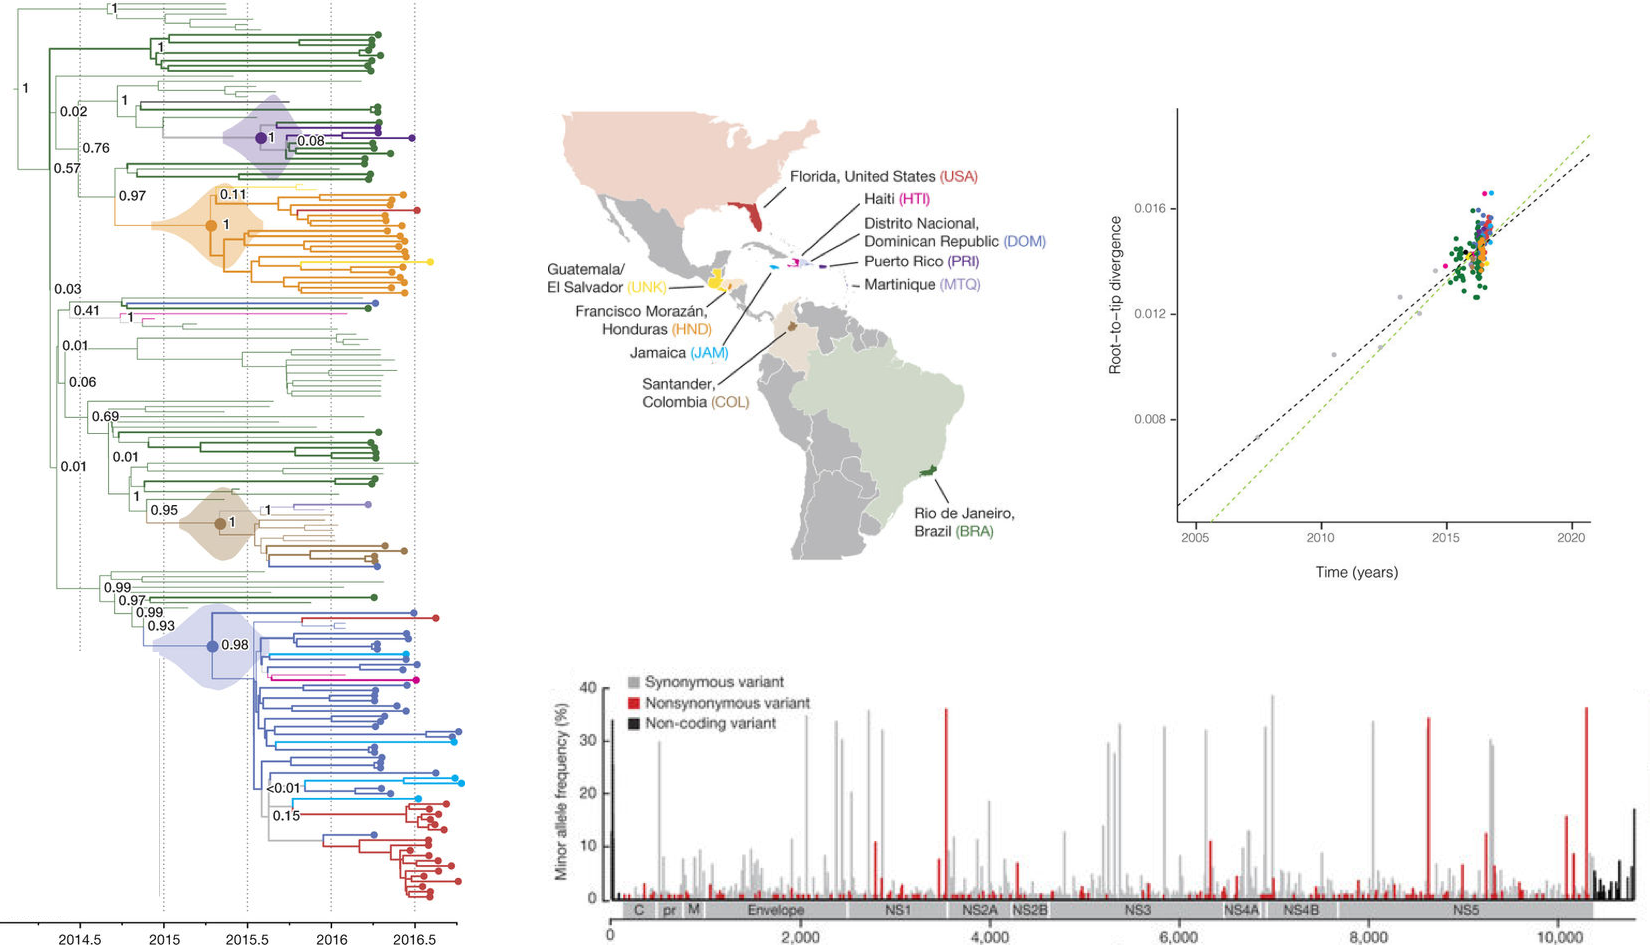
Analysis targets
- Phylogeny
- Mutations present
- Geographic transitions
- Root-to-tip plot
Example from Faria et al
Example from Metsky et al
nextstrain.org
Viz strategies
Core of visualization is the ability to make comparisons
Color to link attributes across panels
Details on demand
Transitions to maintain object constancy
Filtering time, space and other attributes
Viz challenges
- Recombination / reassortment
- Combining fragments with full genomes
- Combining metadata of varying resolution
- Conveying uncertainty
Importance of curation by domain experts
Public dissemination vs on-site investigation
Acknowledgements
Nextstrain software development: Richard Neher, James Hadfield, Colin Megill, Sidney Bell, Charlton Callender, Barney Potter, John Huddleston
Advice / support: Andrew Rambaut, Nick Loman, Ian Goodfellow, Matt Cotten, Paul Kellam, Kristian Andersen, Nathan Grubaugh, Pardis Sabeti