Influenza evolutionary dynamics and vaccine strain selection
Trevor Bedford (@trvrb)
4 Apr 2018
Fogarty Seminar
NIH
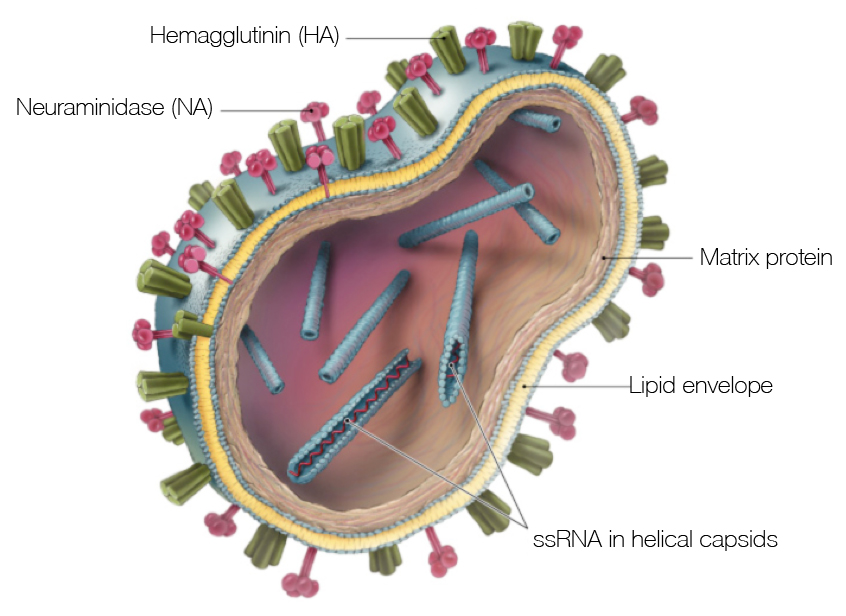
Influenza virus
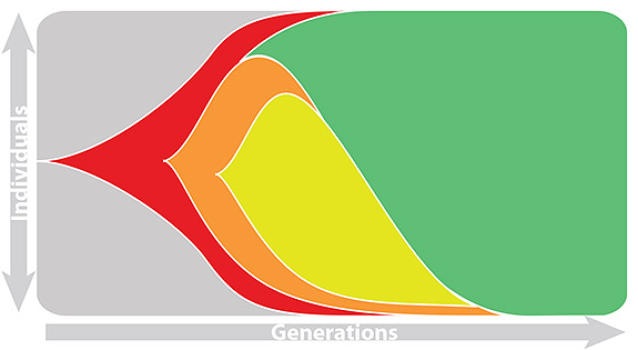
Population turnover is extremely rapid
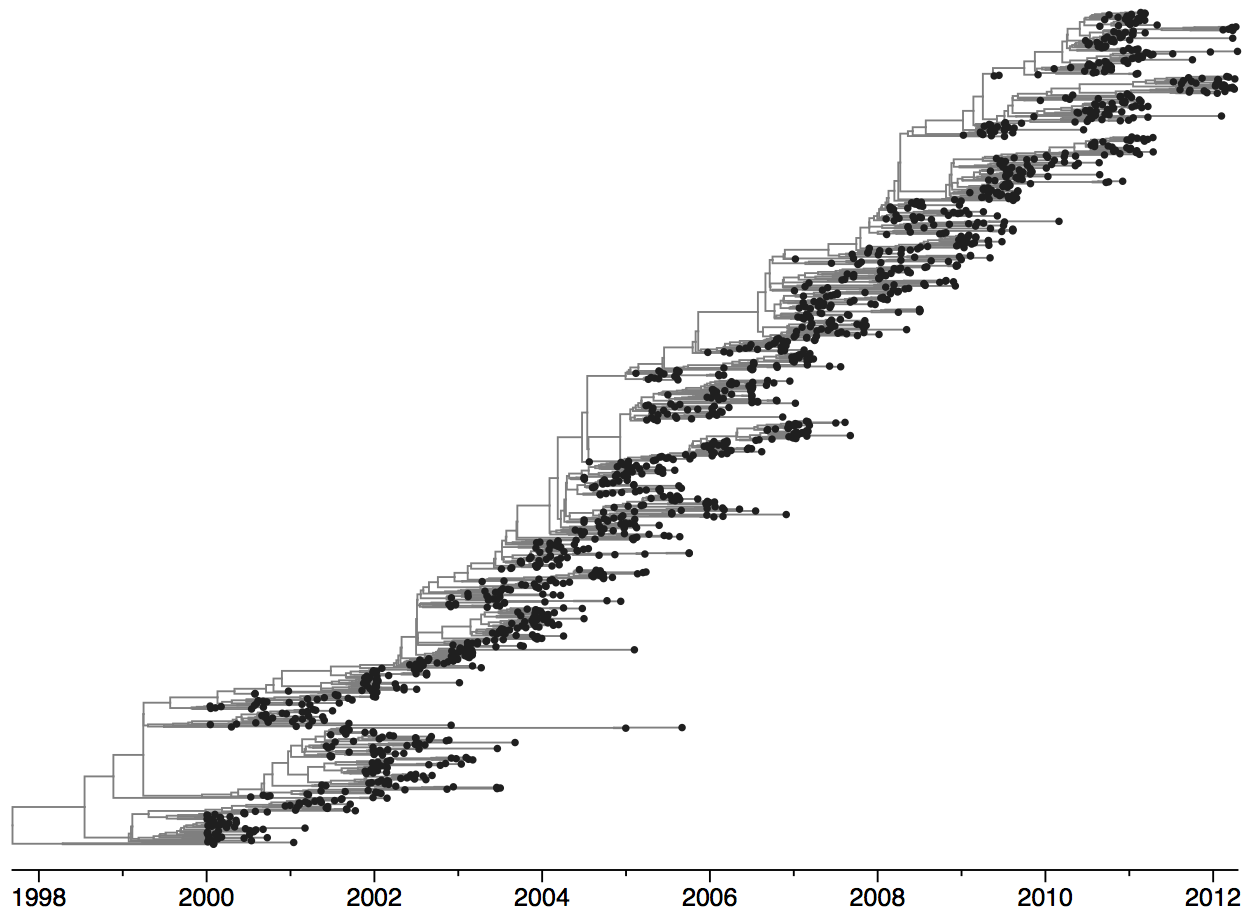
Clades emerge, die out and take over
Clades show rapid turnover

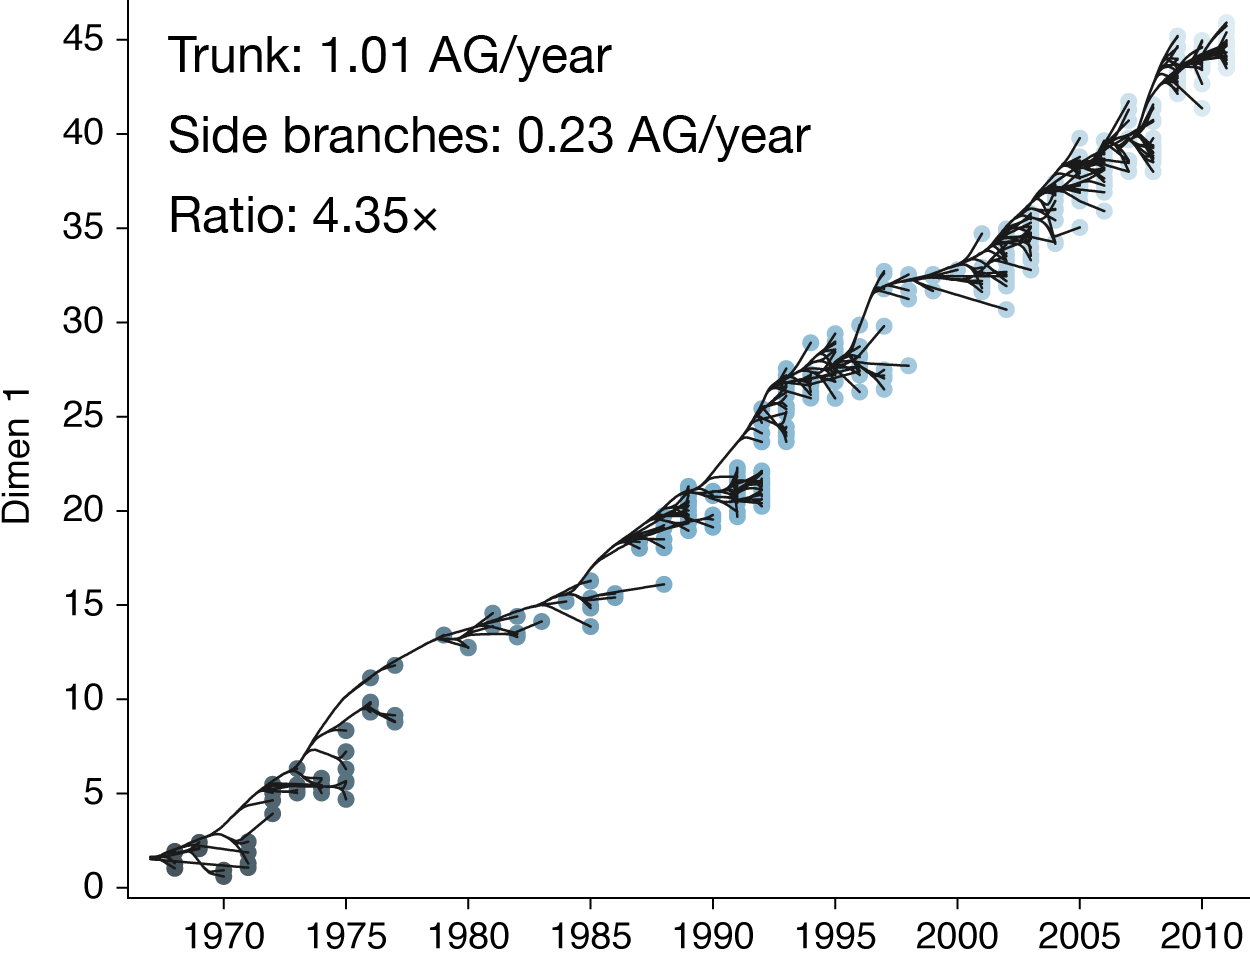
Dynamics driven by antigenic drift
Drift necessitates vaccine updates
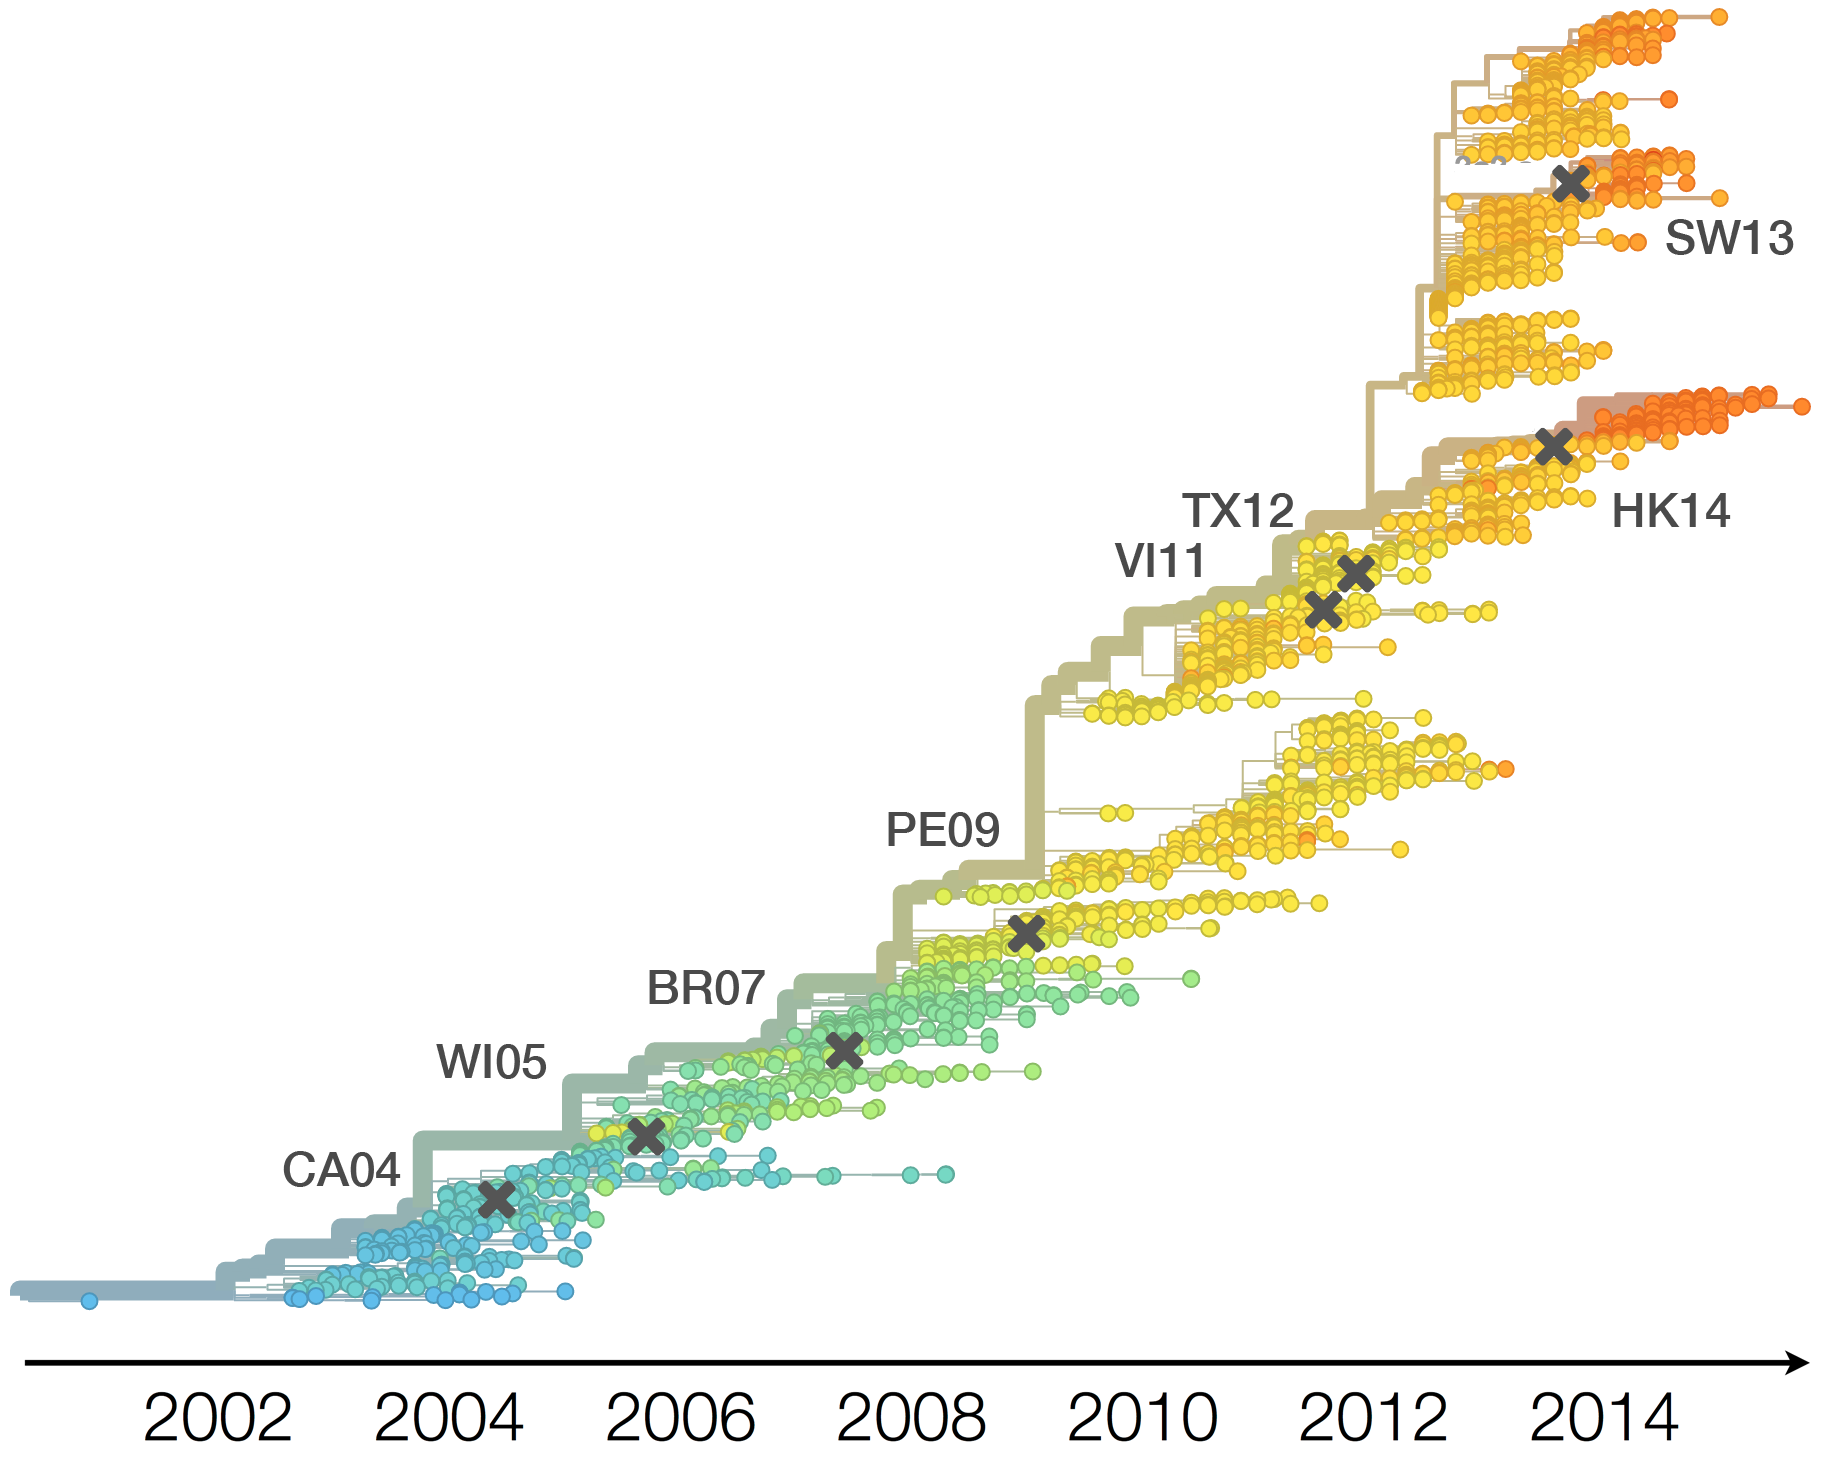
H3N2 vaccine updates occur every ~2 years
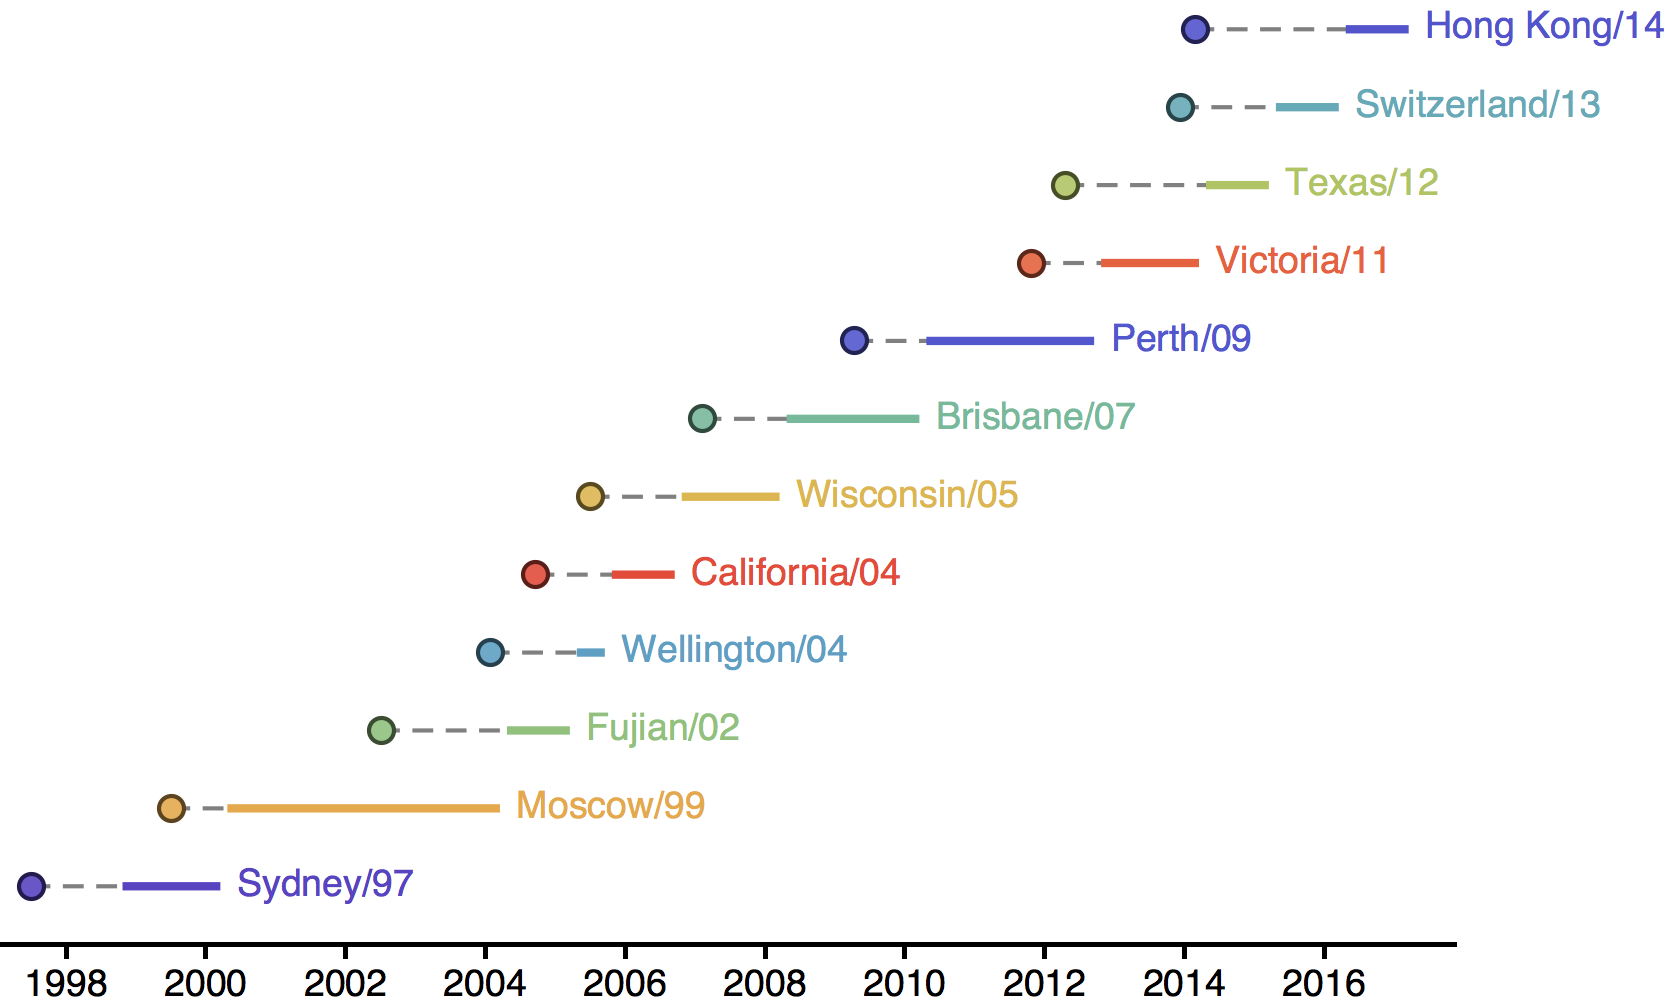
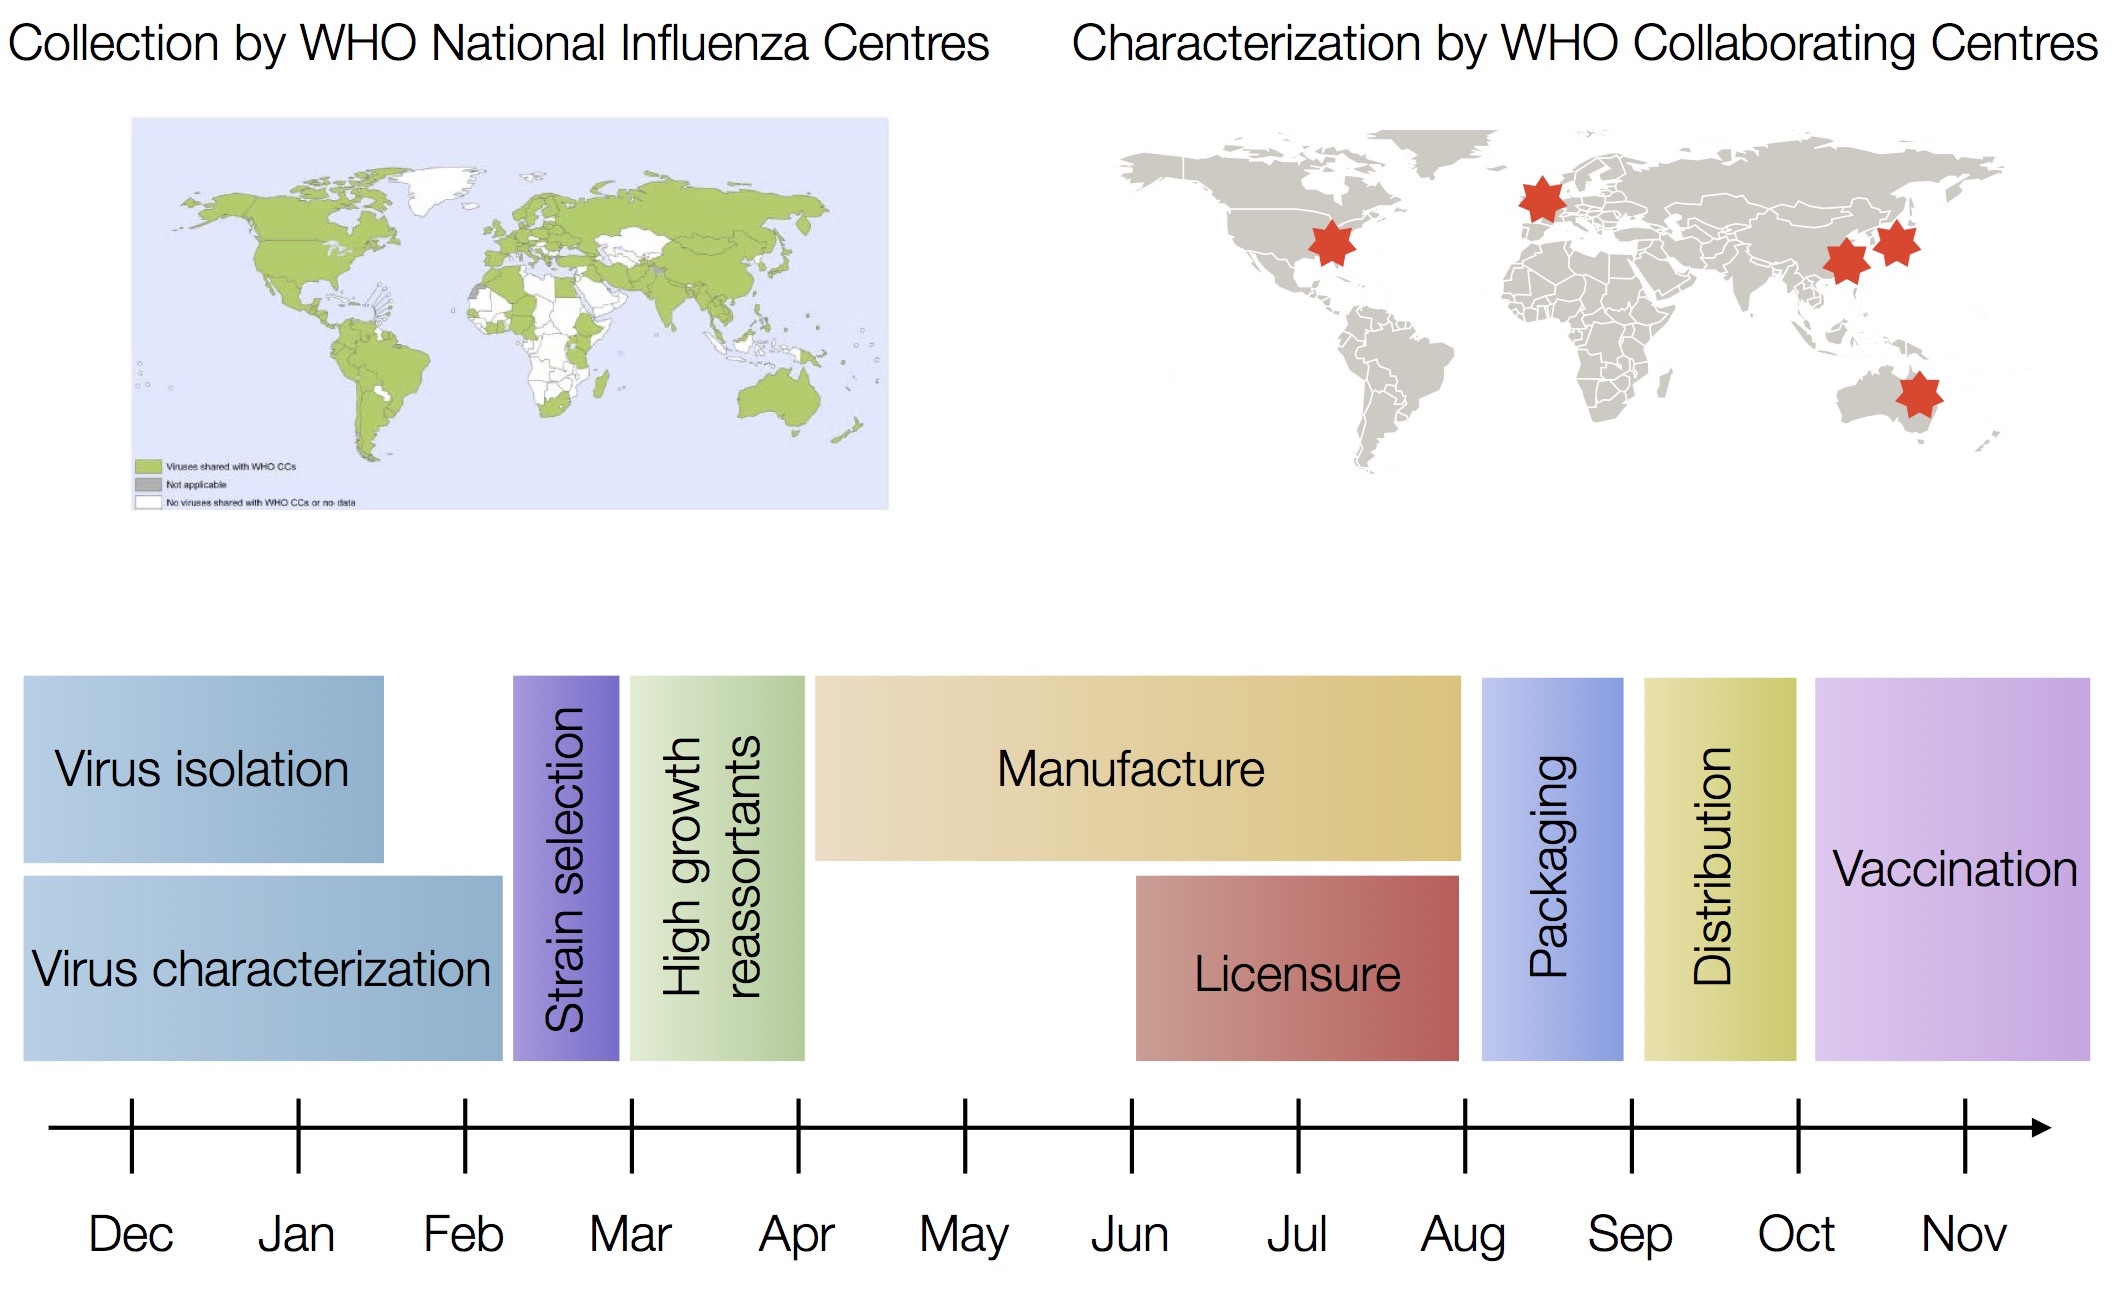
Vaccine strain selection by WHO
Problem of applied evolutionary biology
Every paper in the field...
- "These observations have implications for influenza surveillance and vaccine formulation" (Wolf et al 2006)
- "Our results have implications for the design of vaccines to combat rapidly mutating viral diseases" (Gupta et al 2006)
- "These results may have important implications for influenza vaccine and antiviral research" (Bhatt et al 2011)
- "Needless to say, these results have important implications for the updating of vaccines against influenza" (Zinder et al 2013)
Disconnect between evolutionary studies and information needed by WHO
- WHO needs specific advice, ie this strain is likely to take off, this strain is likely to die out
- Problems of generality and timeliness
My own work suffered from this
Decided to tackle this head on and build something that
- Charts behavior of specific strains
- Can be kept continually up to date
nextflu
Project to provide a real-time view of the evolving influenza population
nextflu
Project to provide a real-time view of the evolving influenza population
All in collaboration with Richard Neher

nextflu pipeline
- Download all recent HA sequences from GISAID
- Filter to remove outliers
- Subsample across time and space
- Align sequences
- Build tree
- Estimate clade frequencies
- Infer antigenic phenotypes
- Export for visualization
Up-to-date analysis publicly available at:
nextflu.org
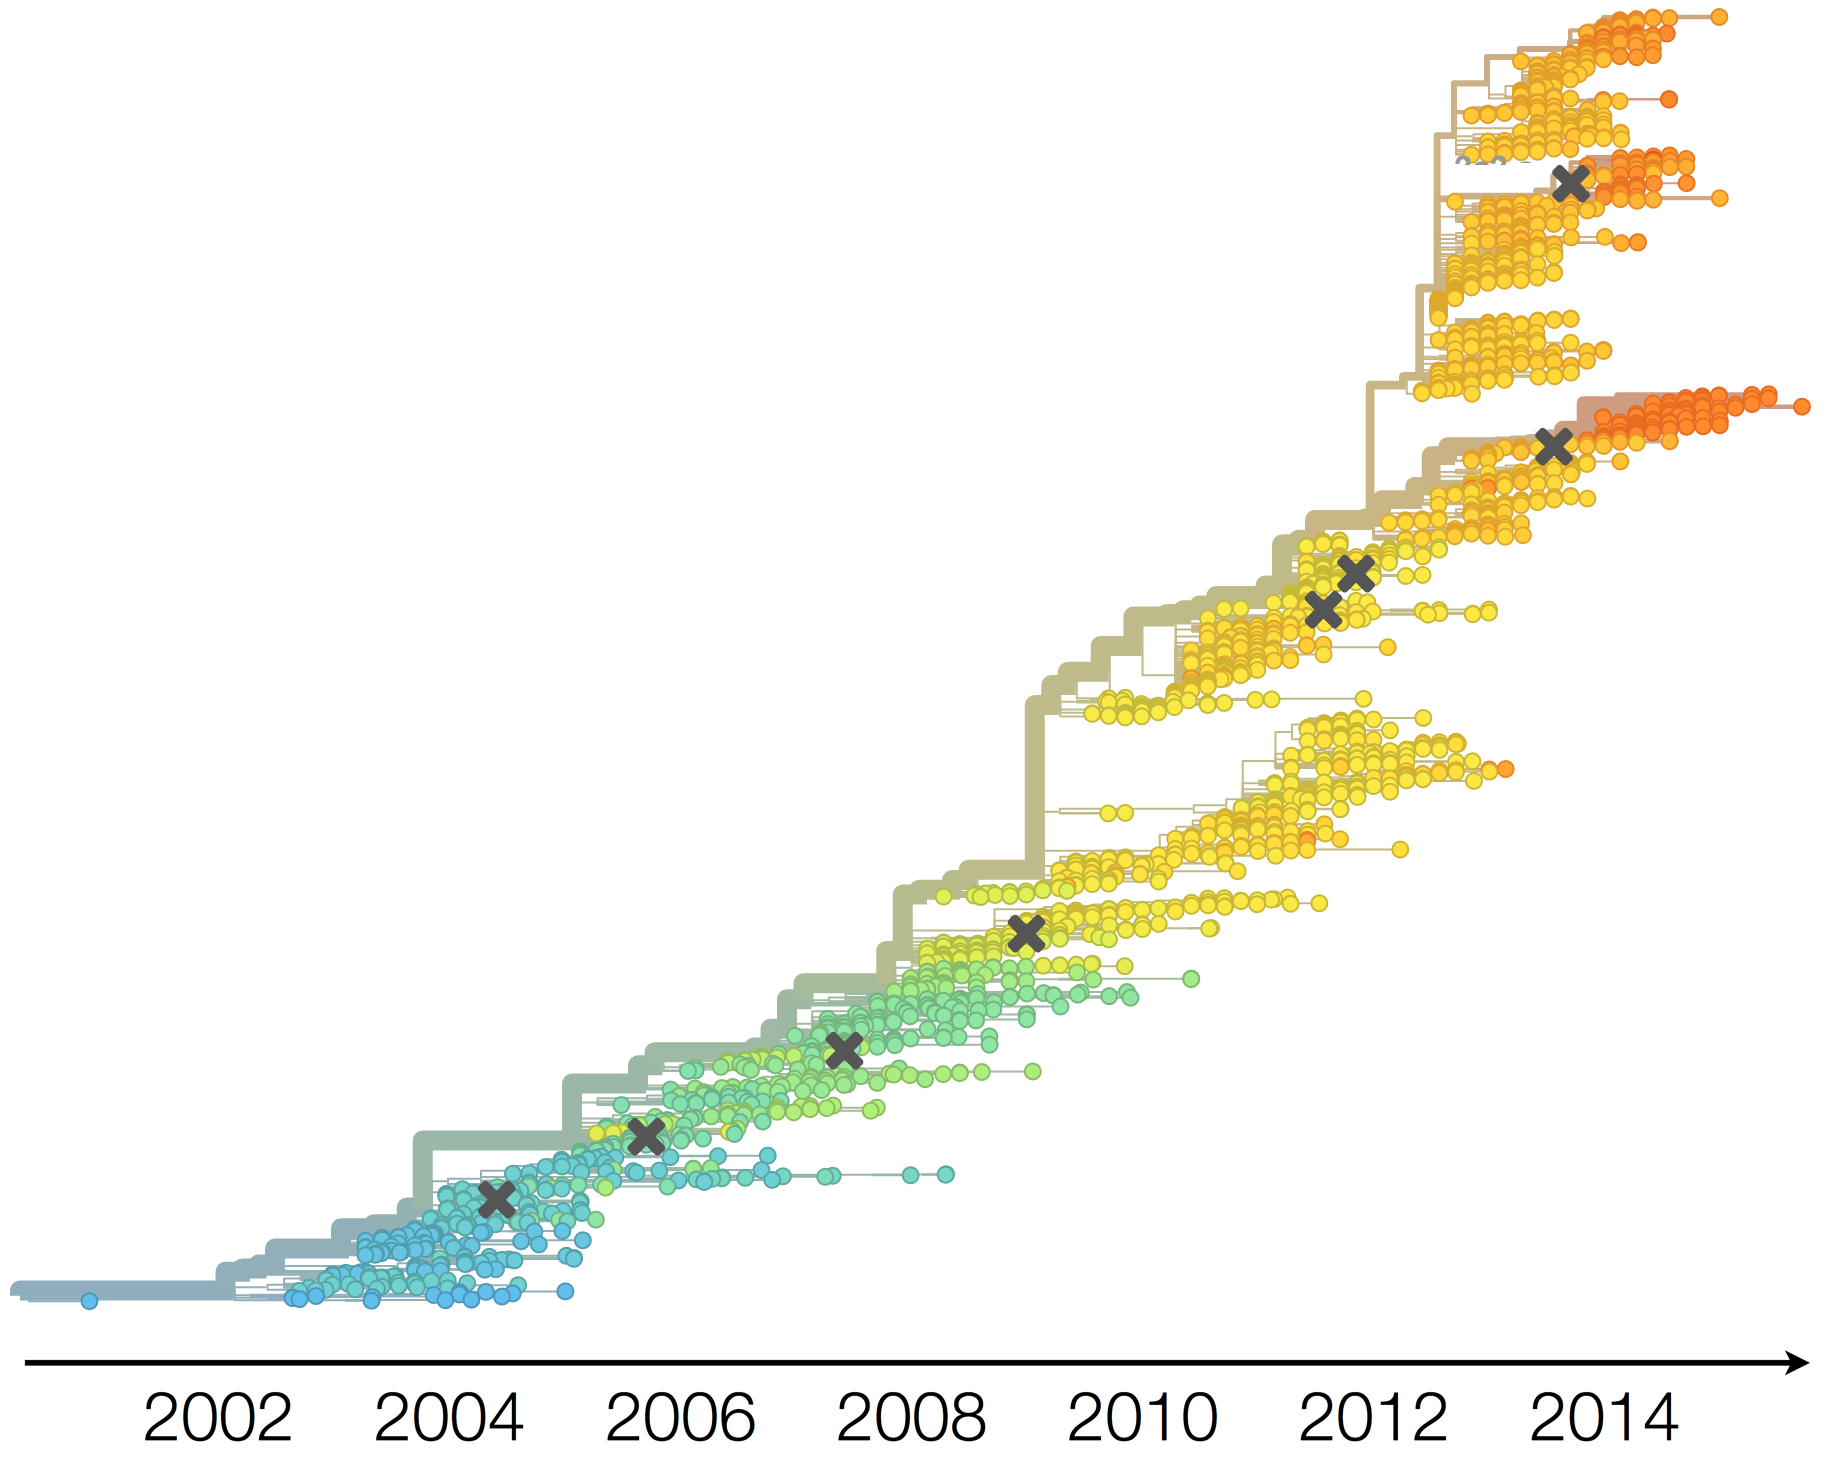
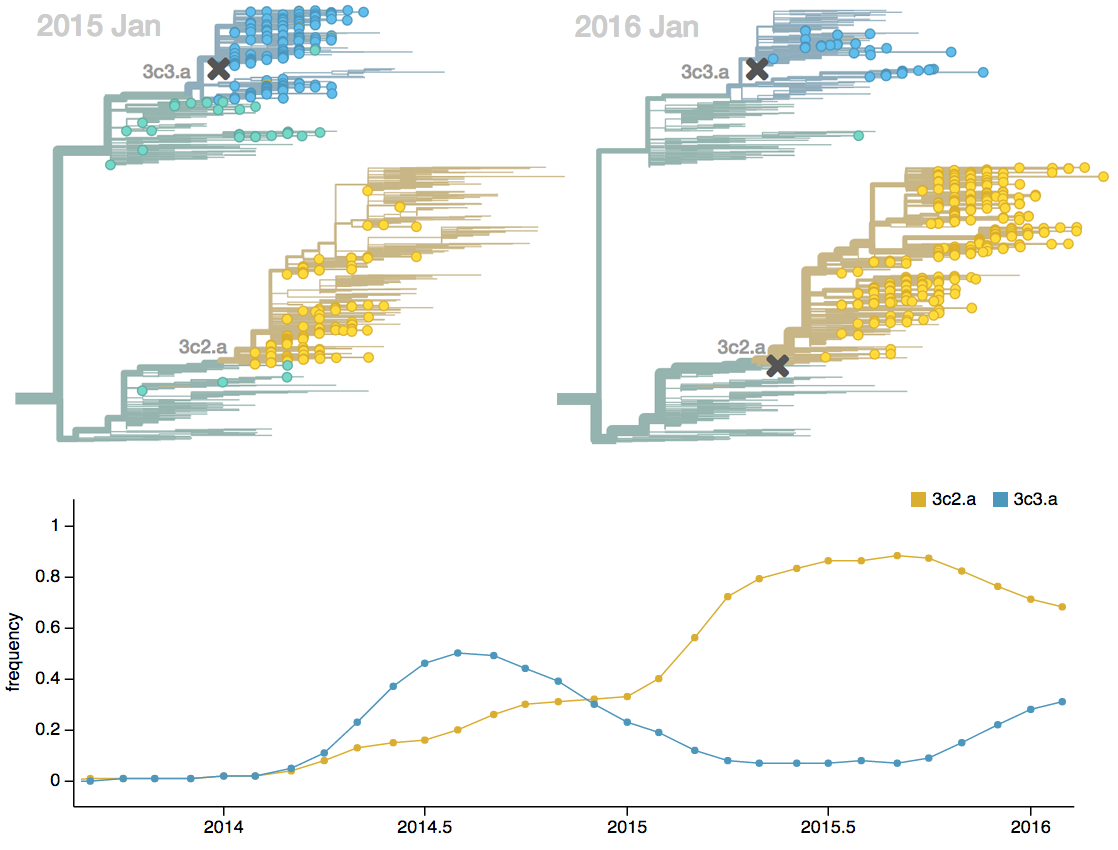
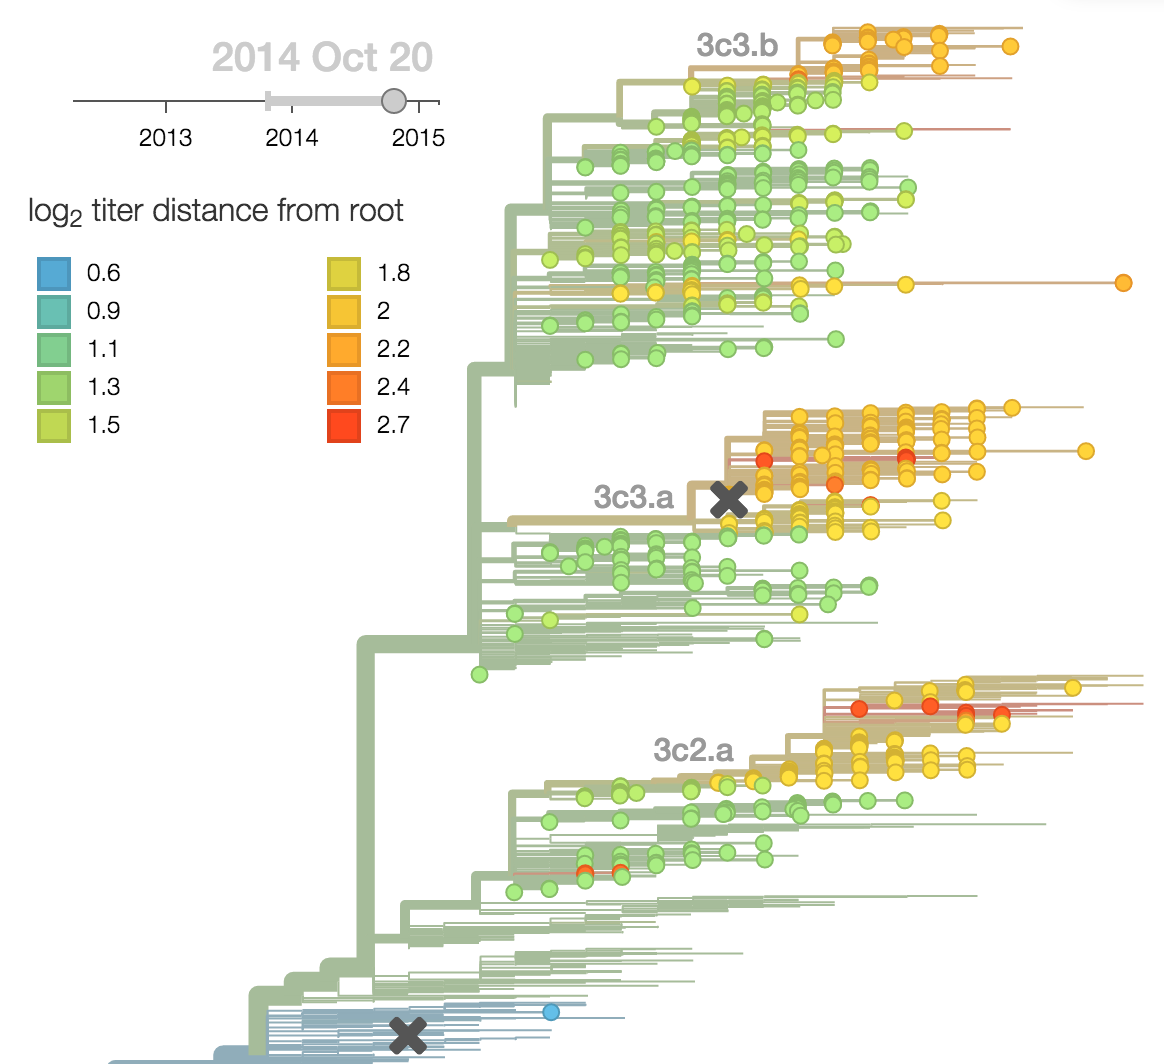
Current H3N2 diversity
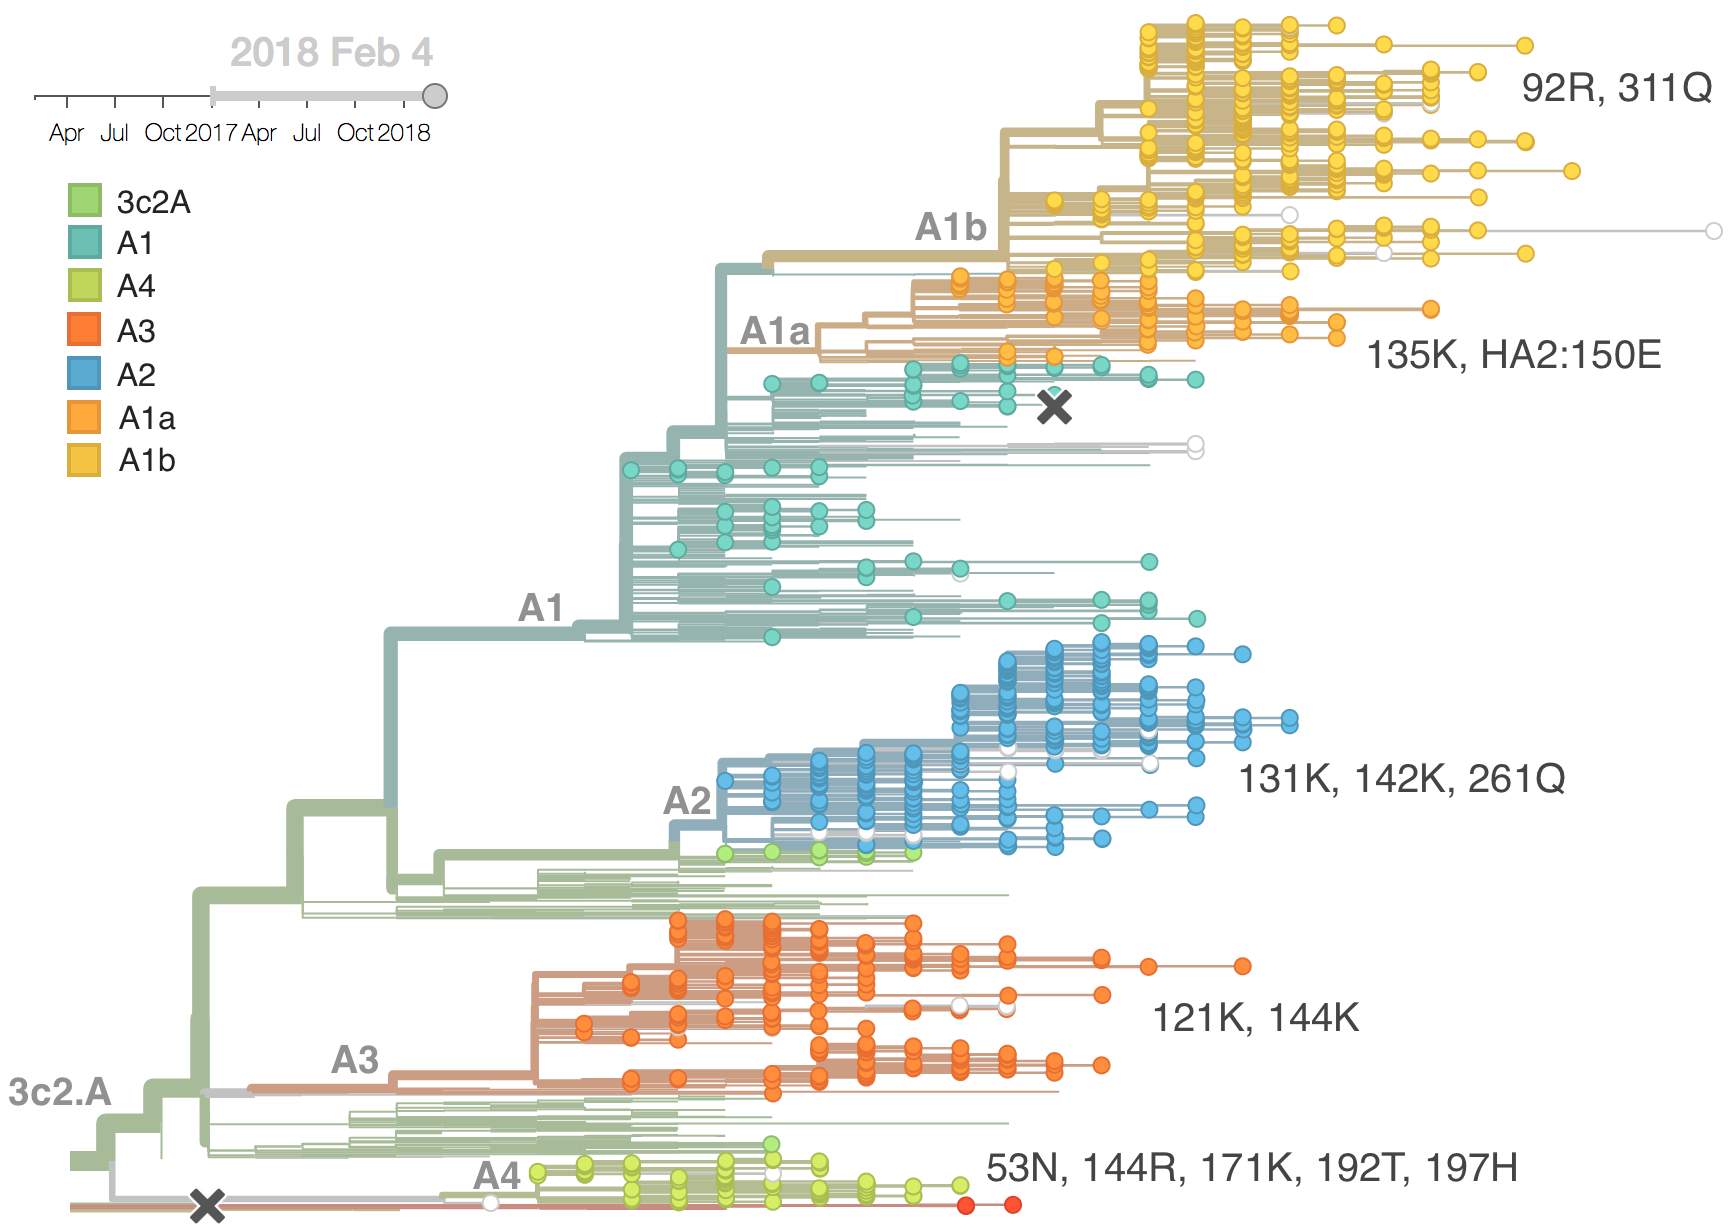
Current H3N2 diversity
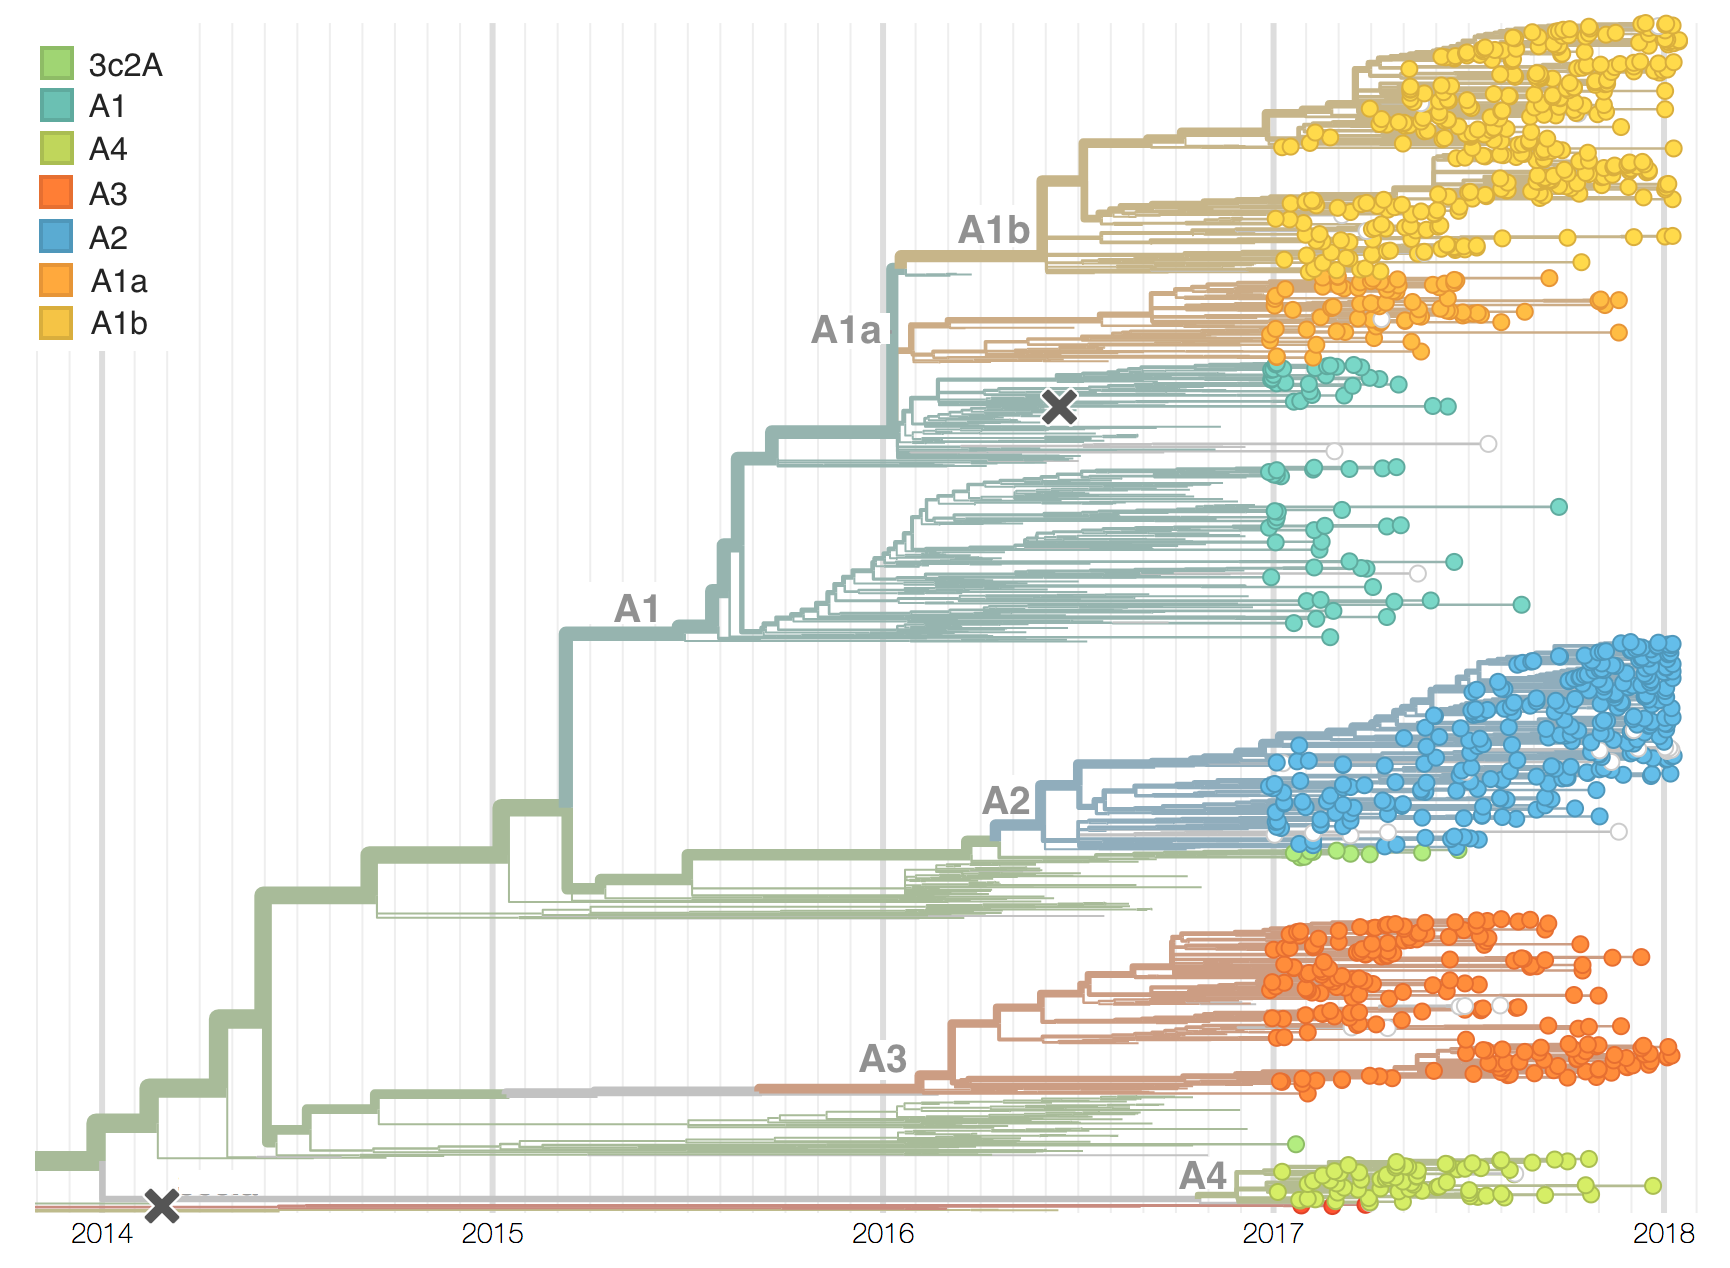
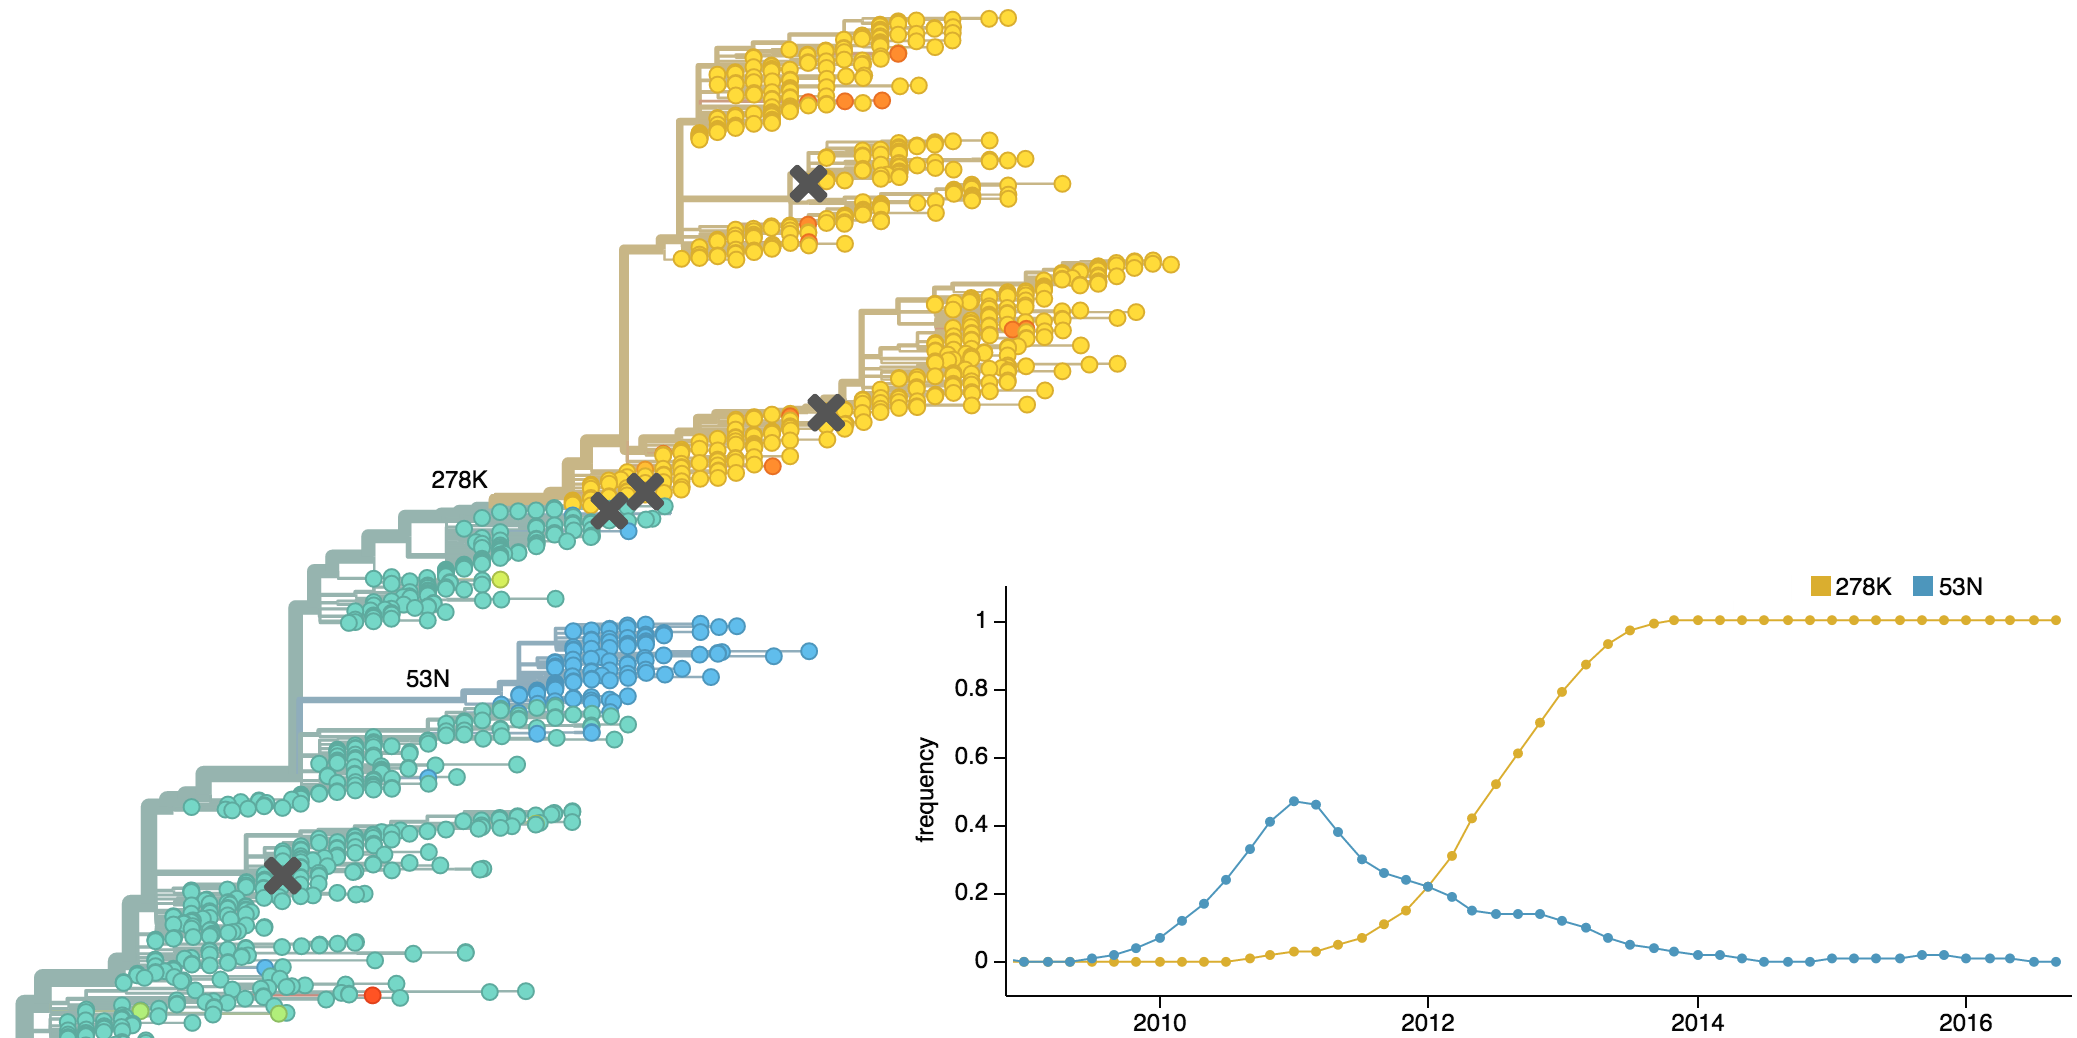
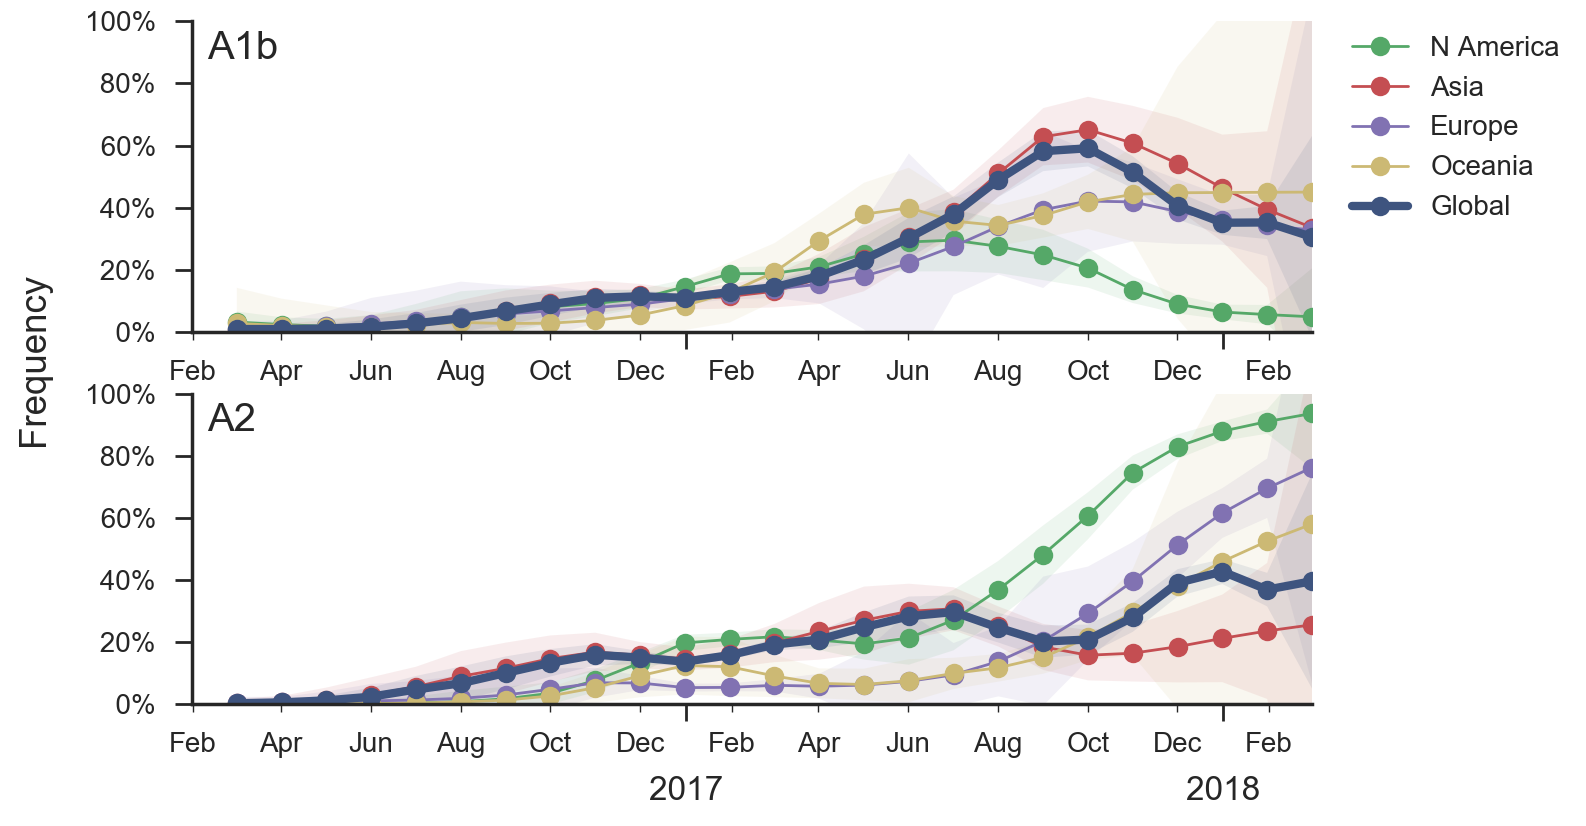
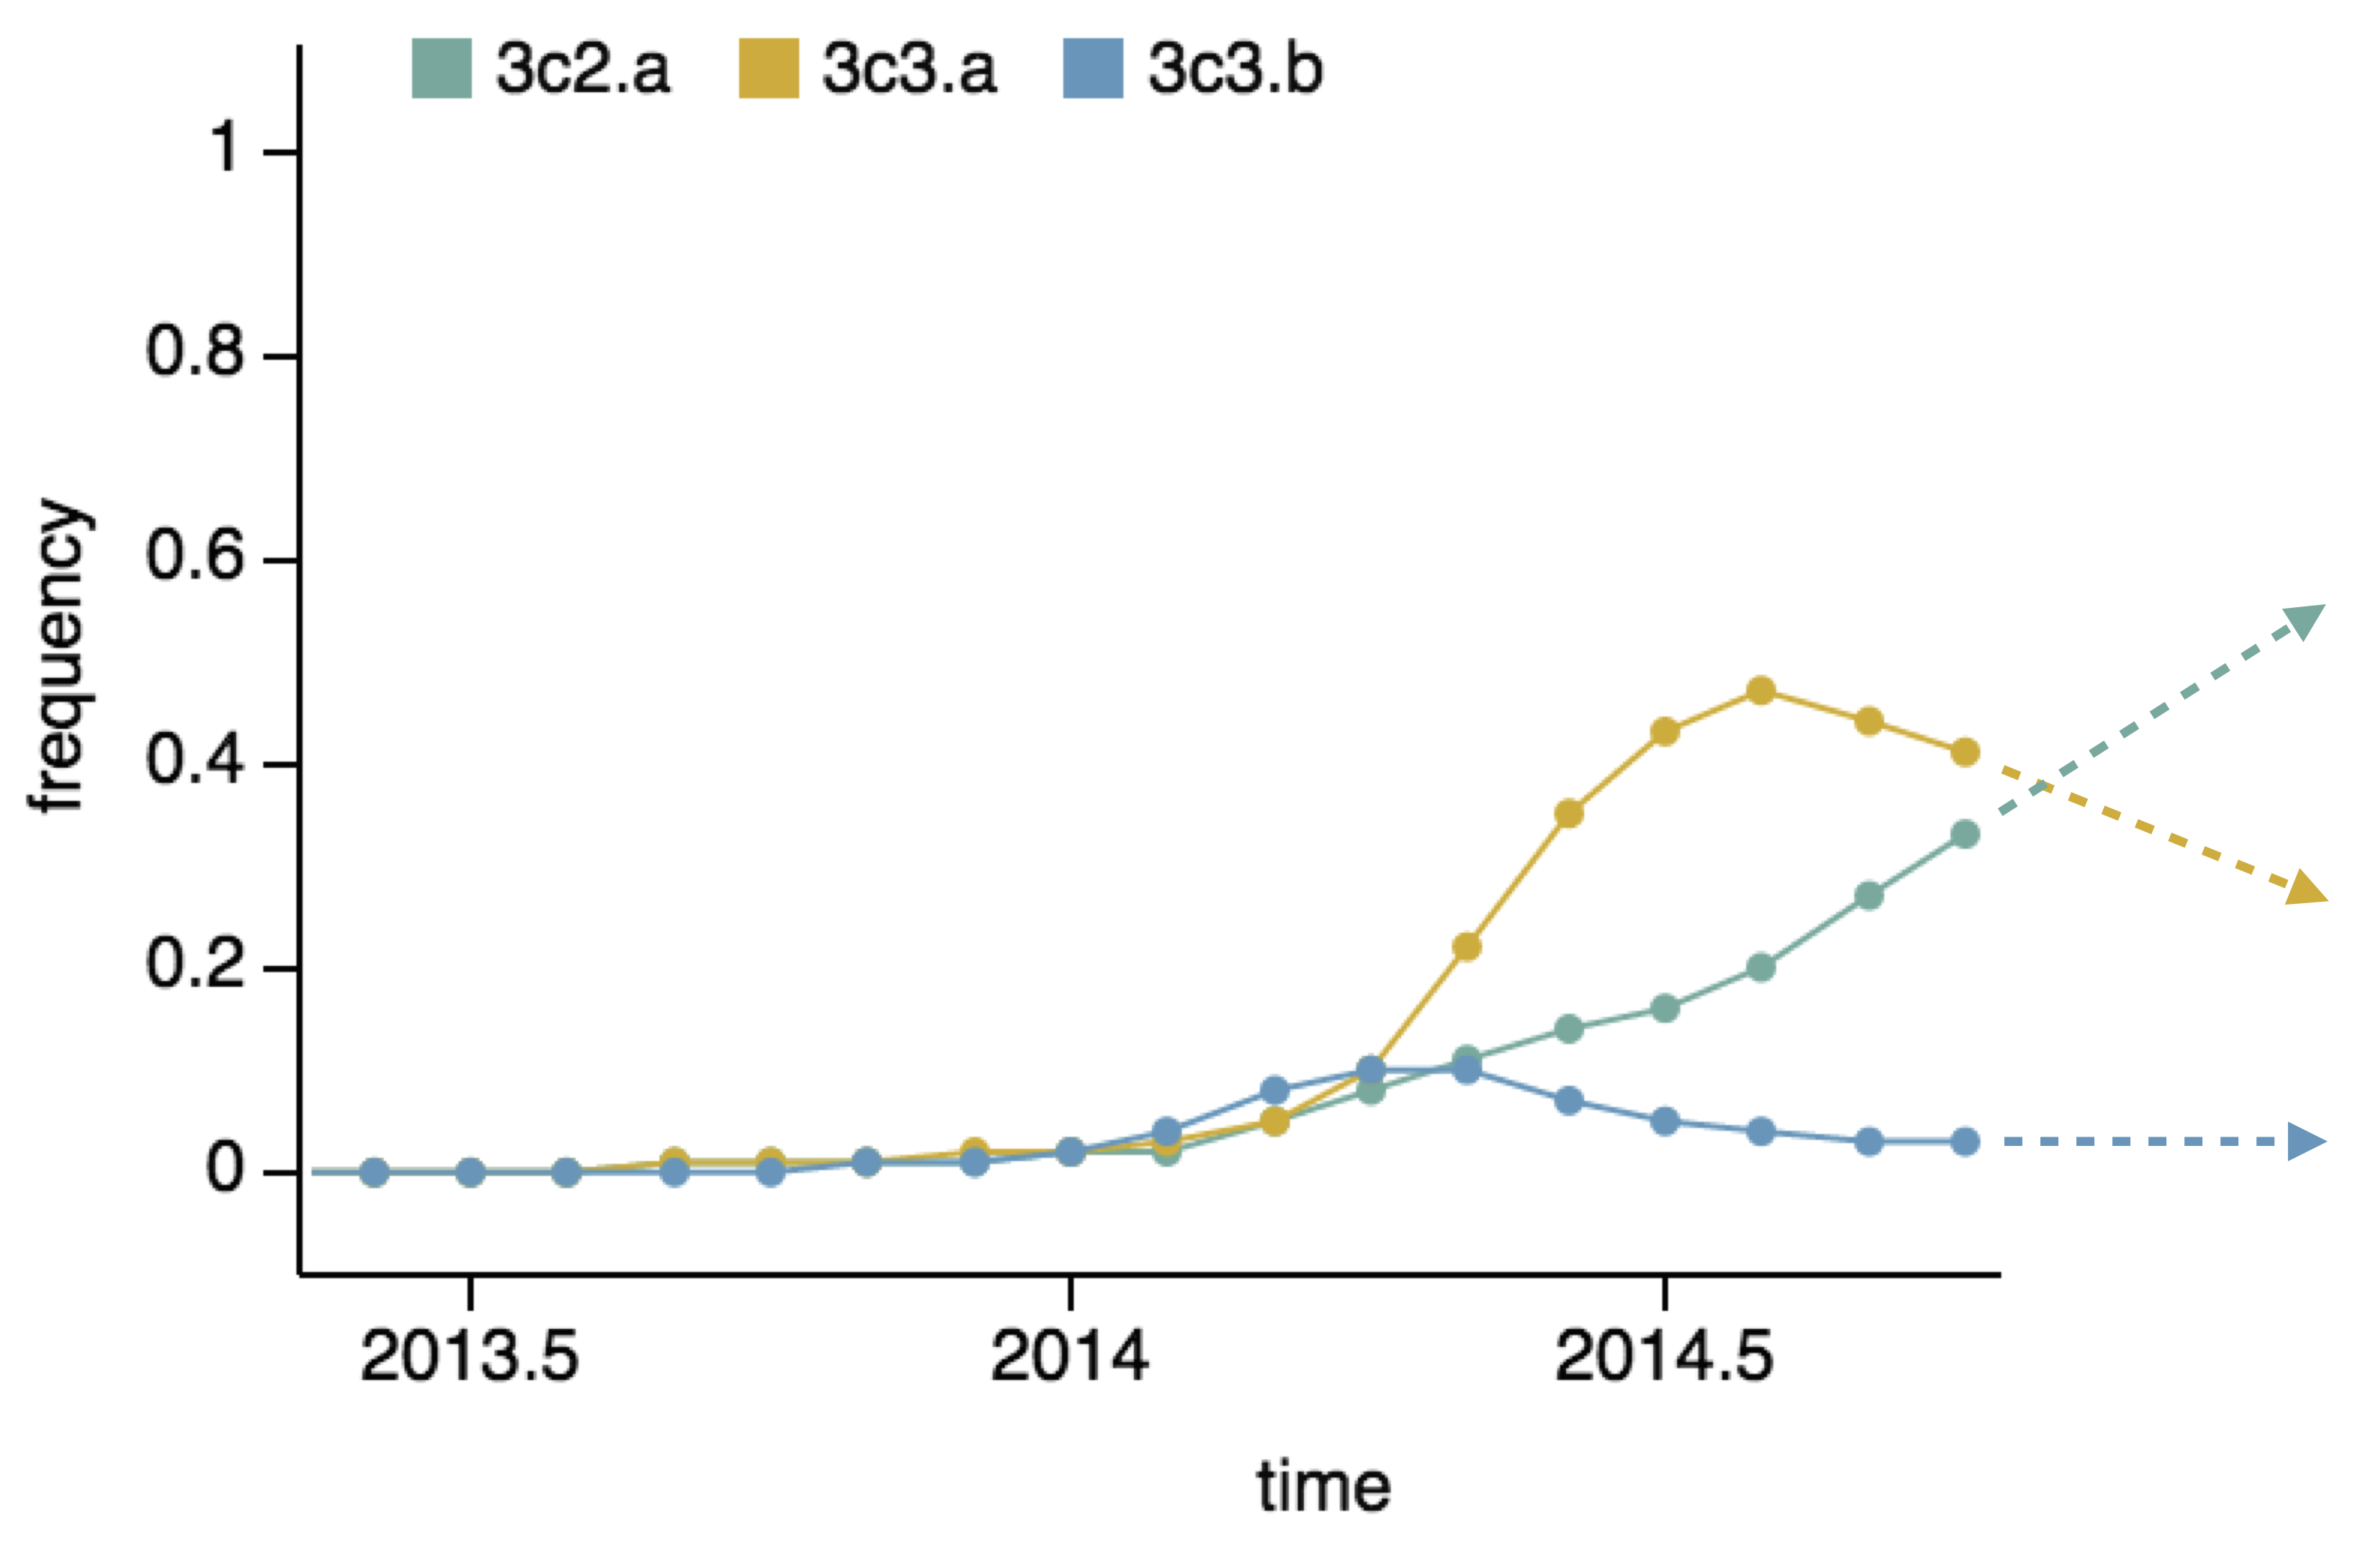
Two clades have been growing rapidly

Clade A2 more recently increasing
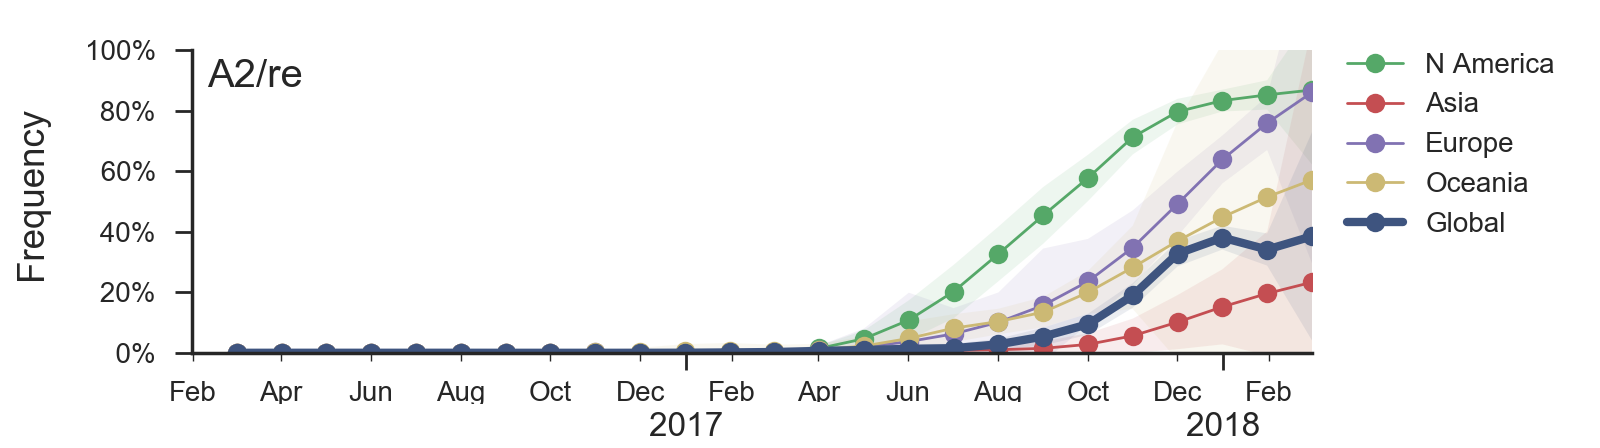
Reassortment event appears to drive success of clade A2

Reassortment event appears to drive success of clade A2
Antigenic analysis
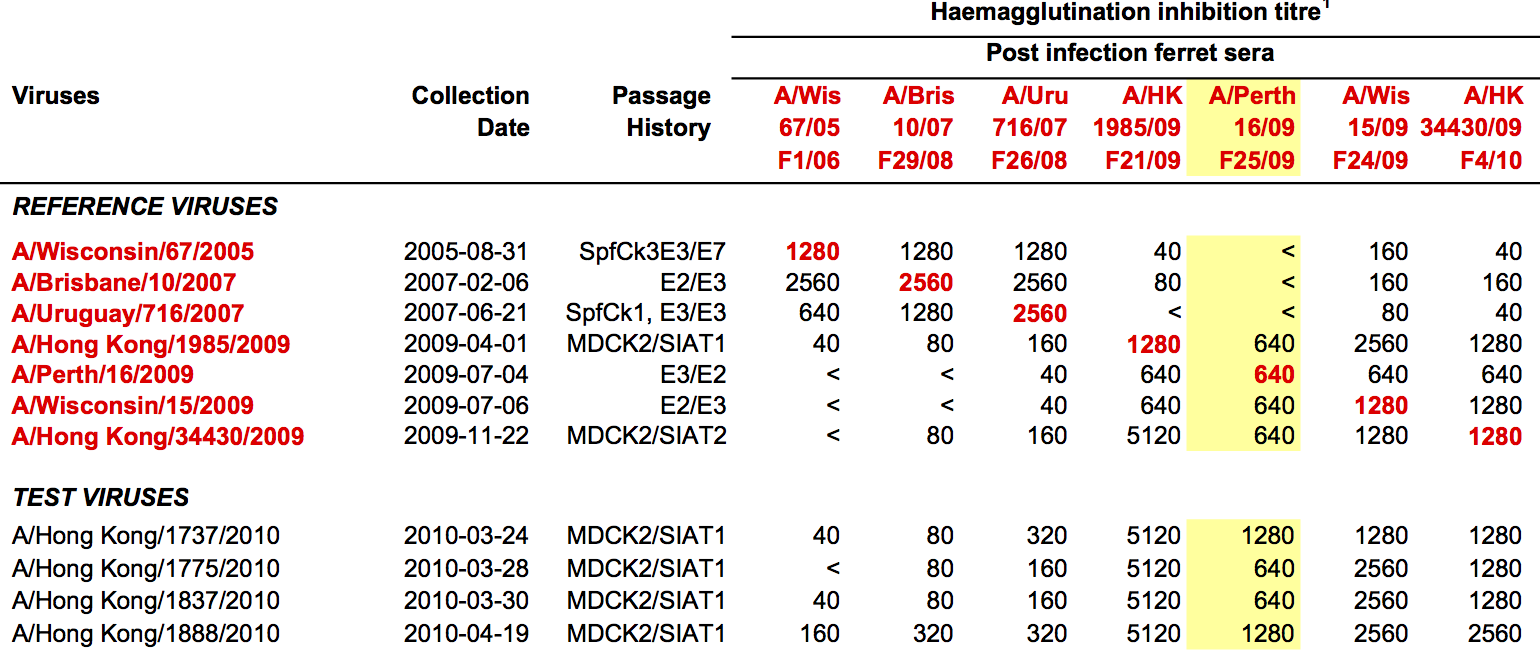
Influenza hemagglutination inhibition (HI) assay
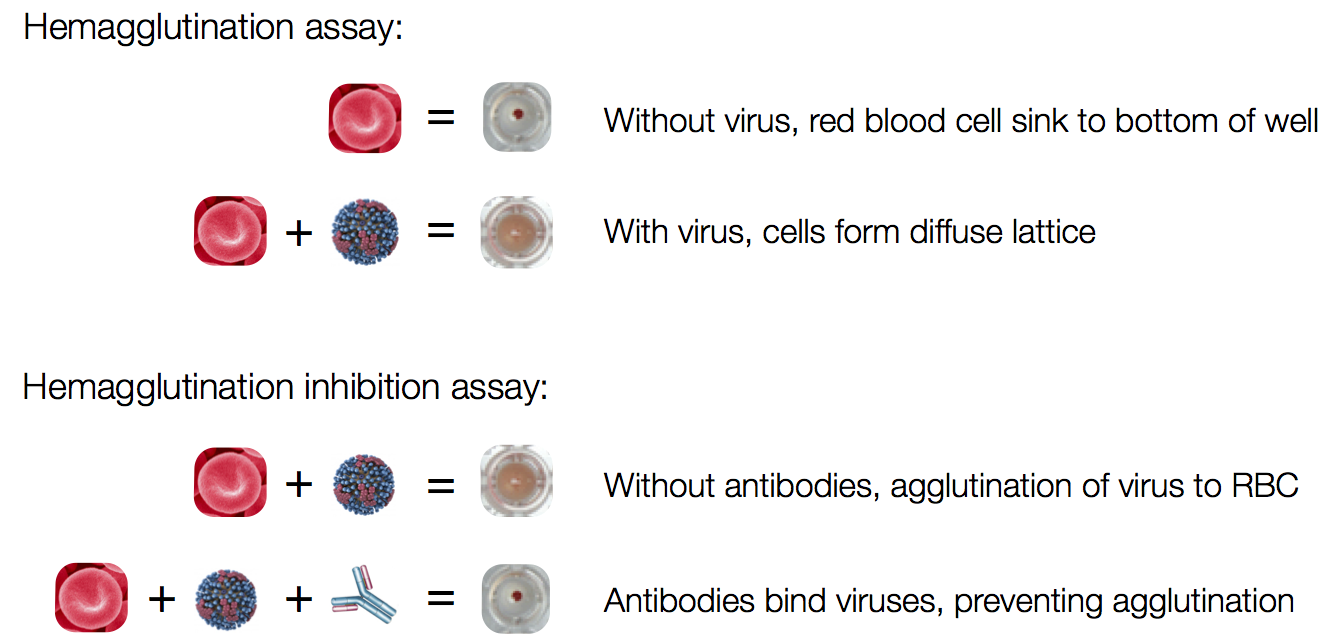
HI measures cross-reactivity across viruses
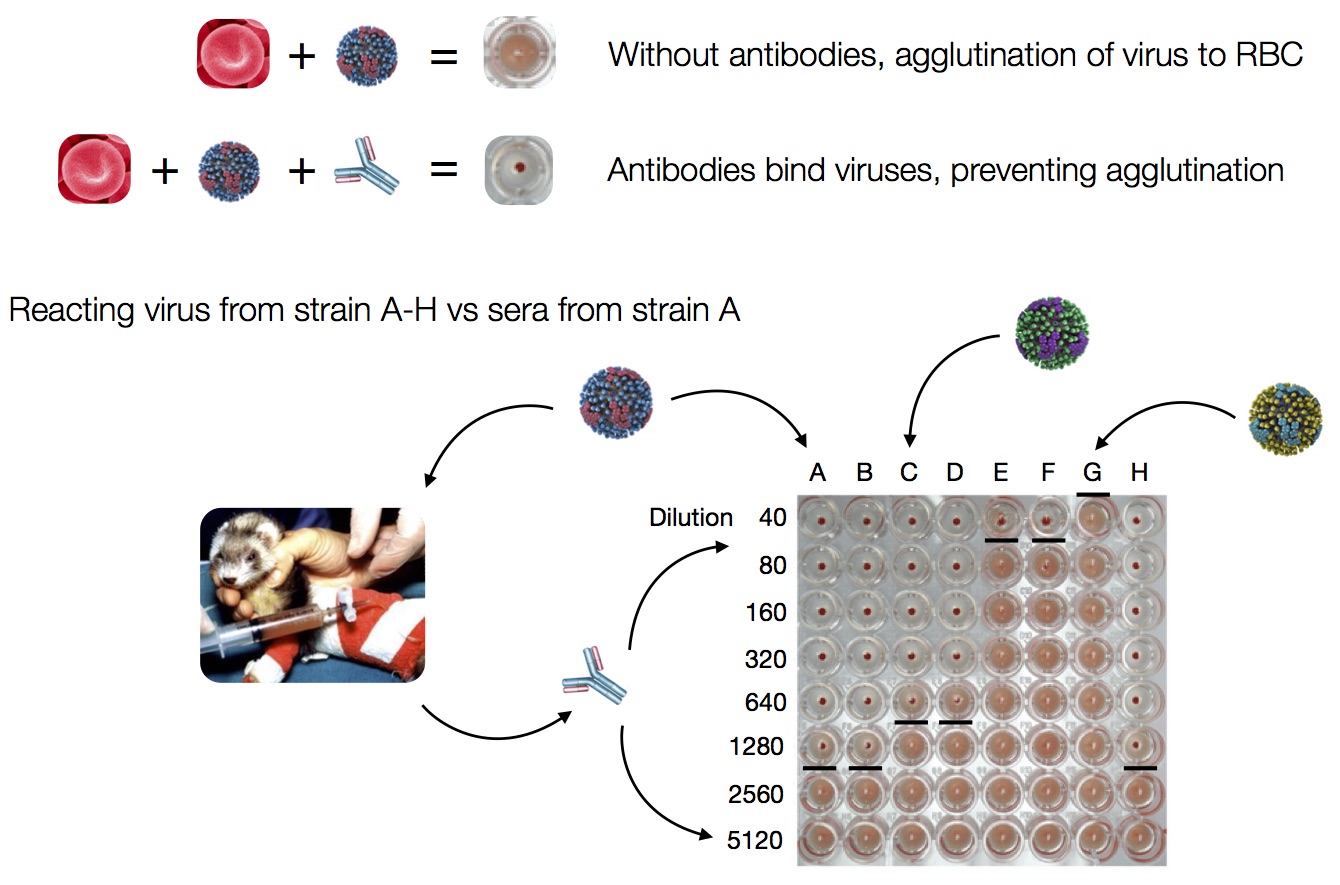
Data in the form of table of maximum inhibitory titers
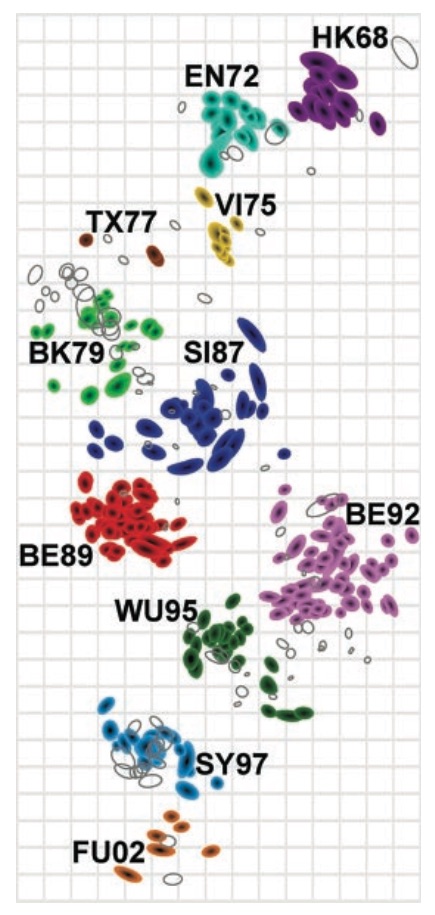
Antigenic cartography compresses HI measurements into an interpretable diagram
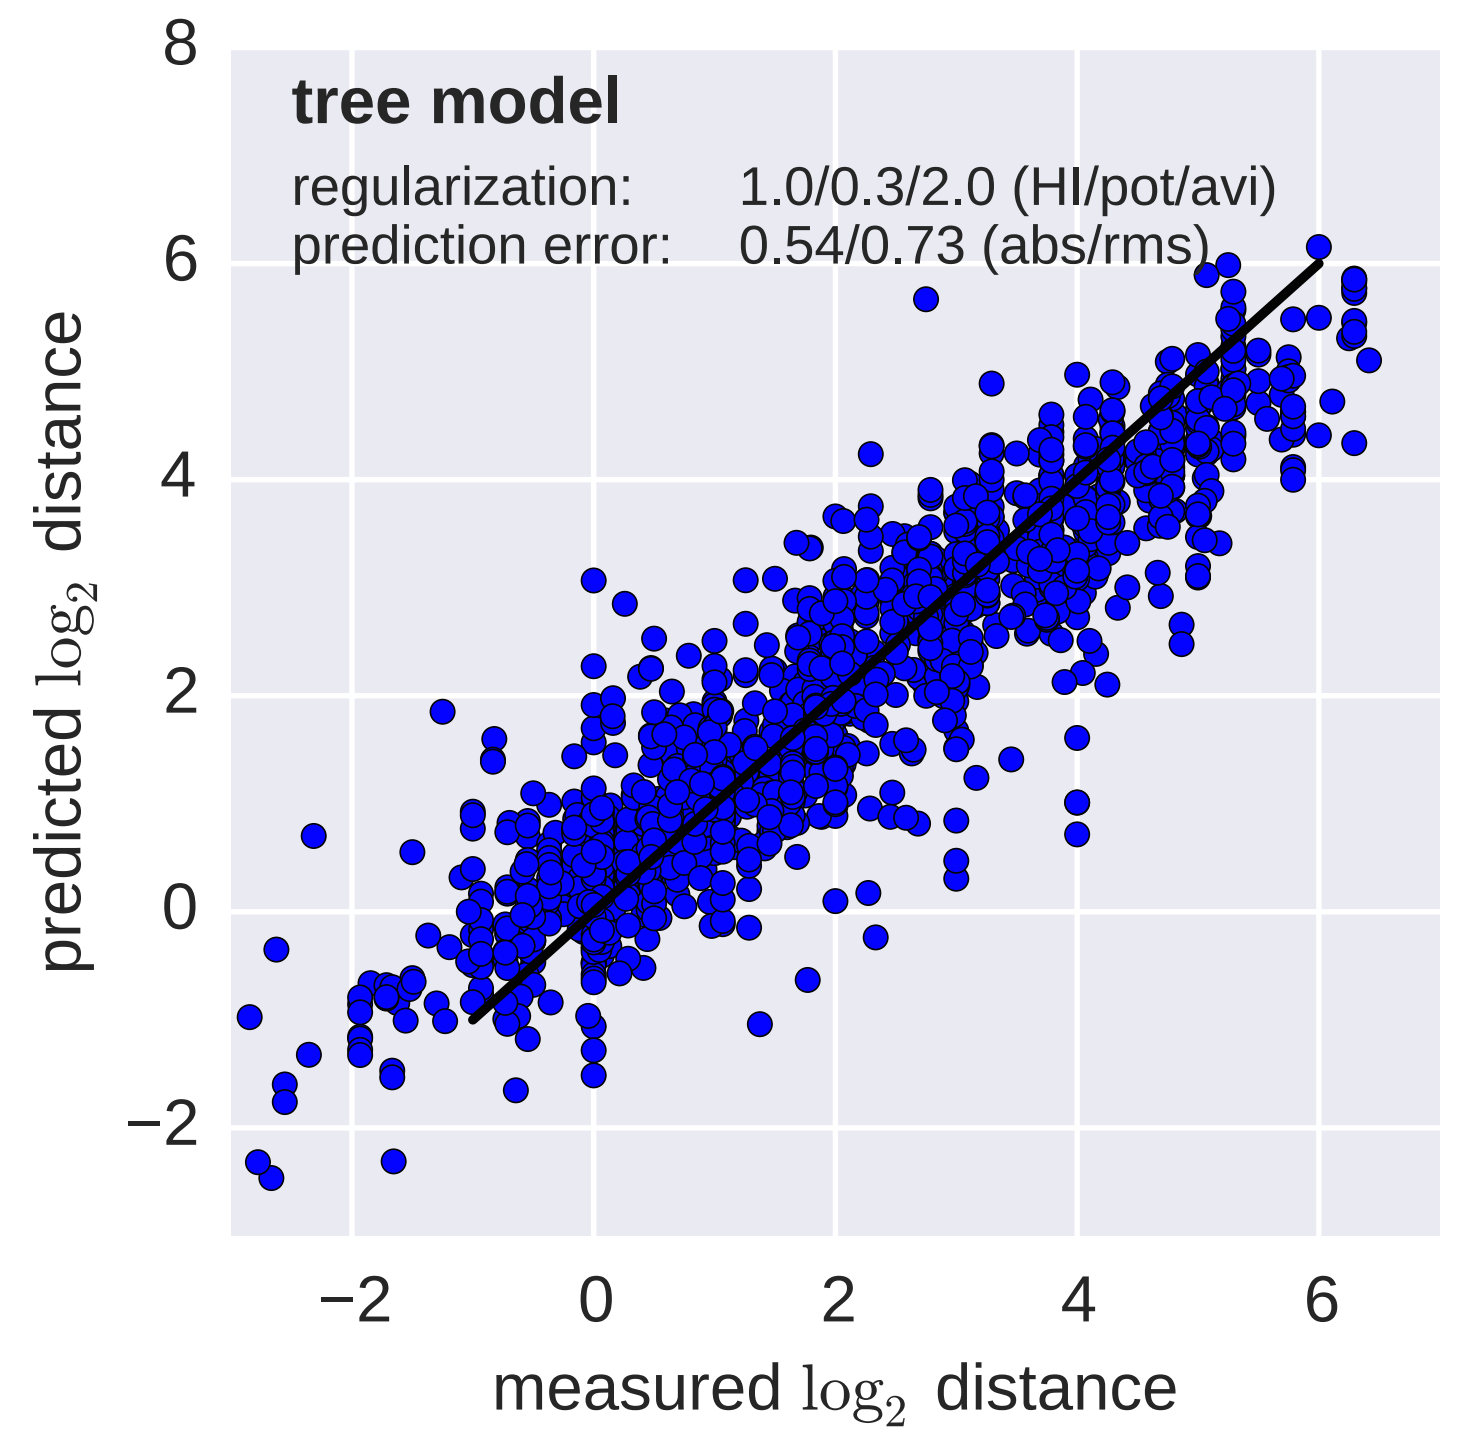
Instead of a geometric model, we sought a phylogenetic model of HI titer data
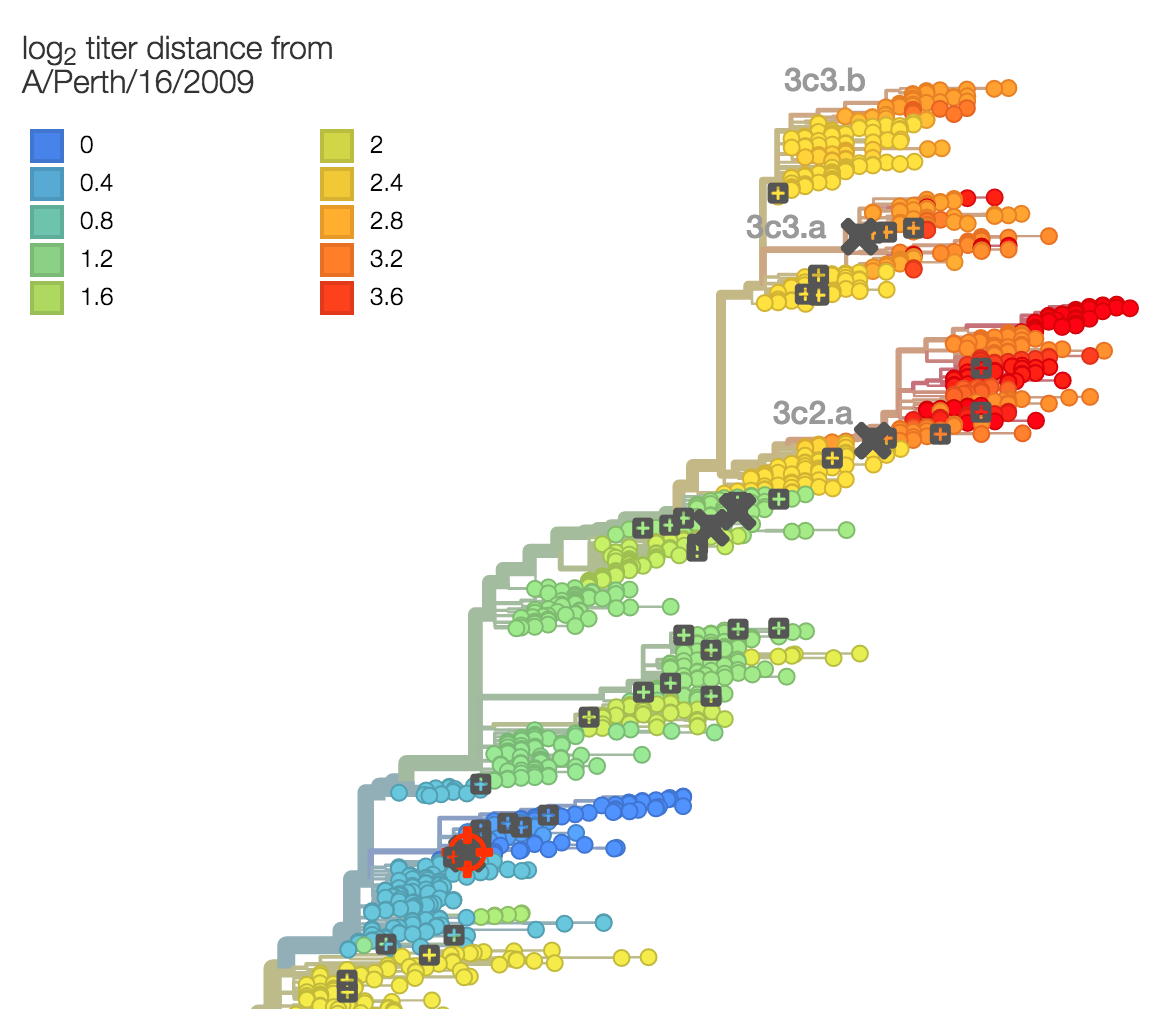
Identify phylogeny branches associated with drops in HI titer
Model can be used to interpolate across tree and predict phenotype of untested viruses
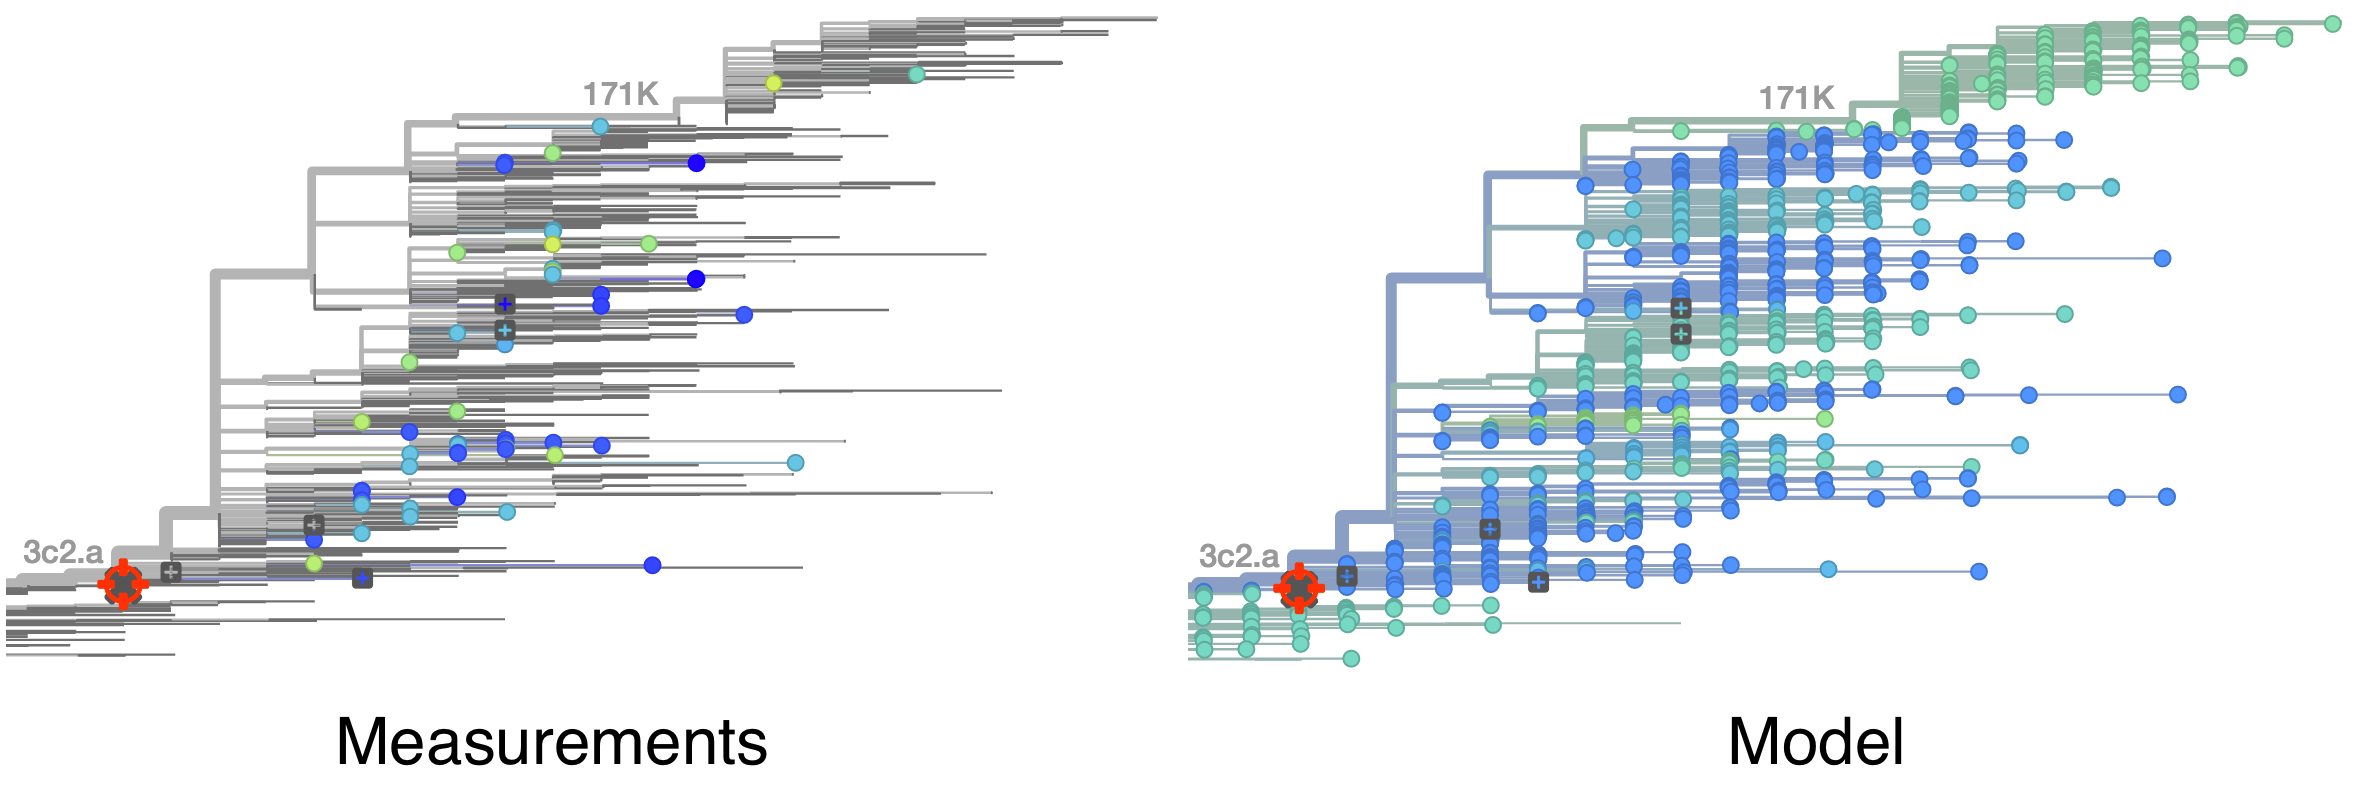
Model is highly predictive of missing titer values
Incorporate HI data from WHO Collaborating Centers
Forecasting
"The future is here, it's just not evenly distributed yet"
— William Gibson
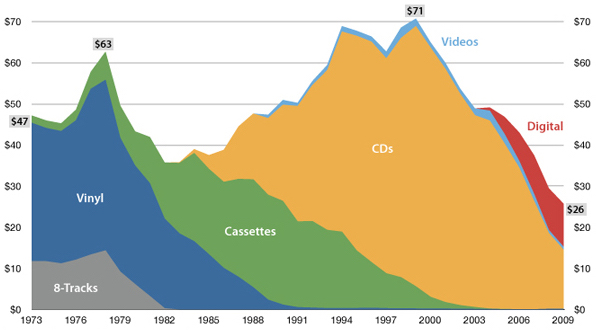
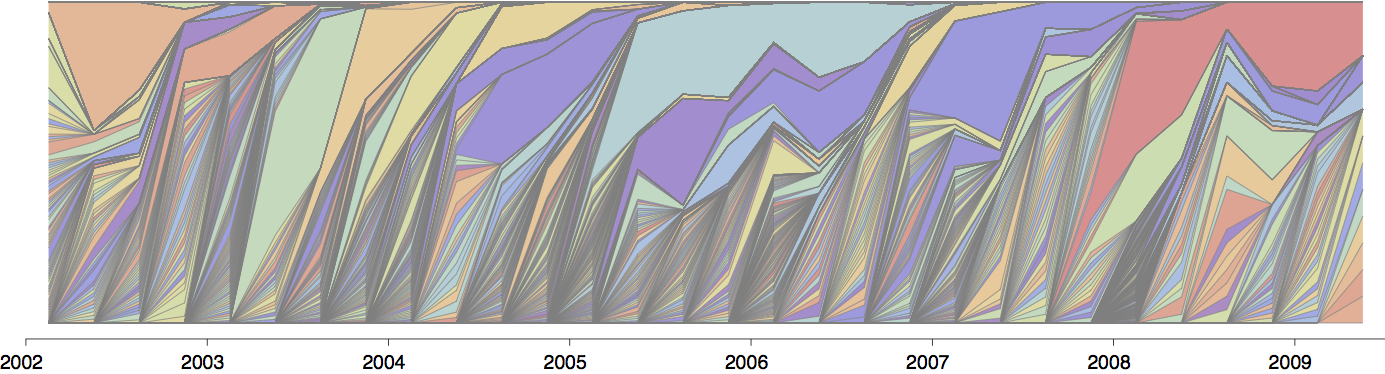
USA music industry, 2011 dollars per capita
Influenza population turnover
Vaccine strain selection timeline
Seek to explain change in clade frequencies over 1 year
Fitness models can project clade frequencies
Clade frequencies $X$ derive from the fitnesses $f$ and frequencies $x$ of constituent viruses, such that
$$\hat{X}_v(t+\Delta t) = \sum_{i:v} x_i(t) \, \mathrm{exp}(f_i \, \Delta t)$$
This captures clonal interference between competing lineages
The question of forecasting becomes: how do we accurately estimate fitnesses of circulating viruses?
Fortunately, there's lots of training data and previously successful strains have had:
- Amino acid changes at epitope sites
- Antigenic novelty based on HI
- Rapid phylogenetic growth
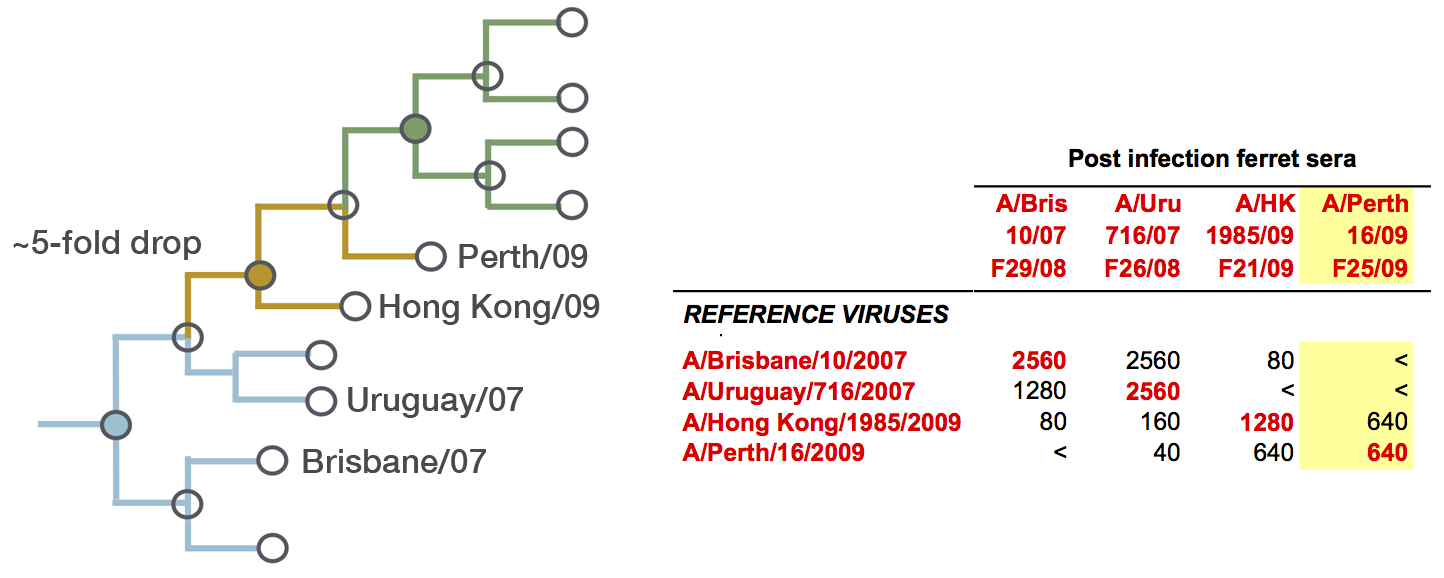
Predictor: calculate HI drop from ancestor,
drifted clades have high fitness
Predictor: project frequencies forward,
growing clades have high fitness
We predict fitness based on a simple formula
where the fitness $f$ of virus $i$ is estimated as
$$\hat{f}_i = \beta^\mathrm{HI} \, f_i^\mathrm{HI} + \beta^\mathrm{freq} \, f_i^\mathrm{freq}$$
where $f_i^\mathrm{HI}$ measures antigenic drift via HI and $f_i^\mathrm{freq}$ measures clade growth/decline
We learn coefficients and validate model based on previous 15 H3N2 seasons
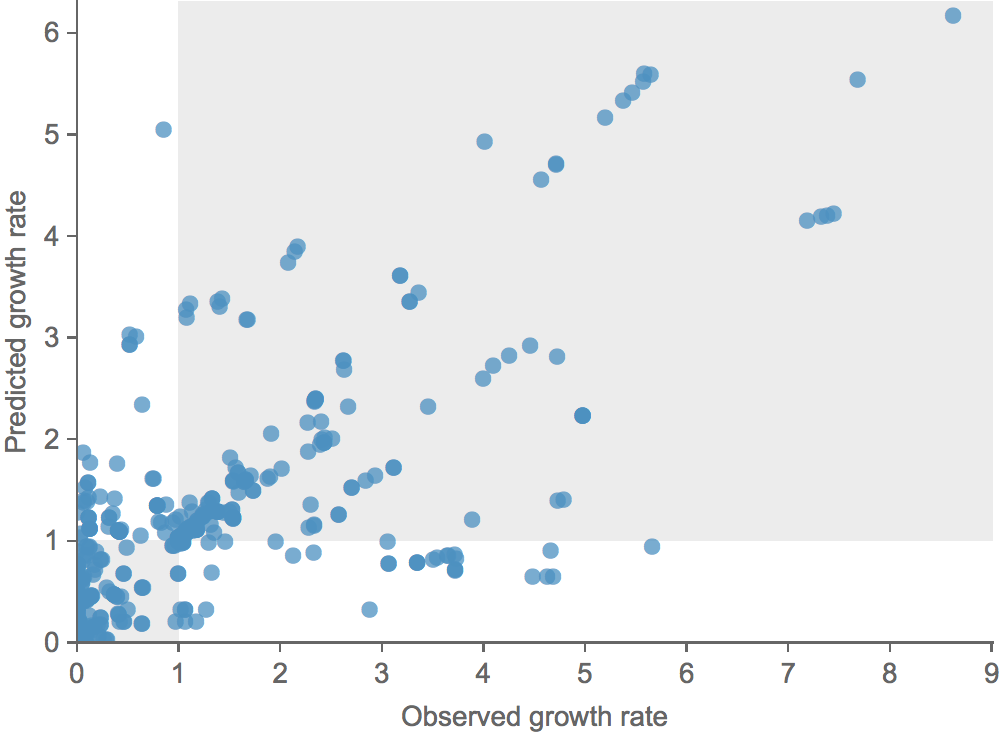
Clade growth rate is well predicted (ρ = 0.66)
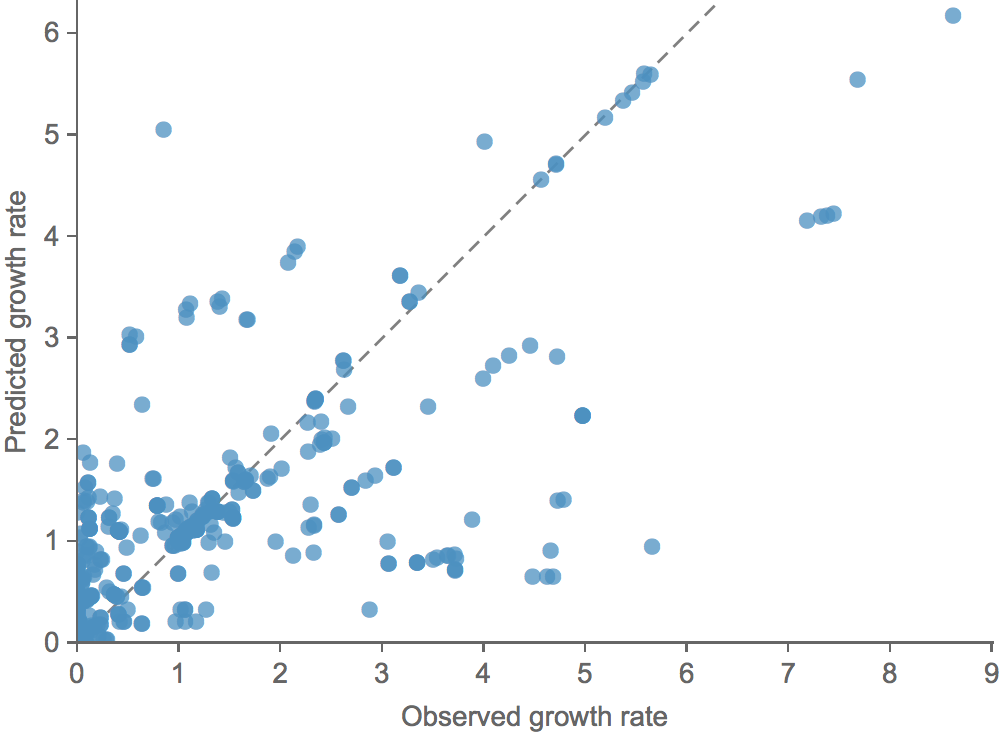
Growth vs decline correct in 84% of cases
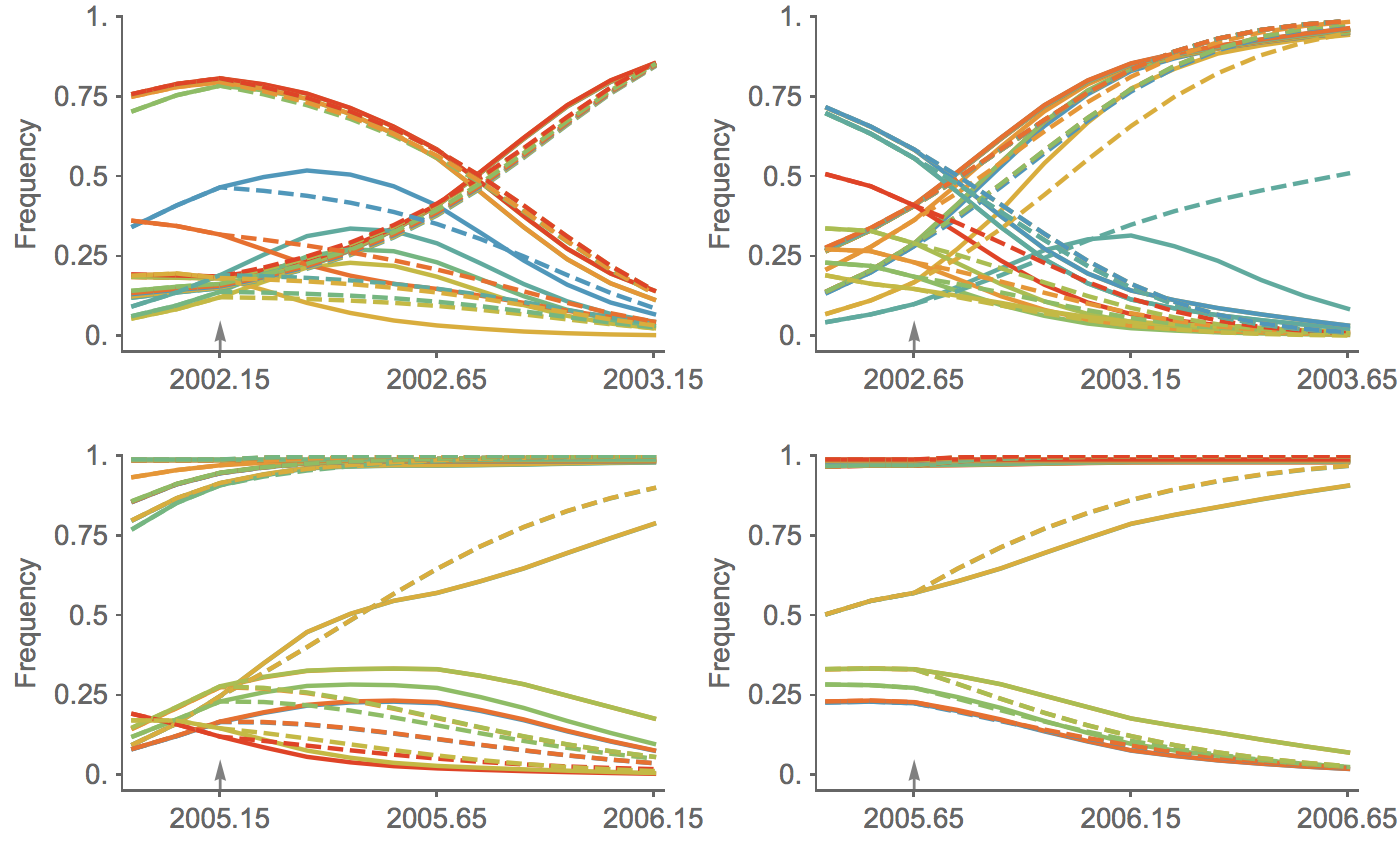
Trajectories show more detailed congruence
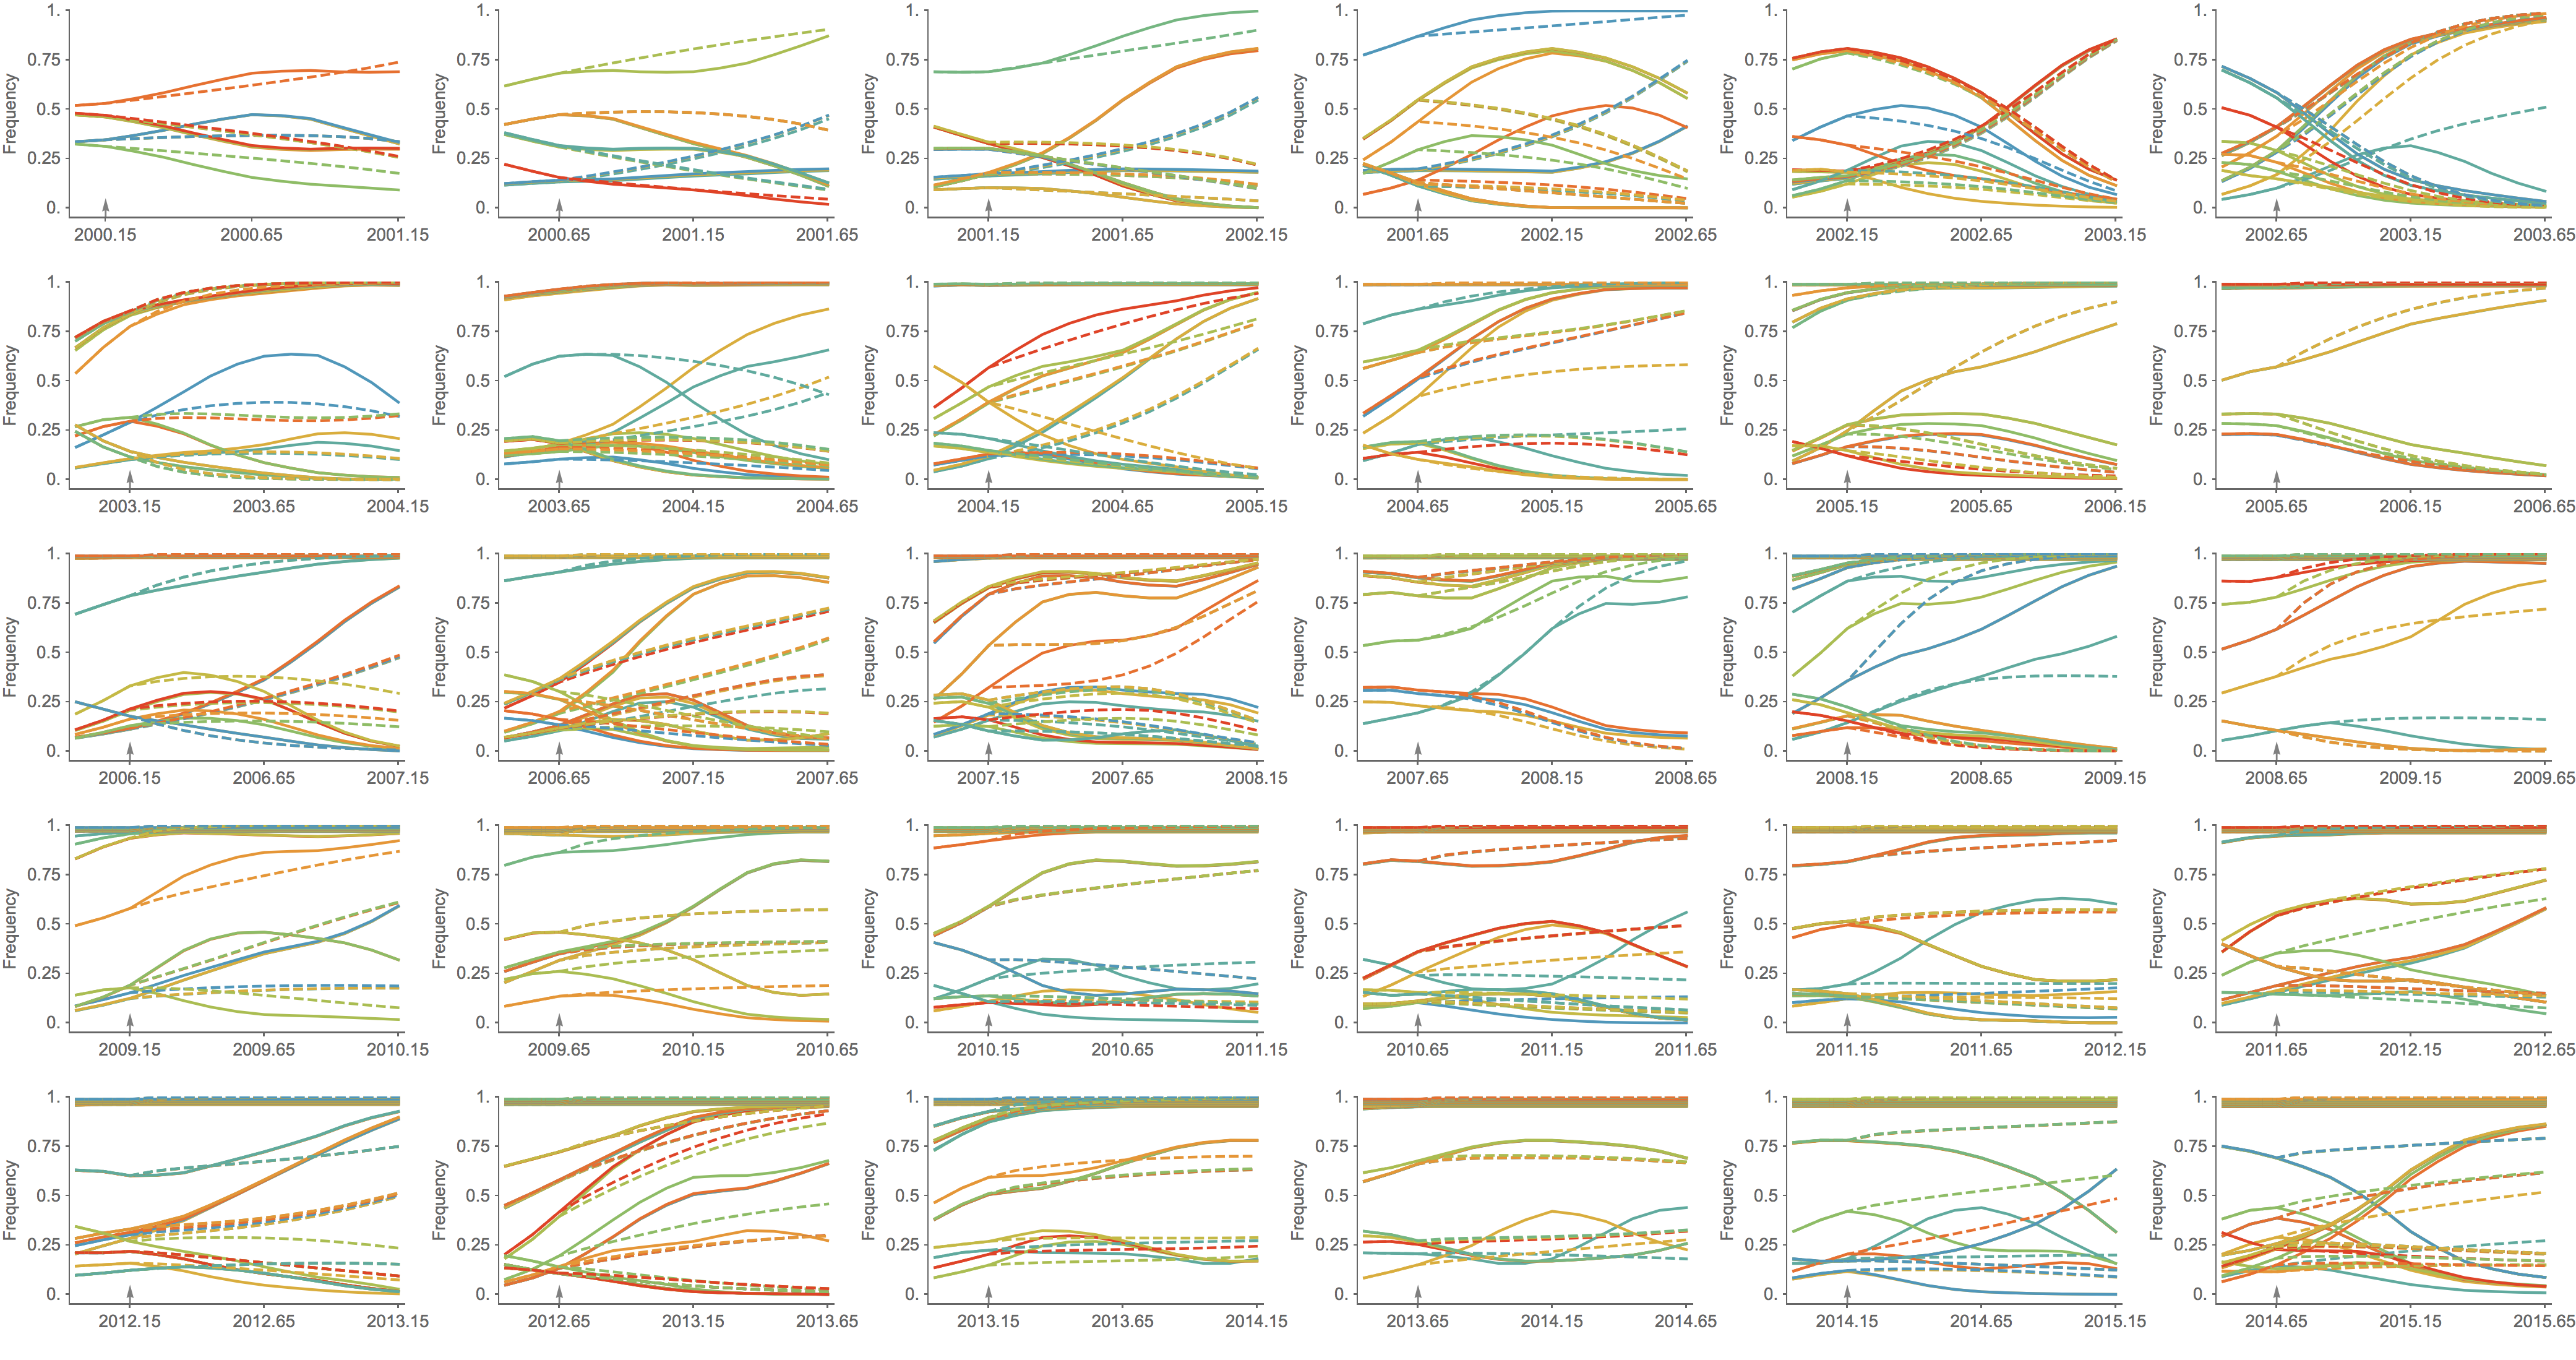
Trajectories show more detailed congruence
Unlikely to replace human intuition, but could automate serum and VCV selection
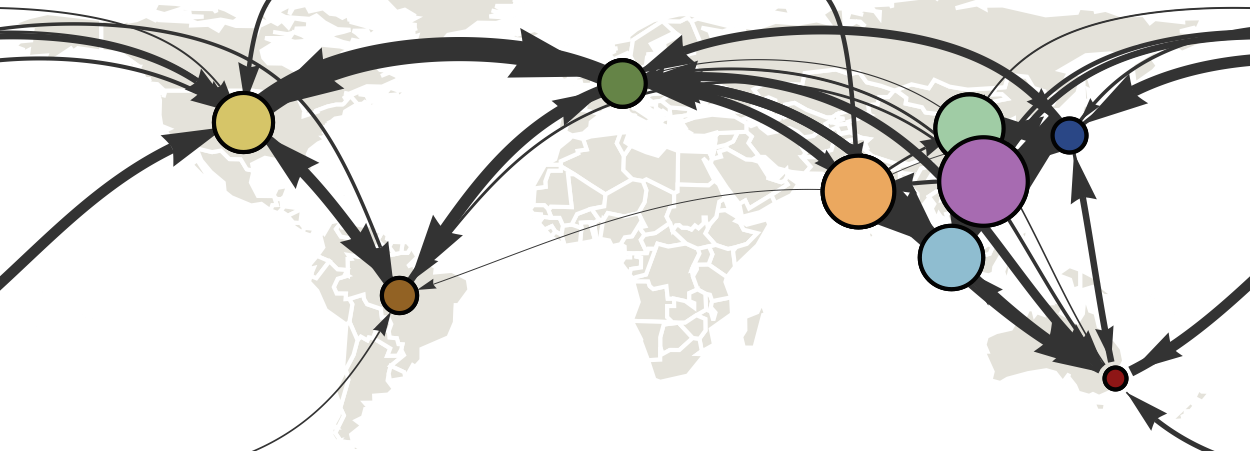
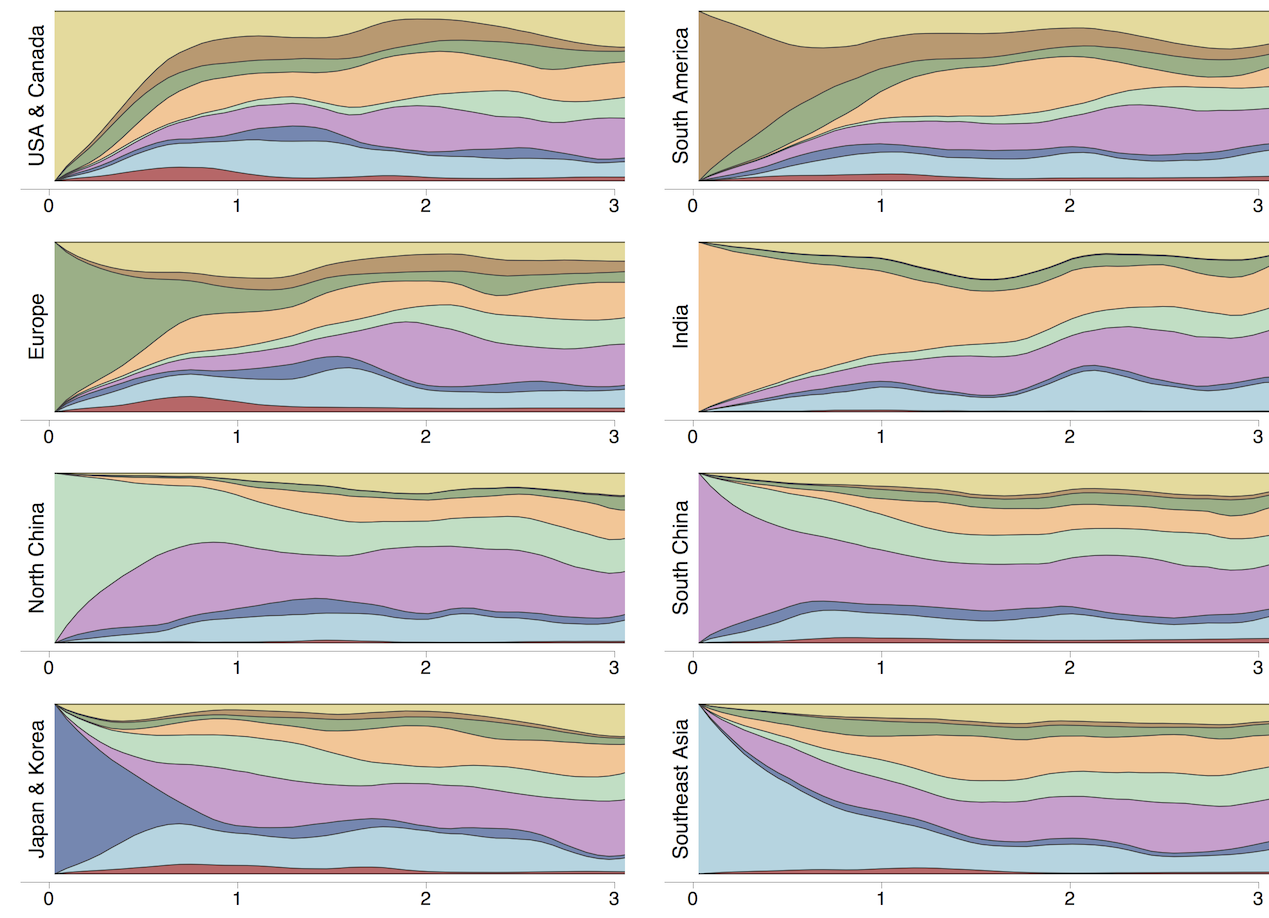
Geographic circulation
Geographic circulation patterns drive evolutionary outcomes
Clades commonly show region-specific circulation patterns
Phylogeny of H3 with geographic history
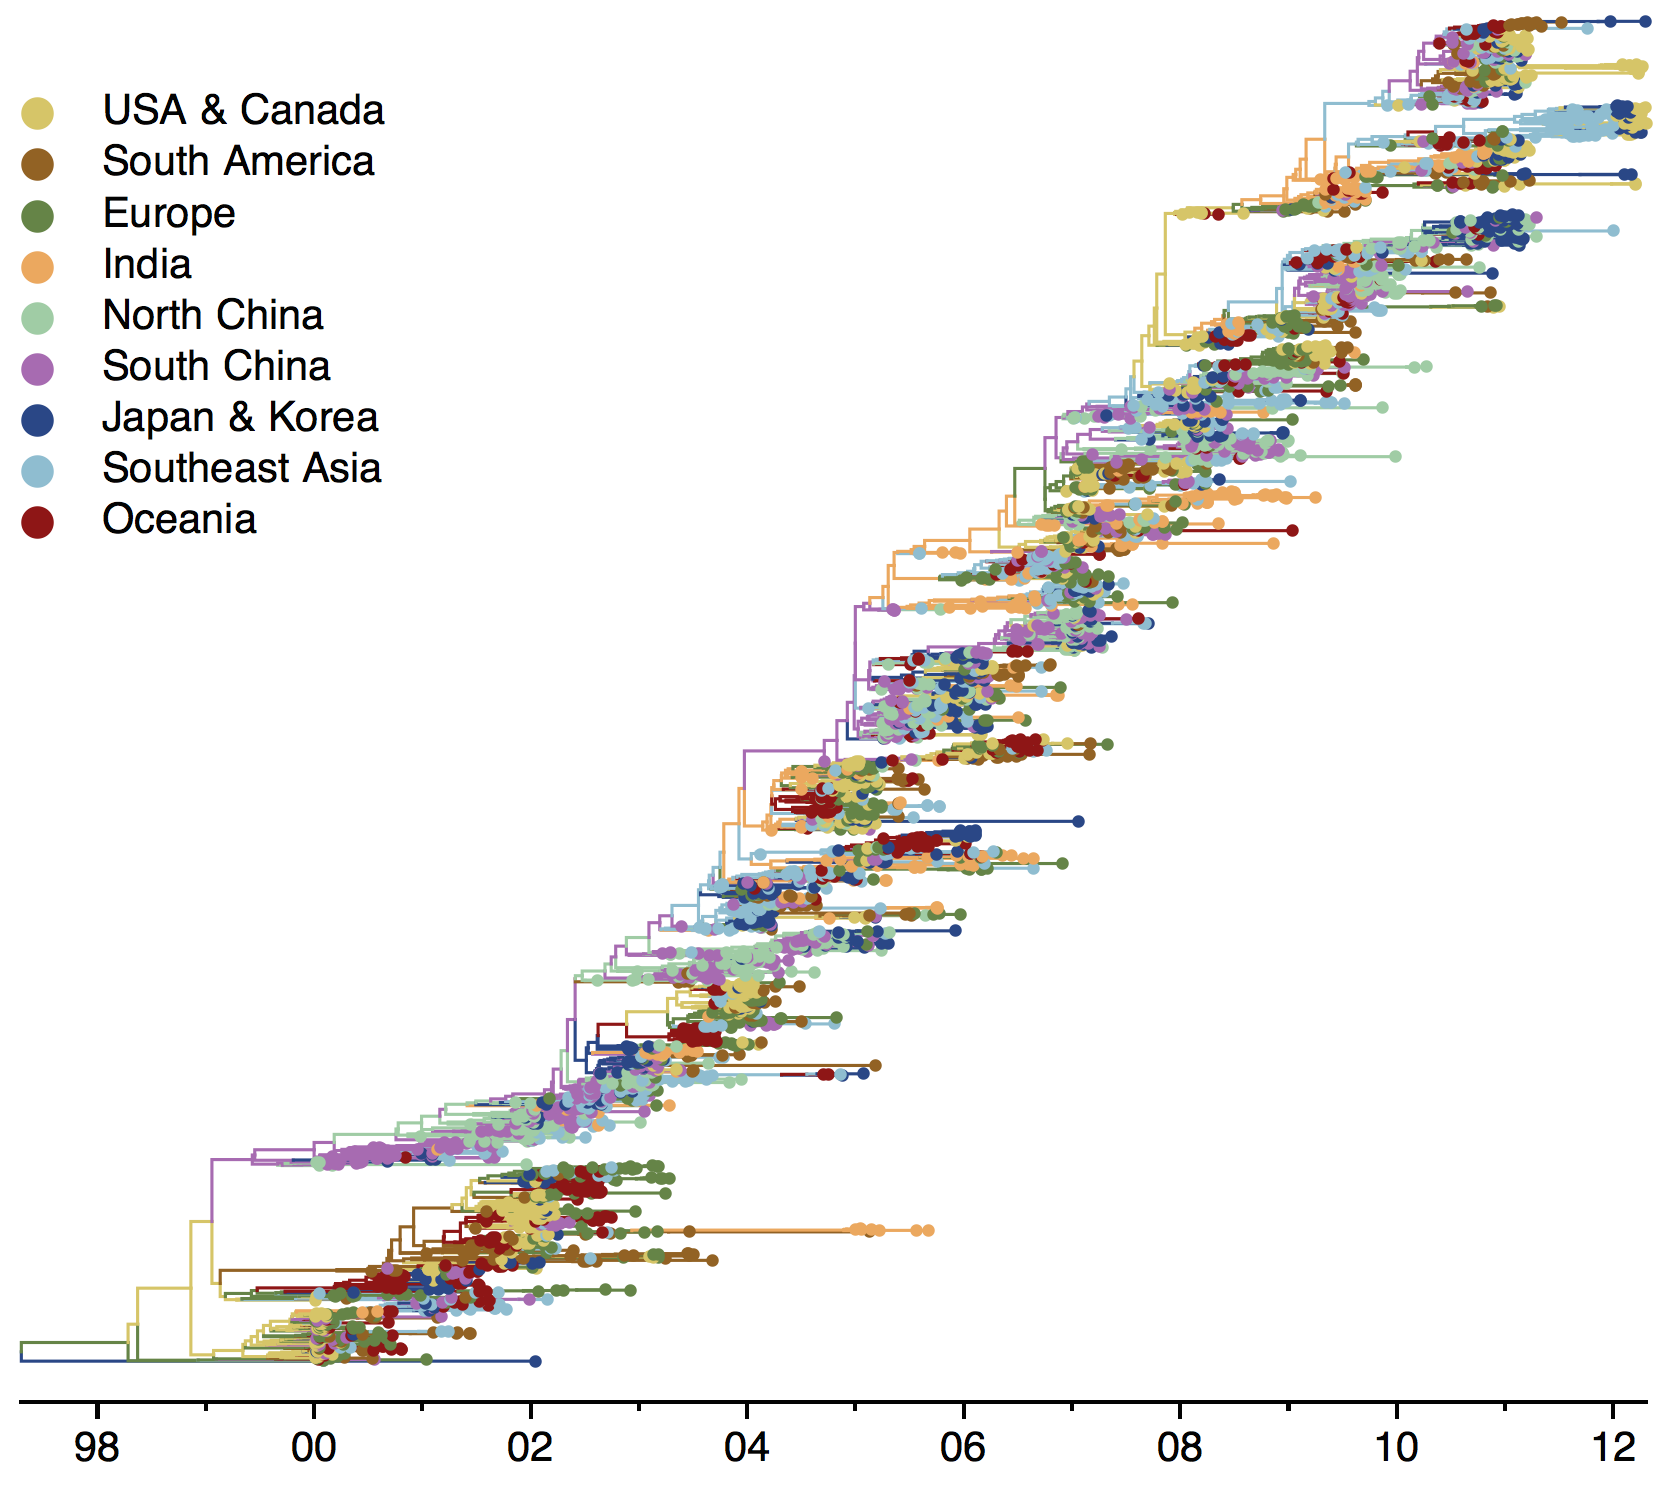
Infer geographic transition matrix
Geographic location of phylogeny trunk
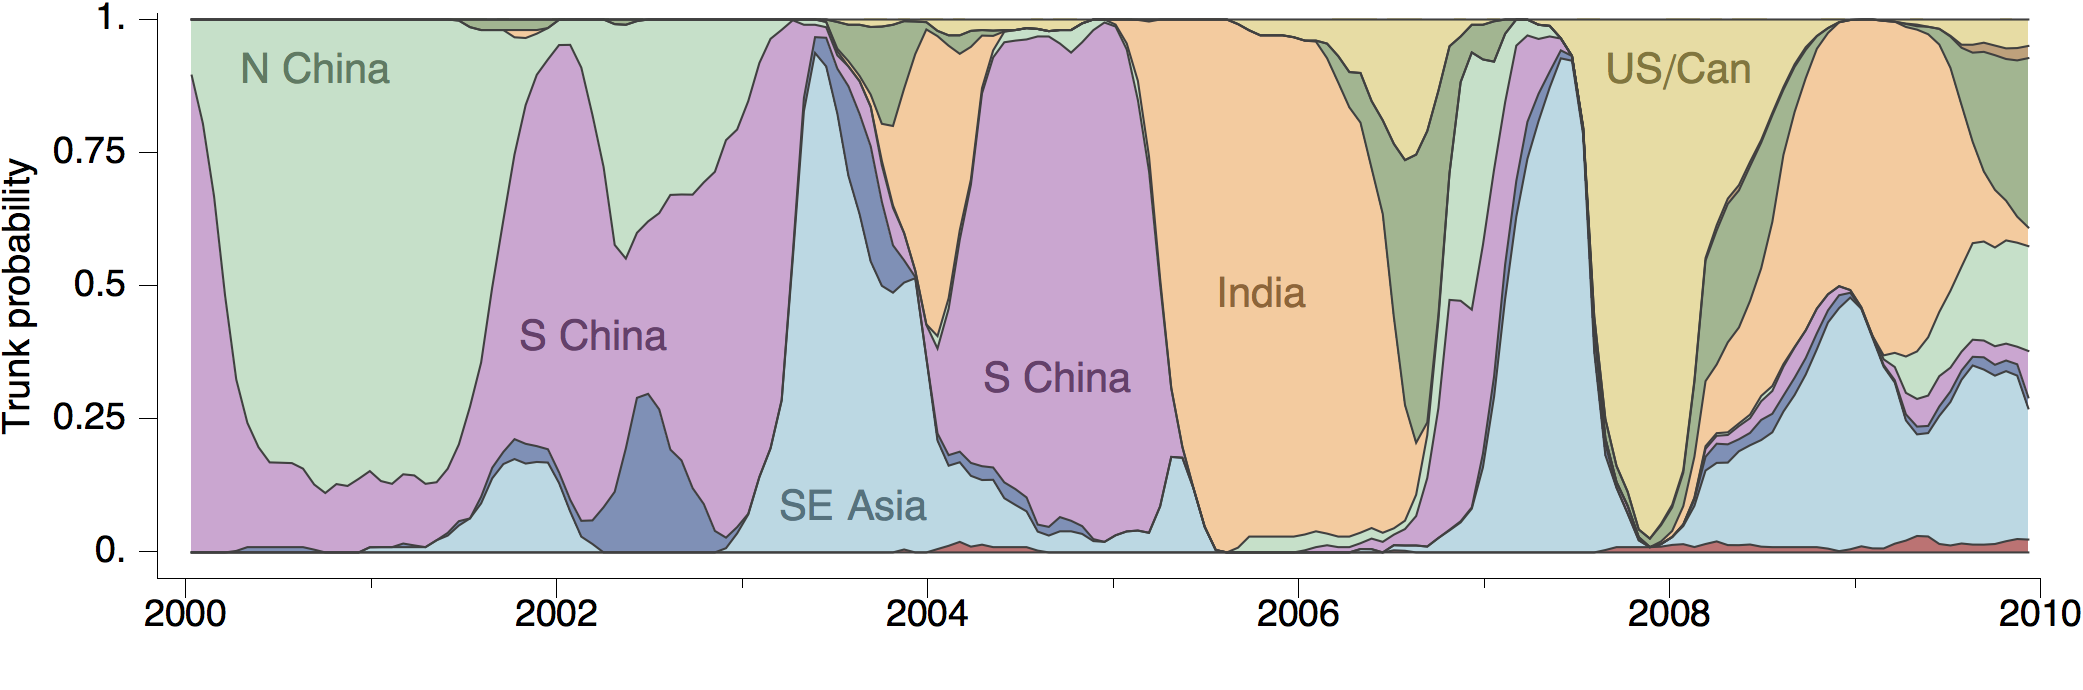
Region-specific ancestry
Which regions are best predictive of future outcomes?
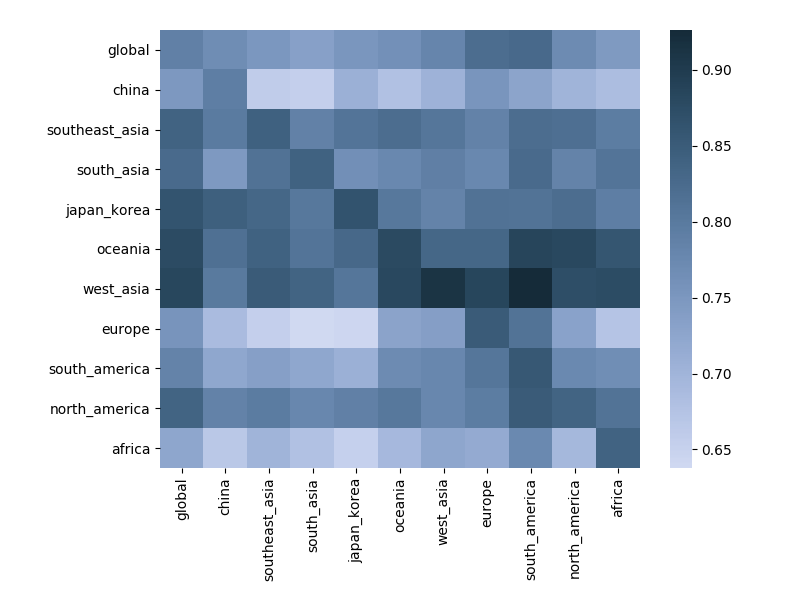
Correlation between clade frequencies
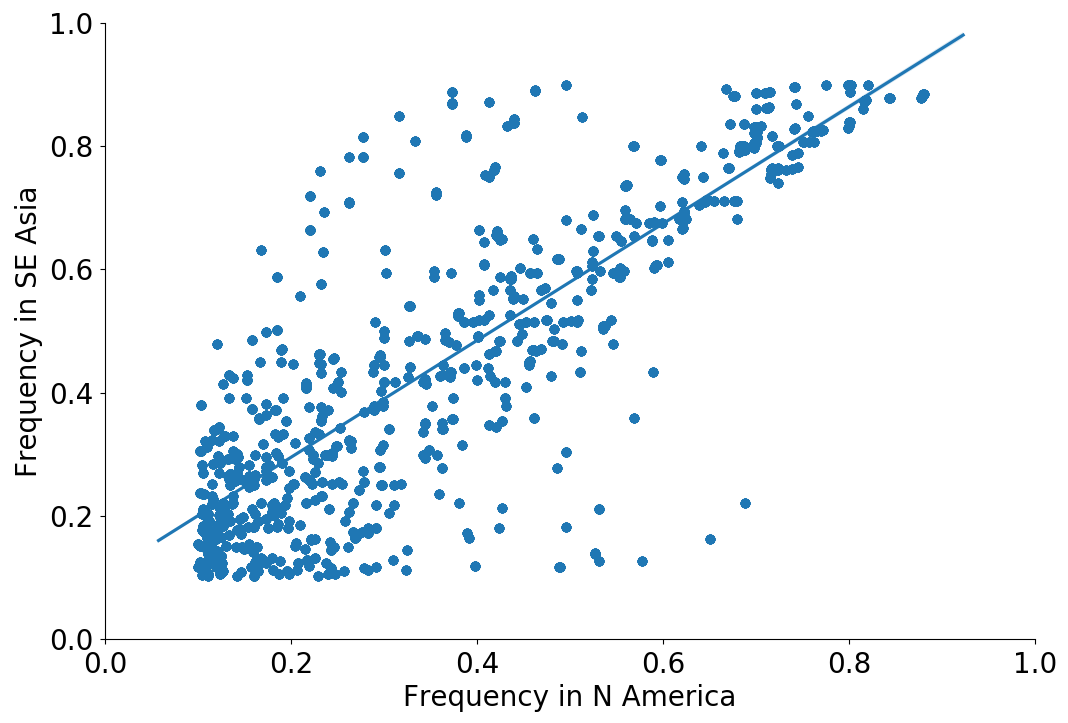
Correlations across regions
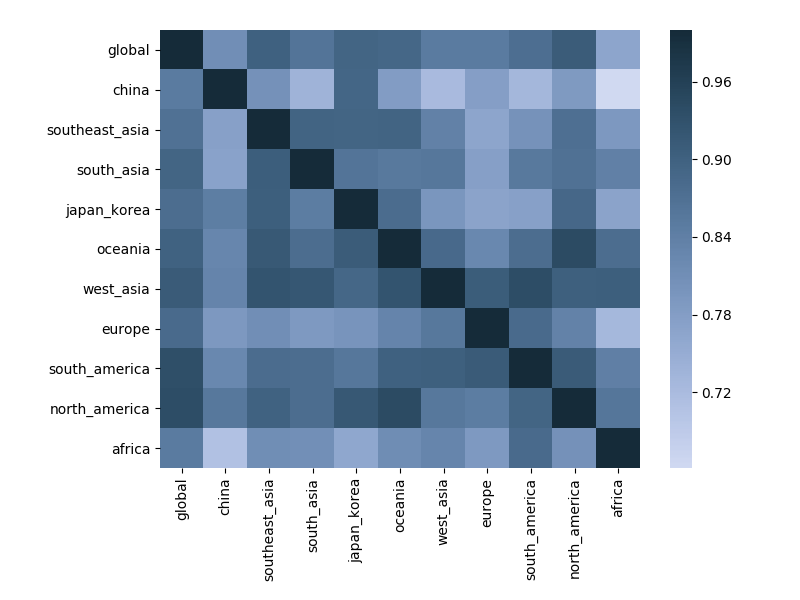
Correlations across regions with 6-month lag
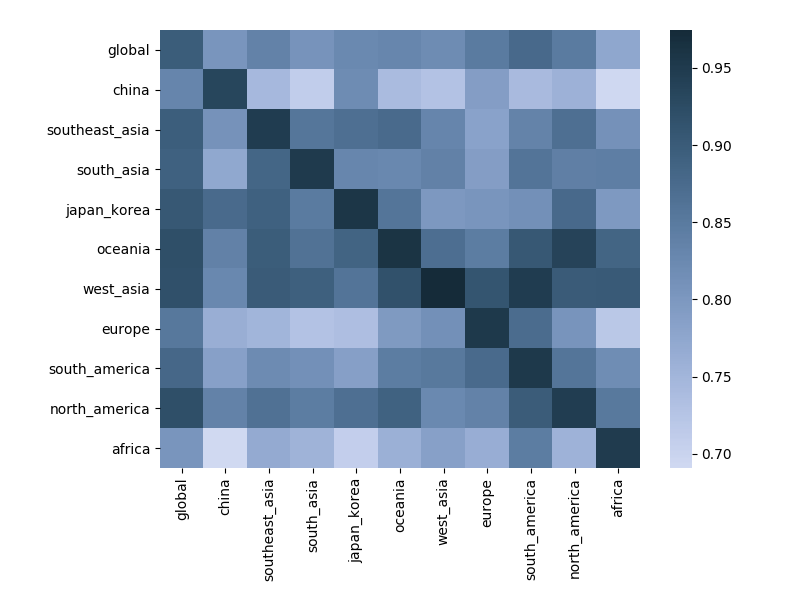
Correlations across regions with 12-month lag
Goal is to include migration forcings in predictive fitness model
Part of larger efforts for real-time phylogenetics
nextstrain.org
Acknowledgements
Bedford Lab:
 Alli Black,
 Sidney Bell,
 Gytis Dudas,
 John Huddleston,
 Barney Potter,
 James Hadfield,
 Louise Moncla
Influenza: WHO Global Influenza Surveillance Network, GISAID, Richard Neher, Barney Potter, John Huddleston, James Hadfield, Colin Russell, Andrew Rambaut, Dave Wentworth, Becky Garten, Jackie Katz, Marta Łuksza, Michael Lässig, Richard Reeve
Nextstrain: Richard Neher, James Hadfield, Colin Megill, Sidney Bell, Charlton Callender, Barney Potter, John Huddleston, Emma Hodcroft