Understanding strain competition mediated by immunity in influenza virus
Trevor Bedford (@trvrb)
10 Aug 2017
Ecological Society of America Annual Meeting
Portland, OR
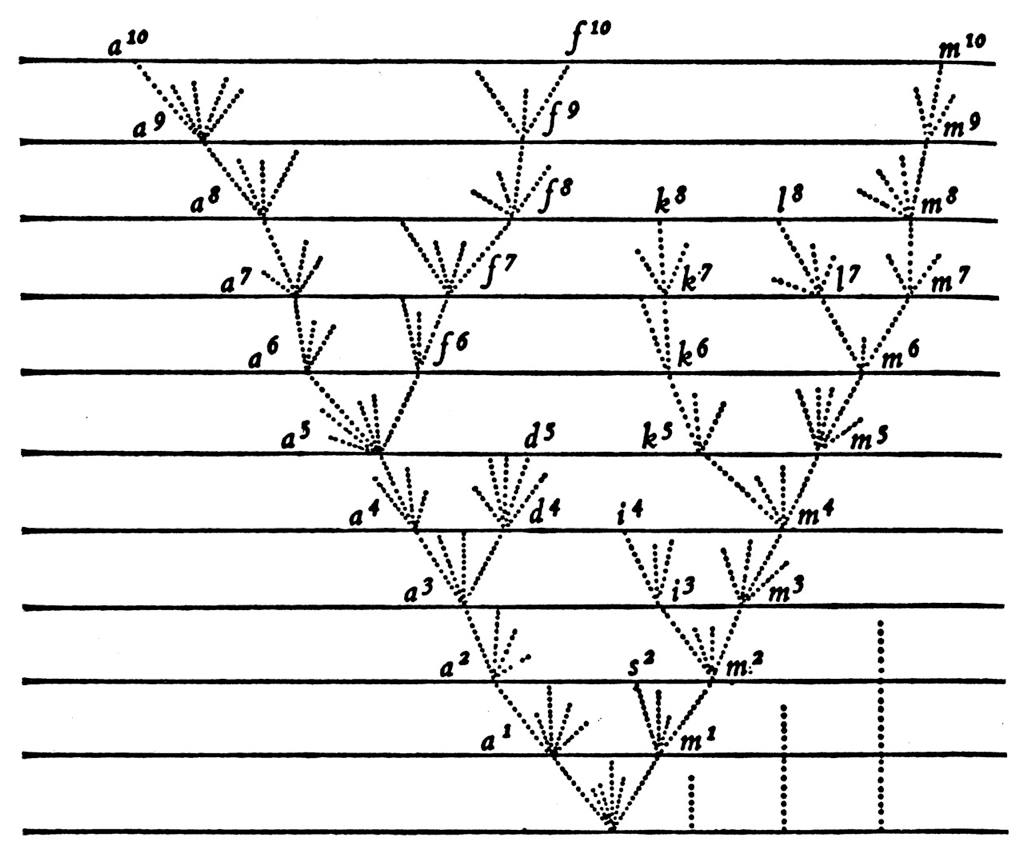
Darwin. 1859.
Influenza
Influenza virus

Flu pandemics caused by host switch events
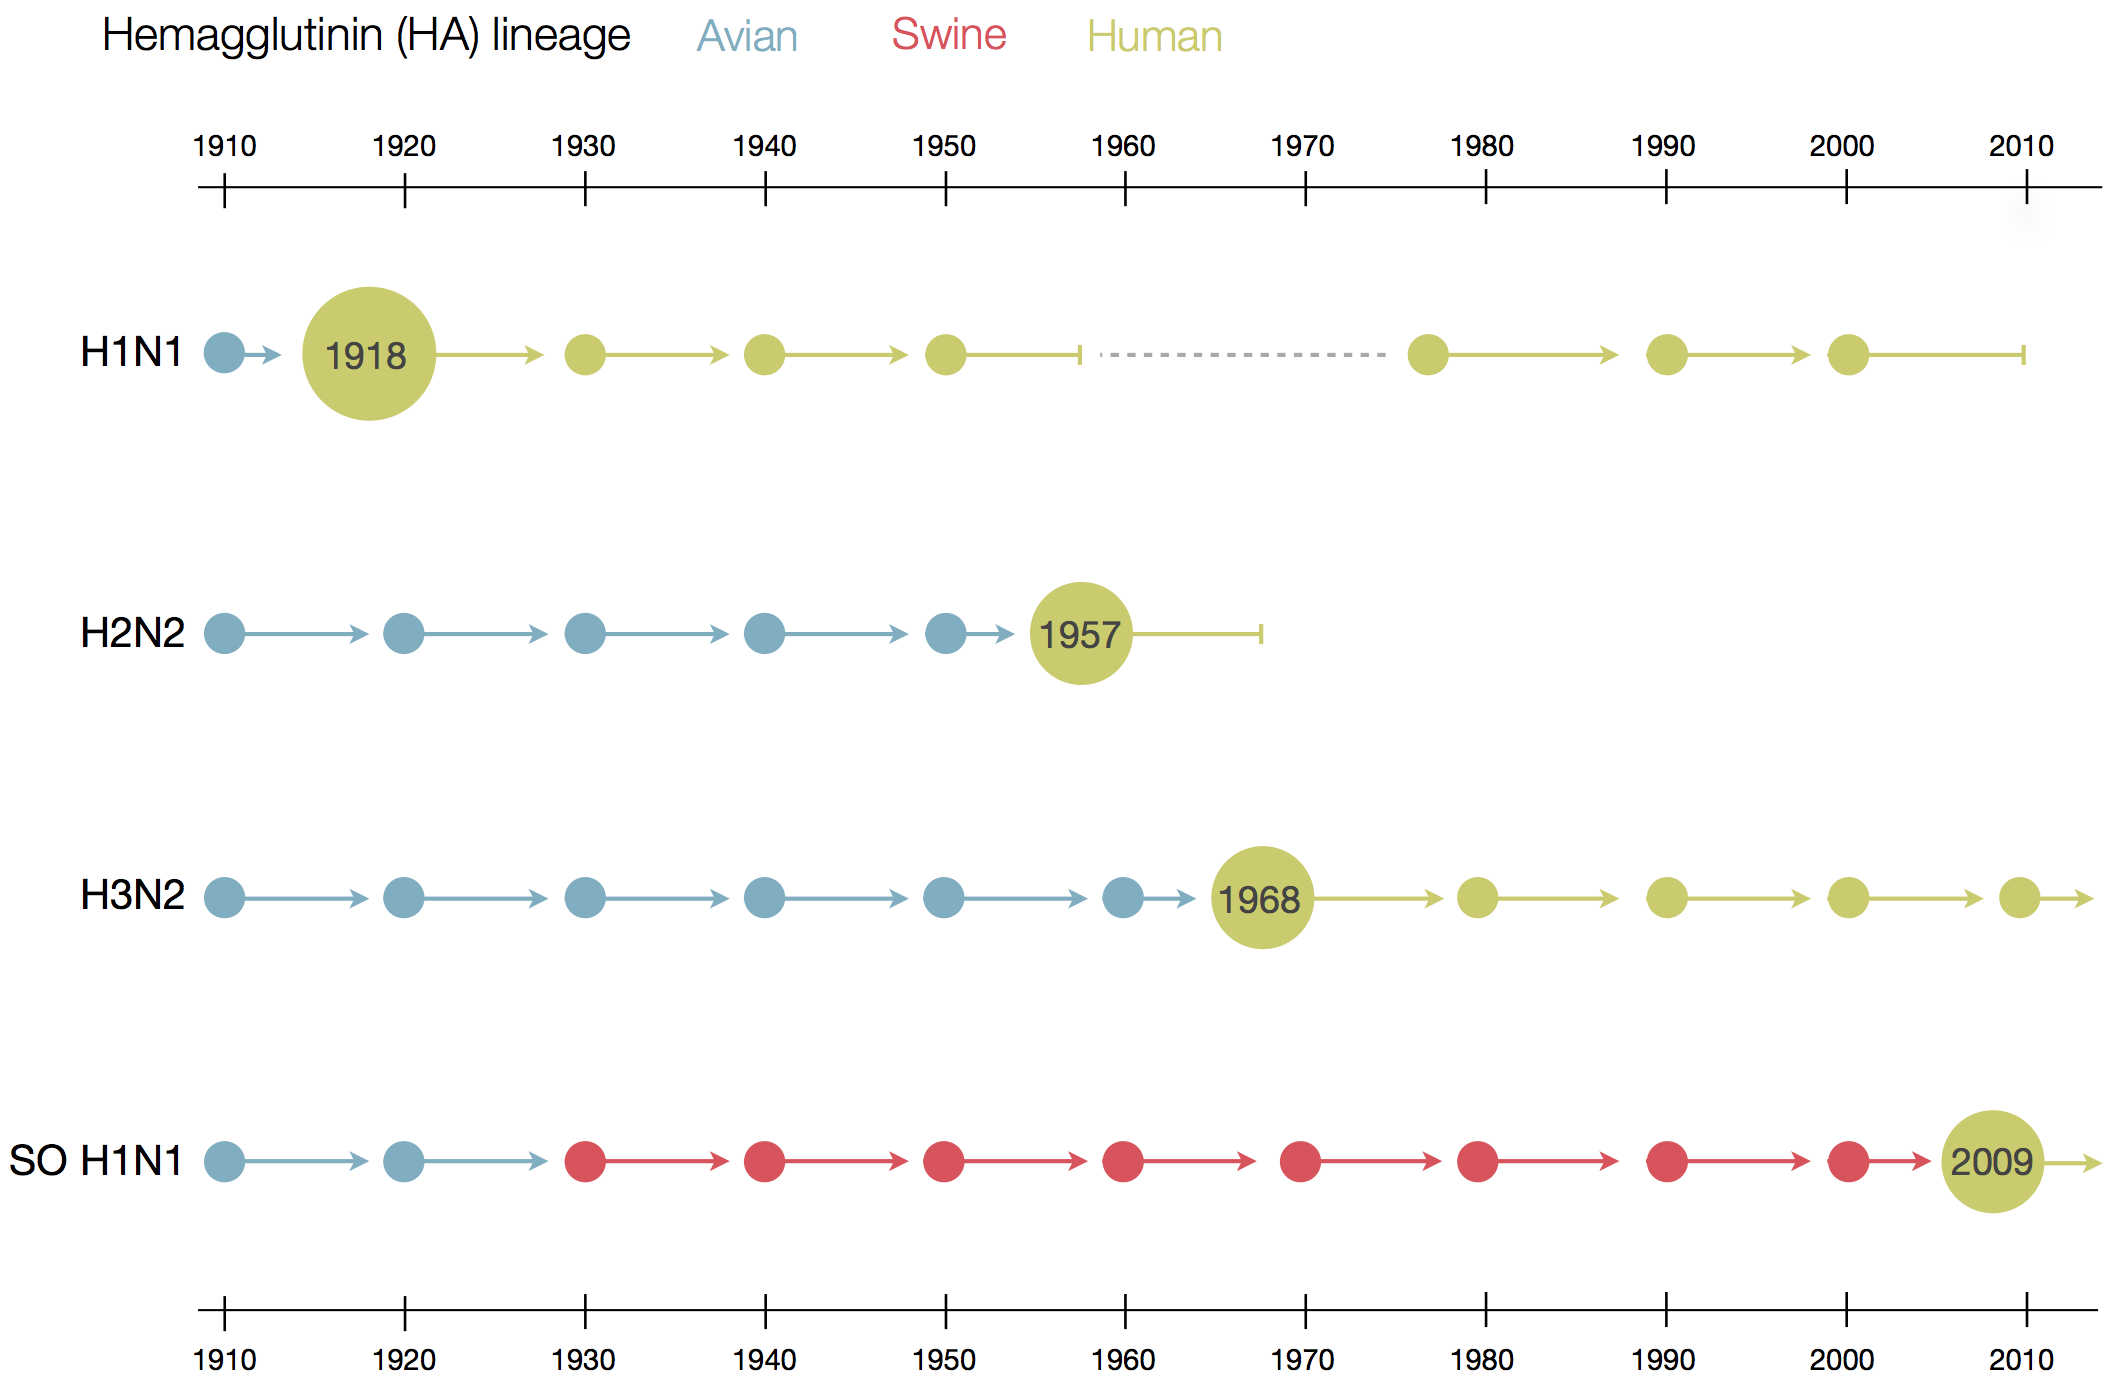
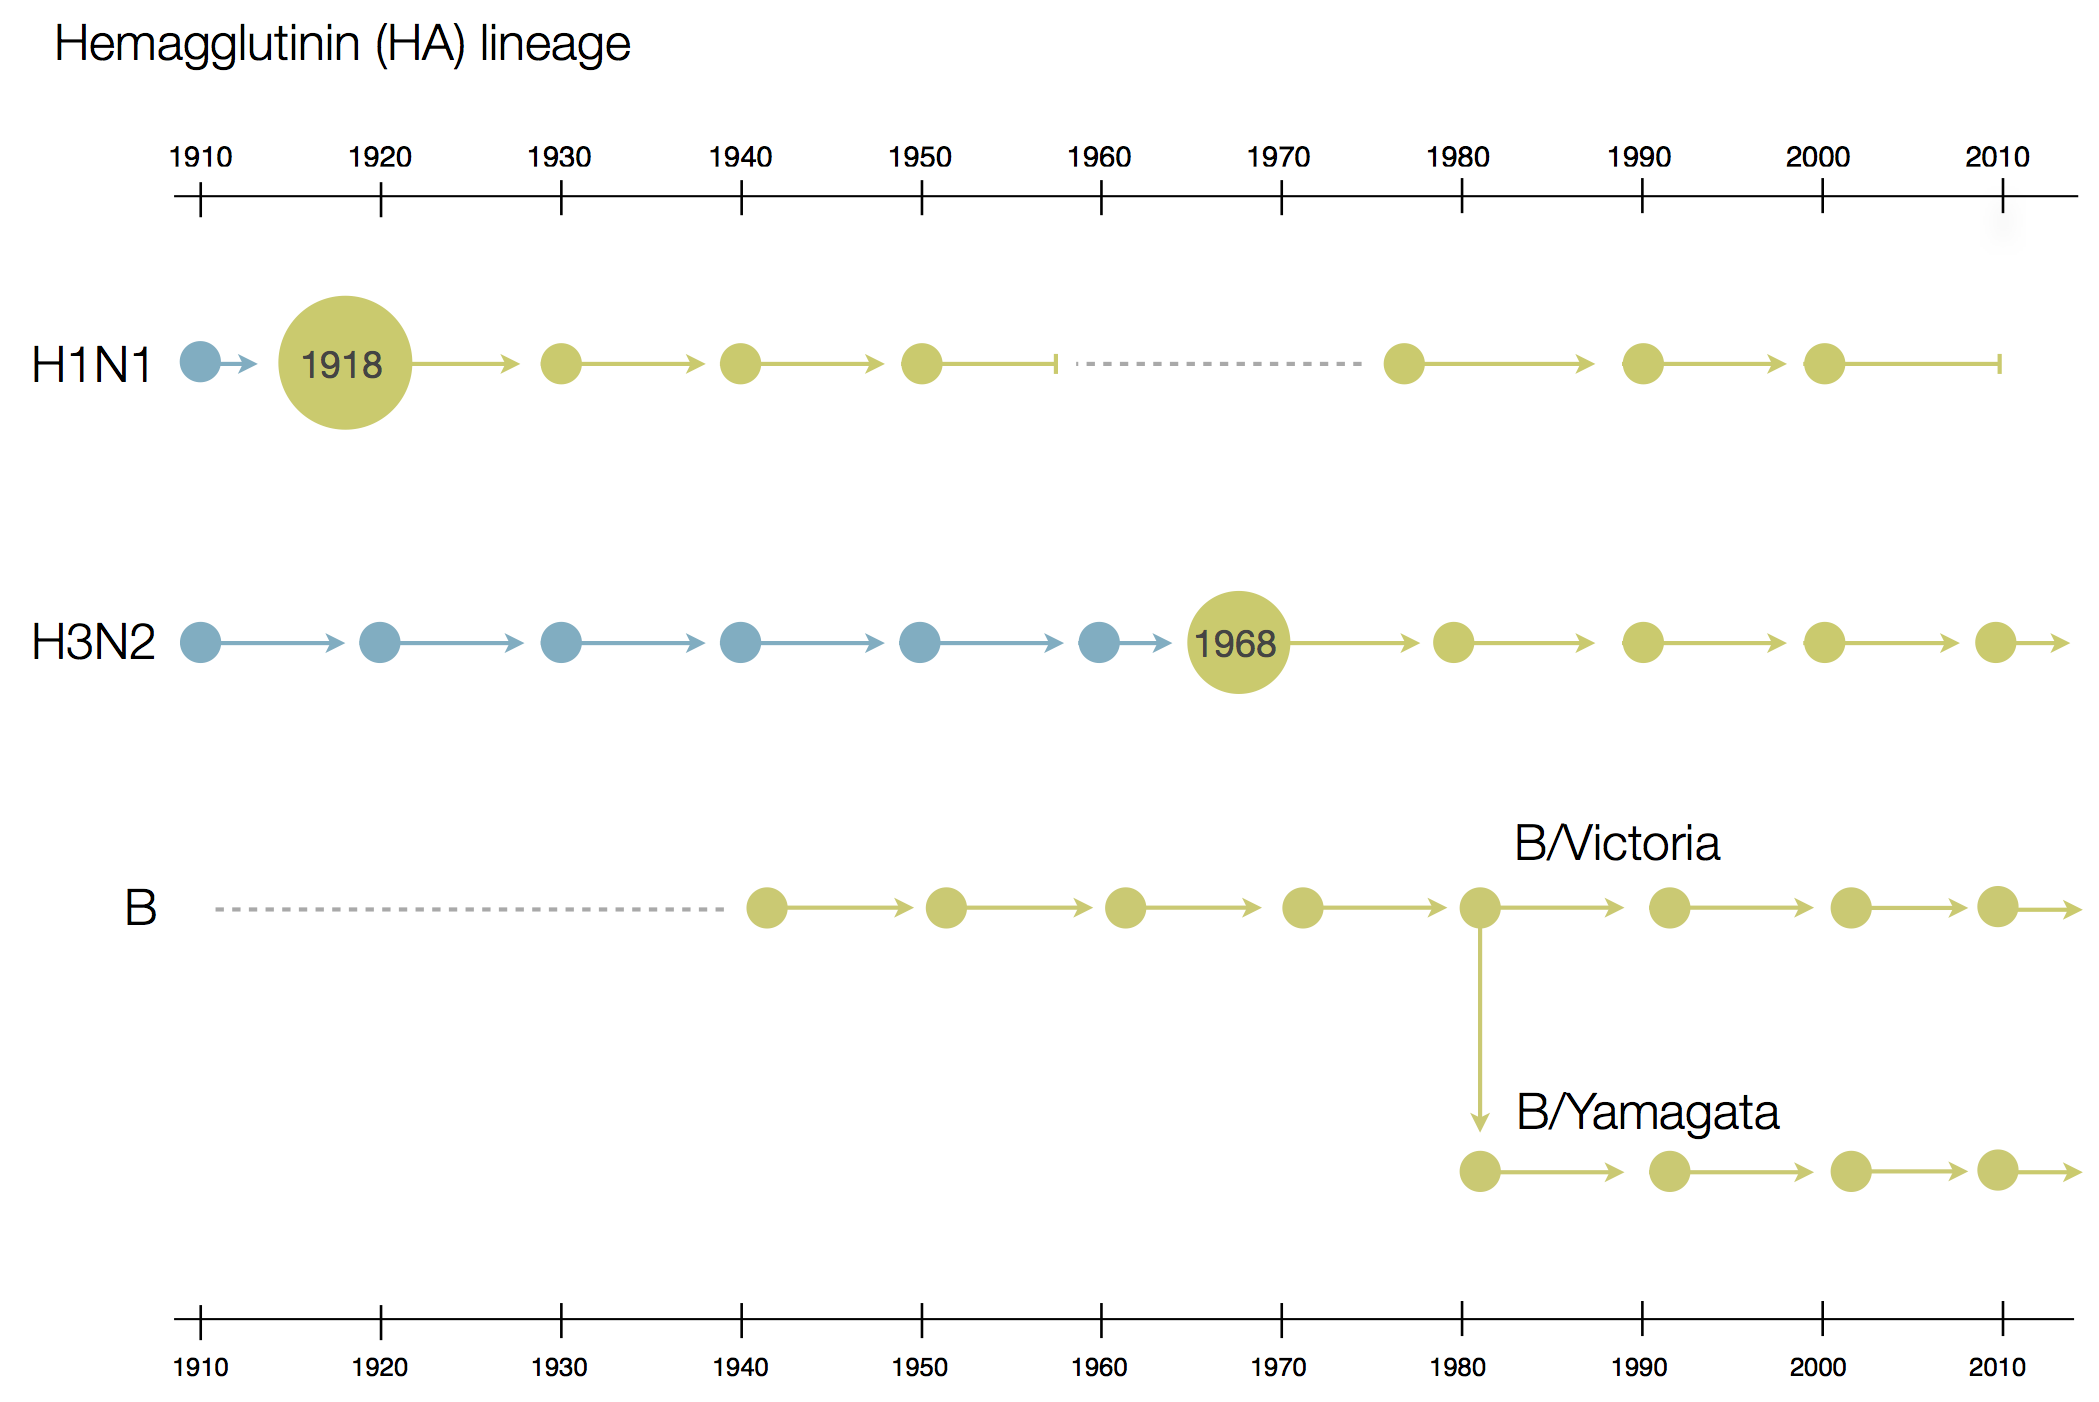
Influenza B does not have pandemic potential
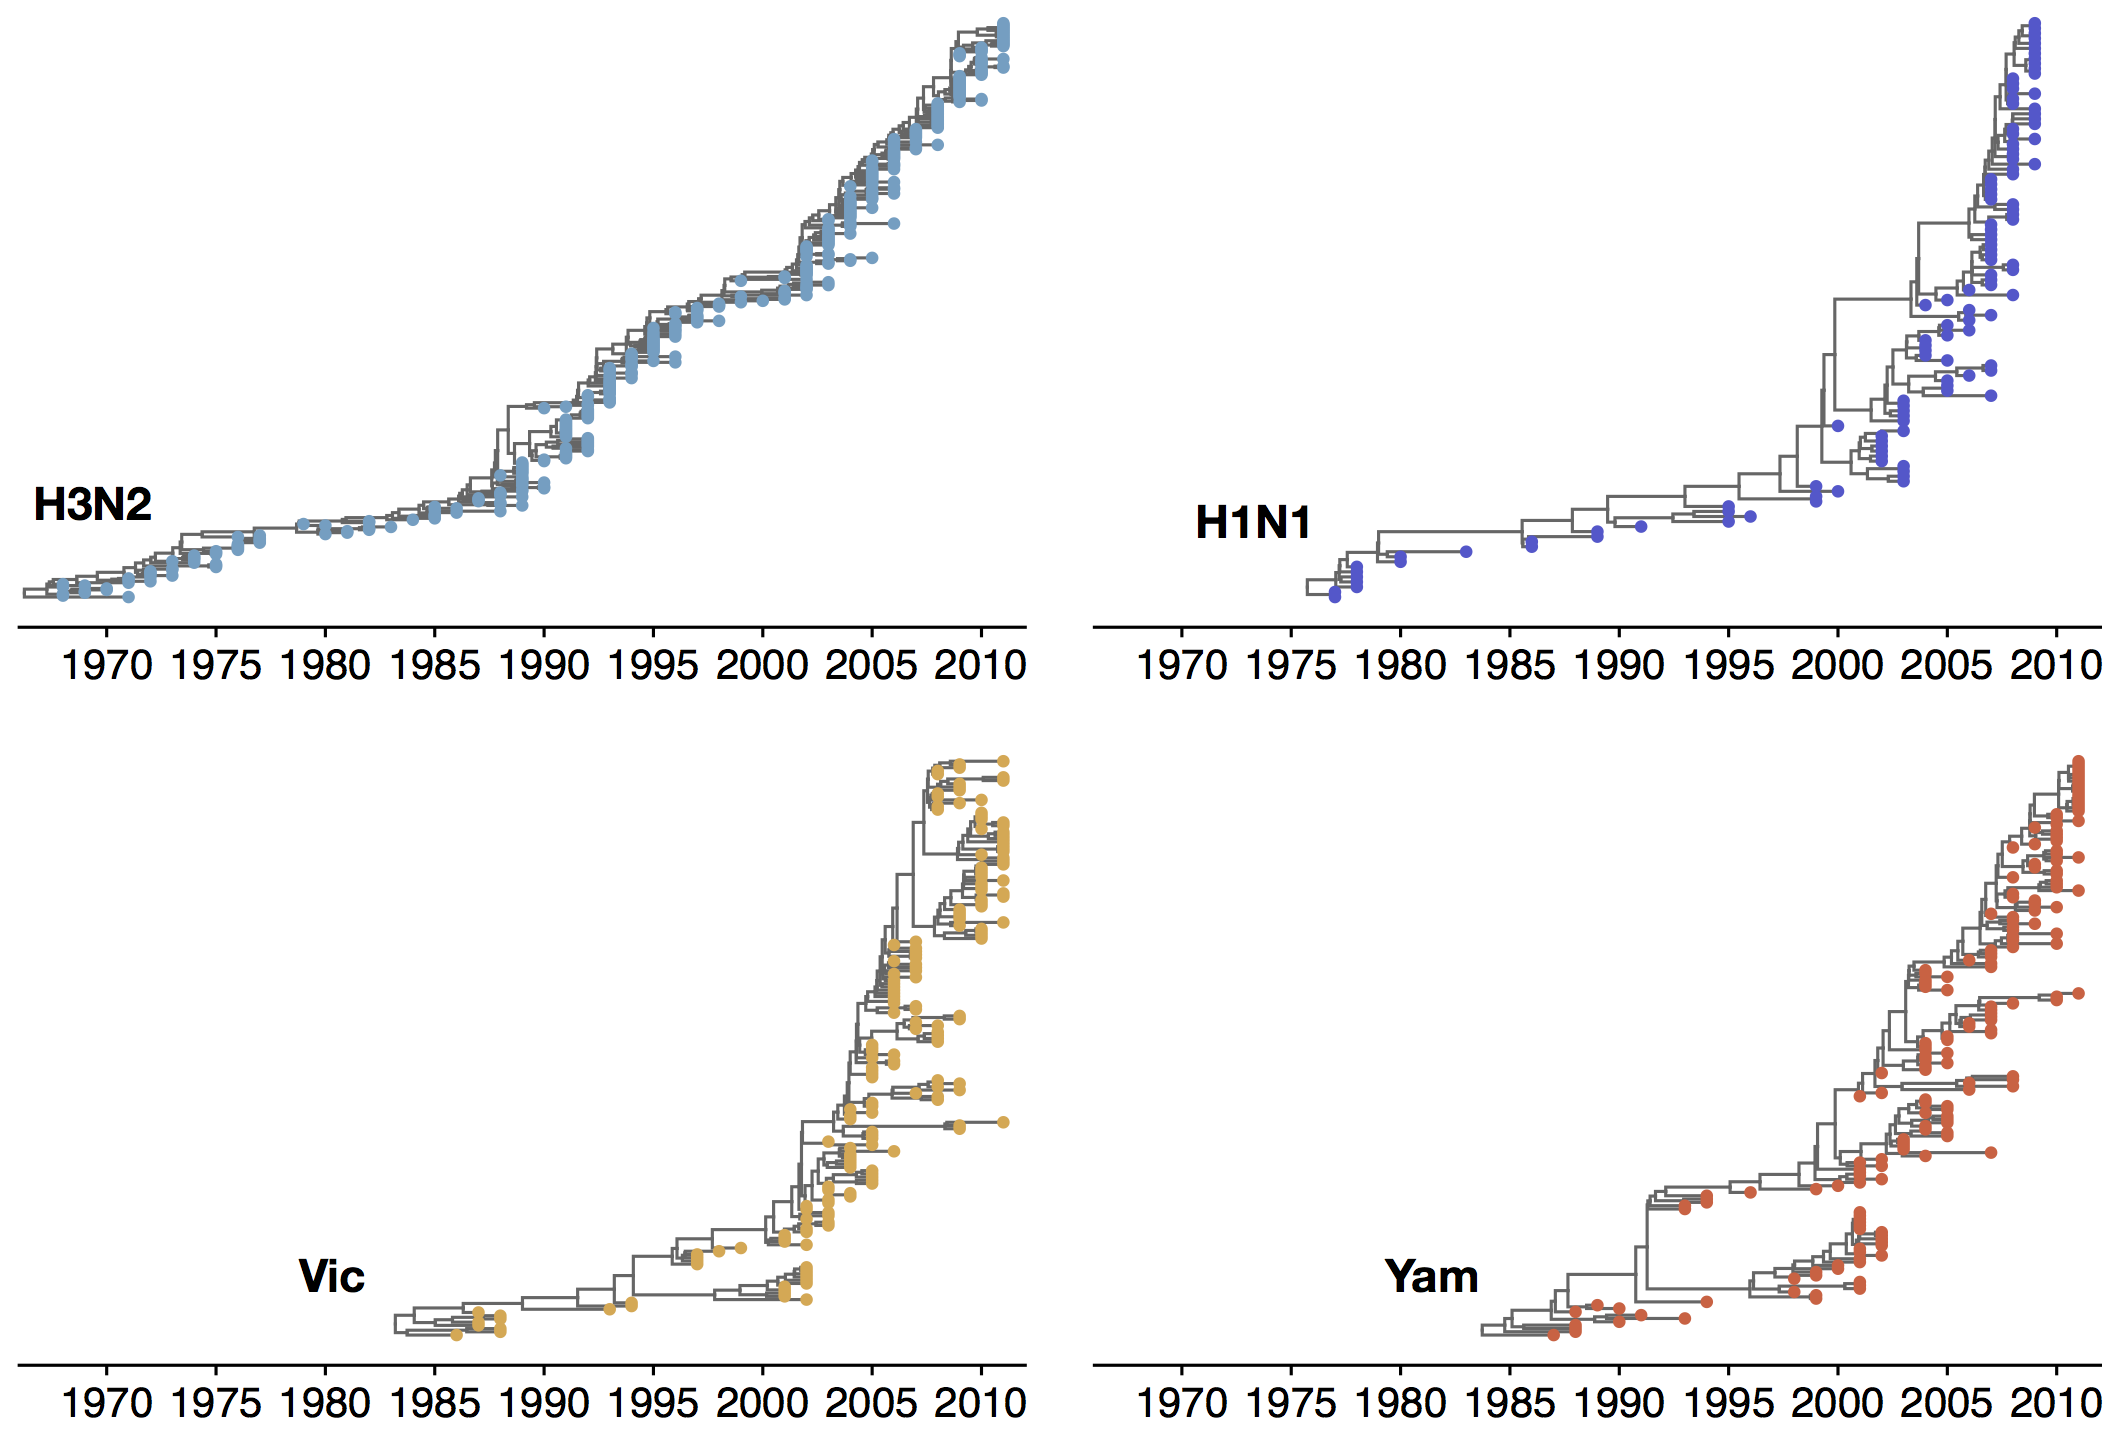
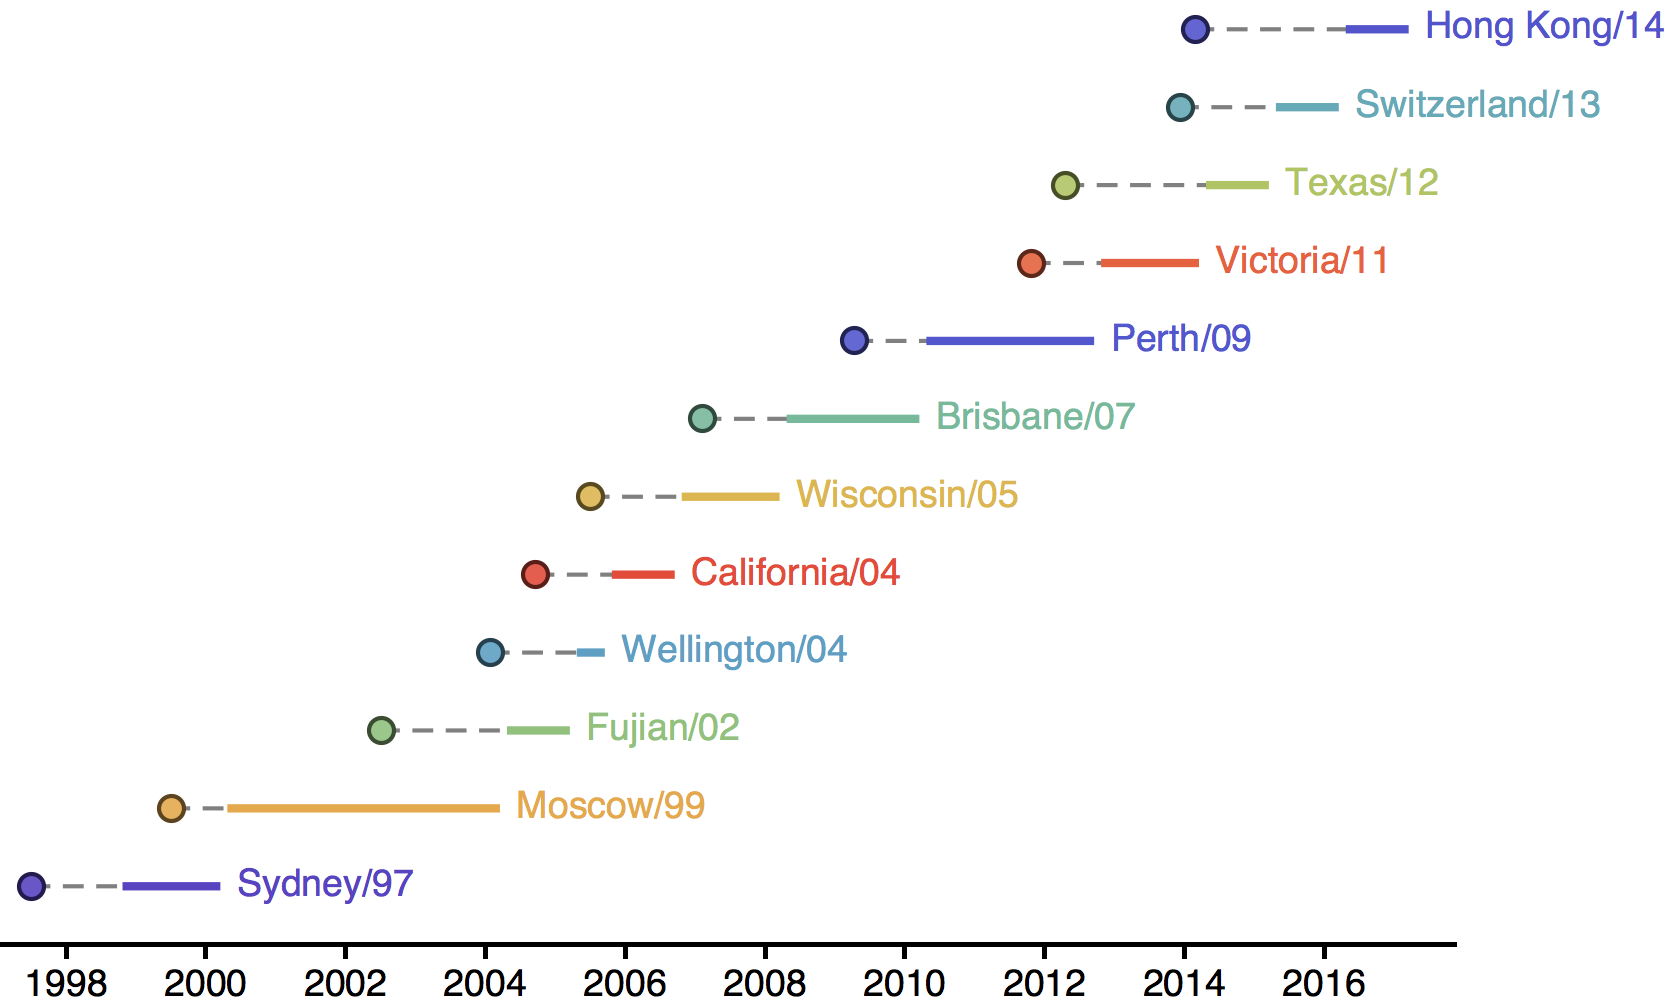
Phylogenetic trees of different influenza lineages
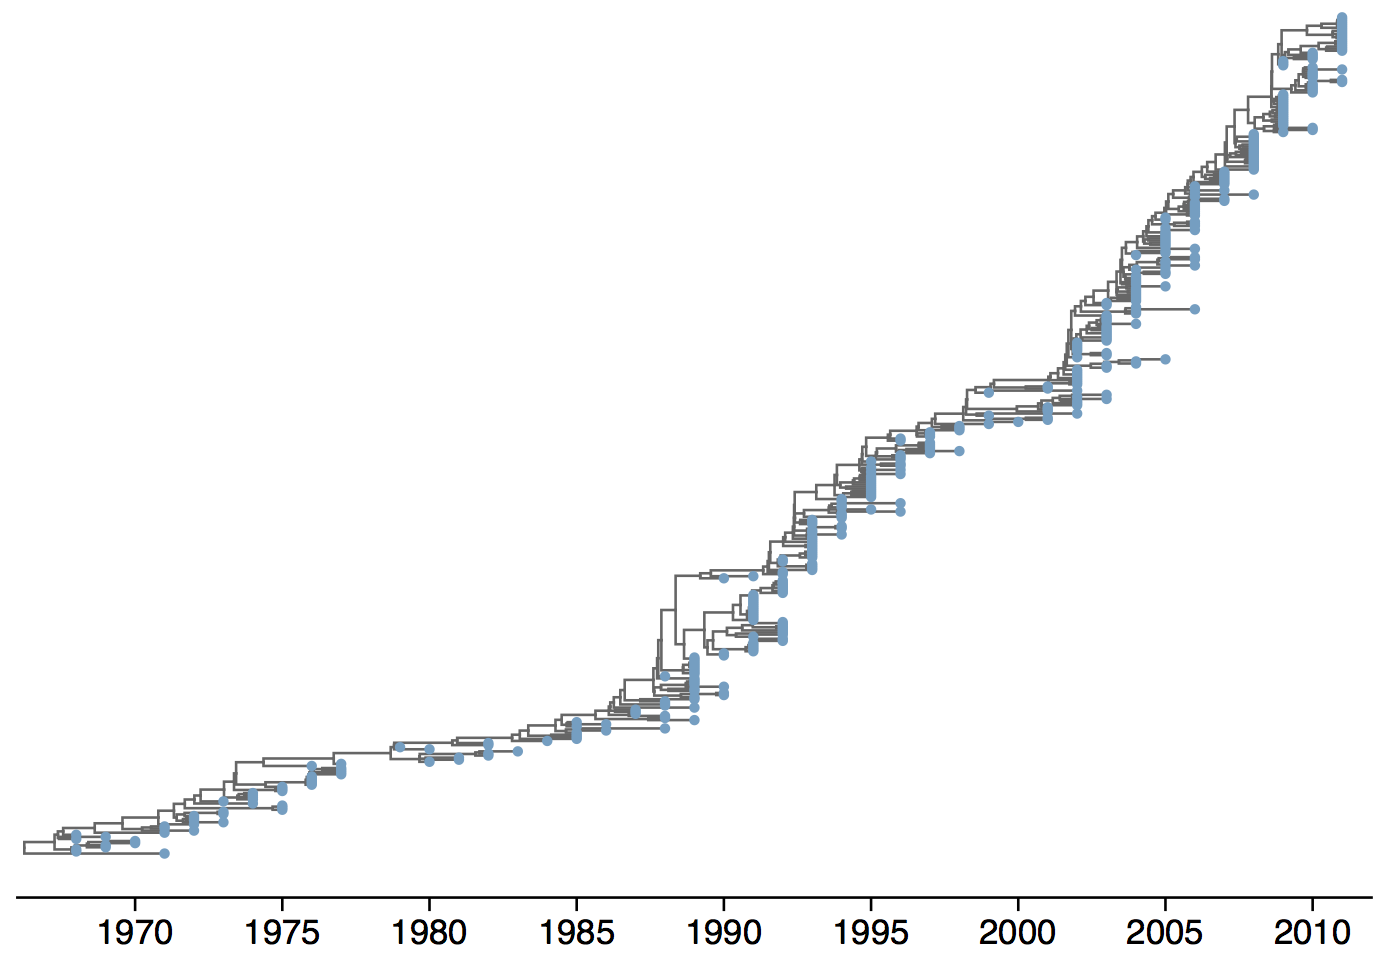
Population turnover (in H3N2) is extremely rapid
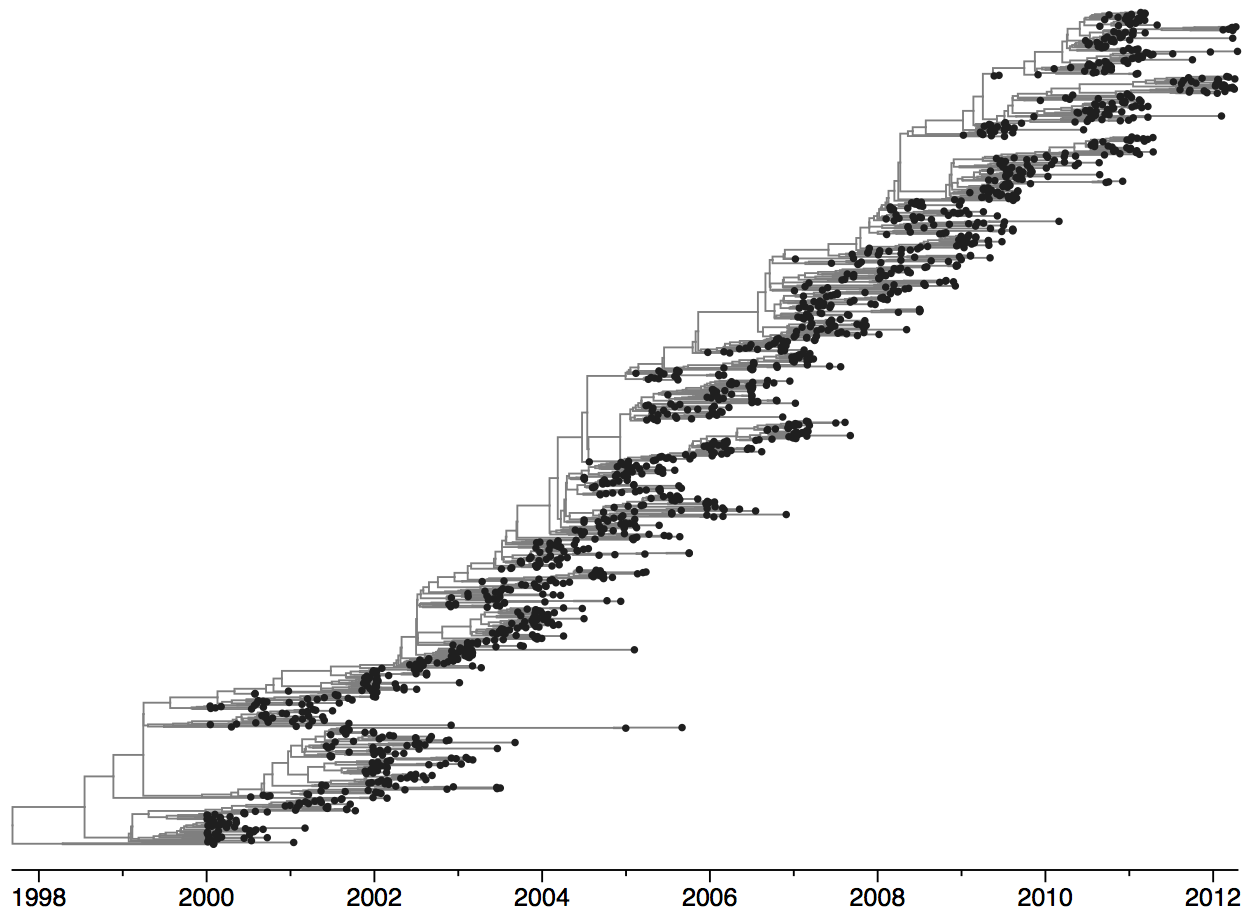
Clades emerge, die out and take over
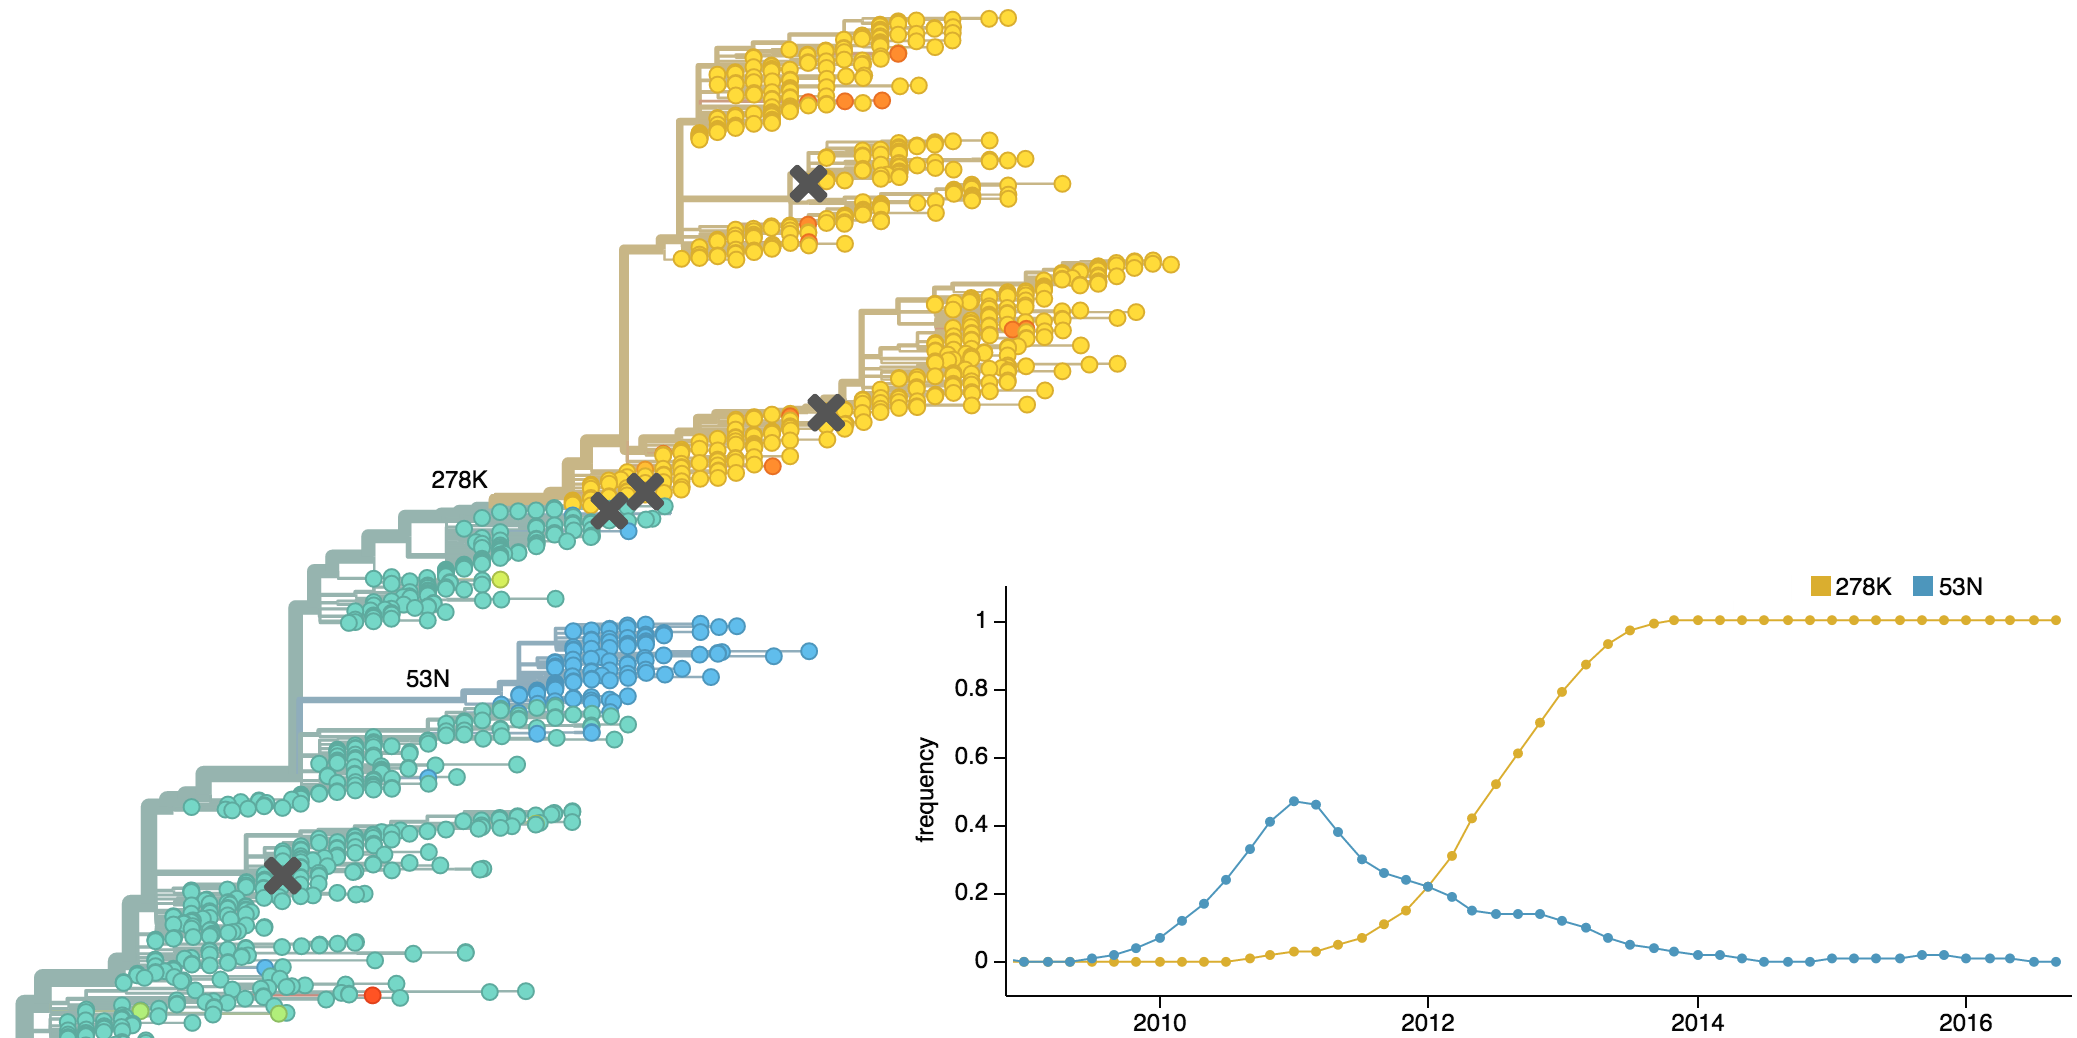
Clades show rapid turnover

Dynamics driven by antigenic drift
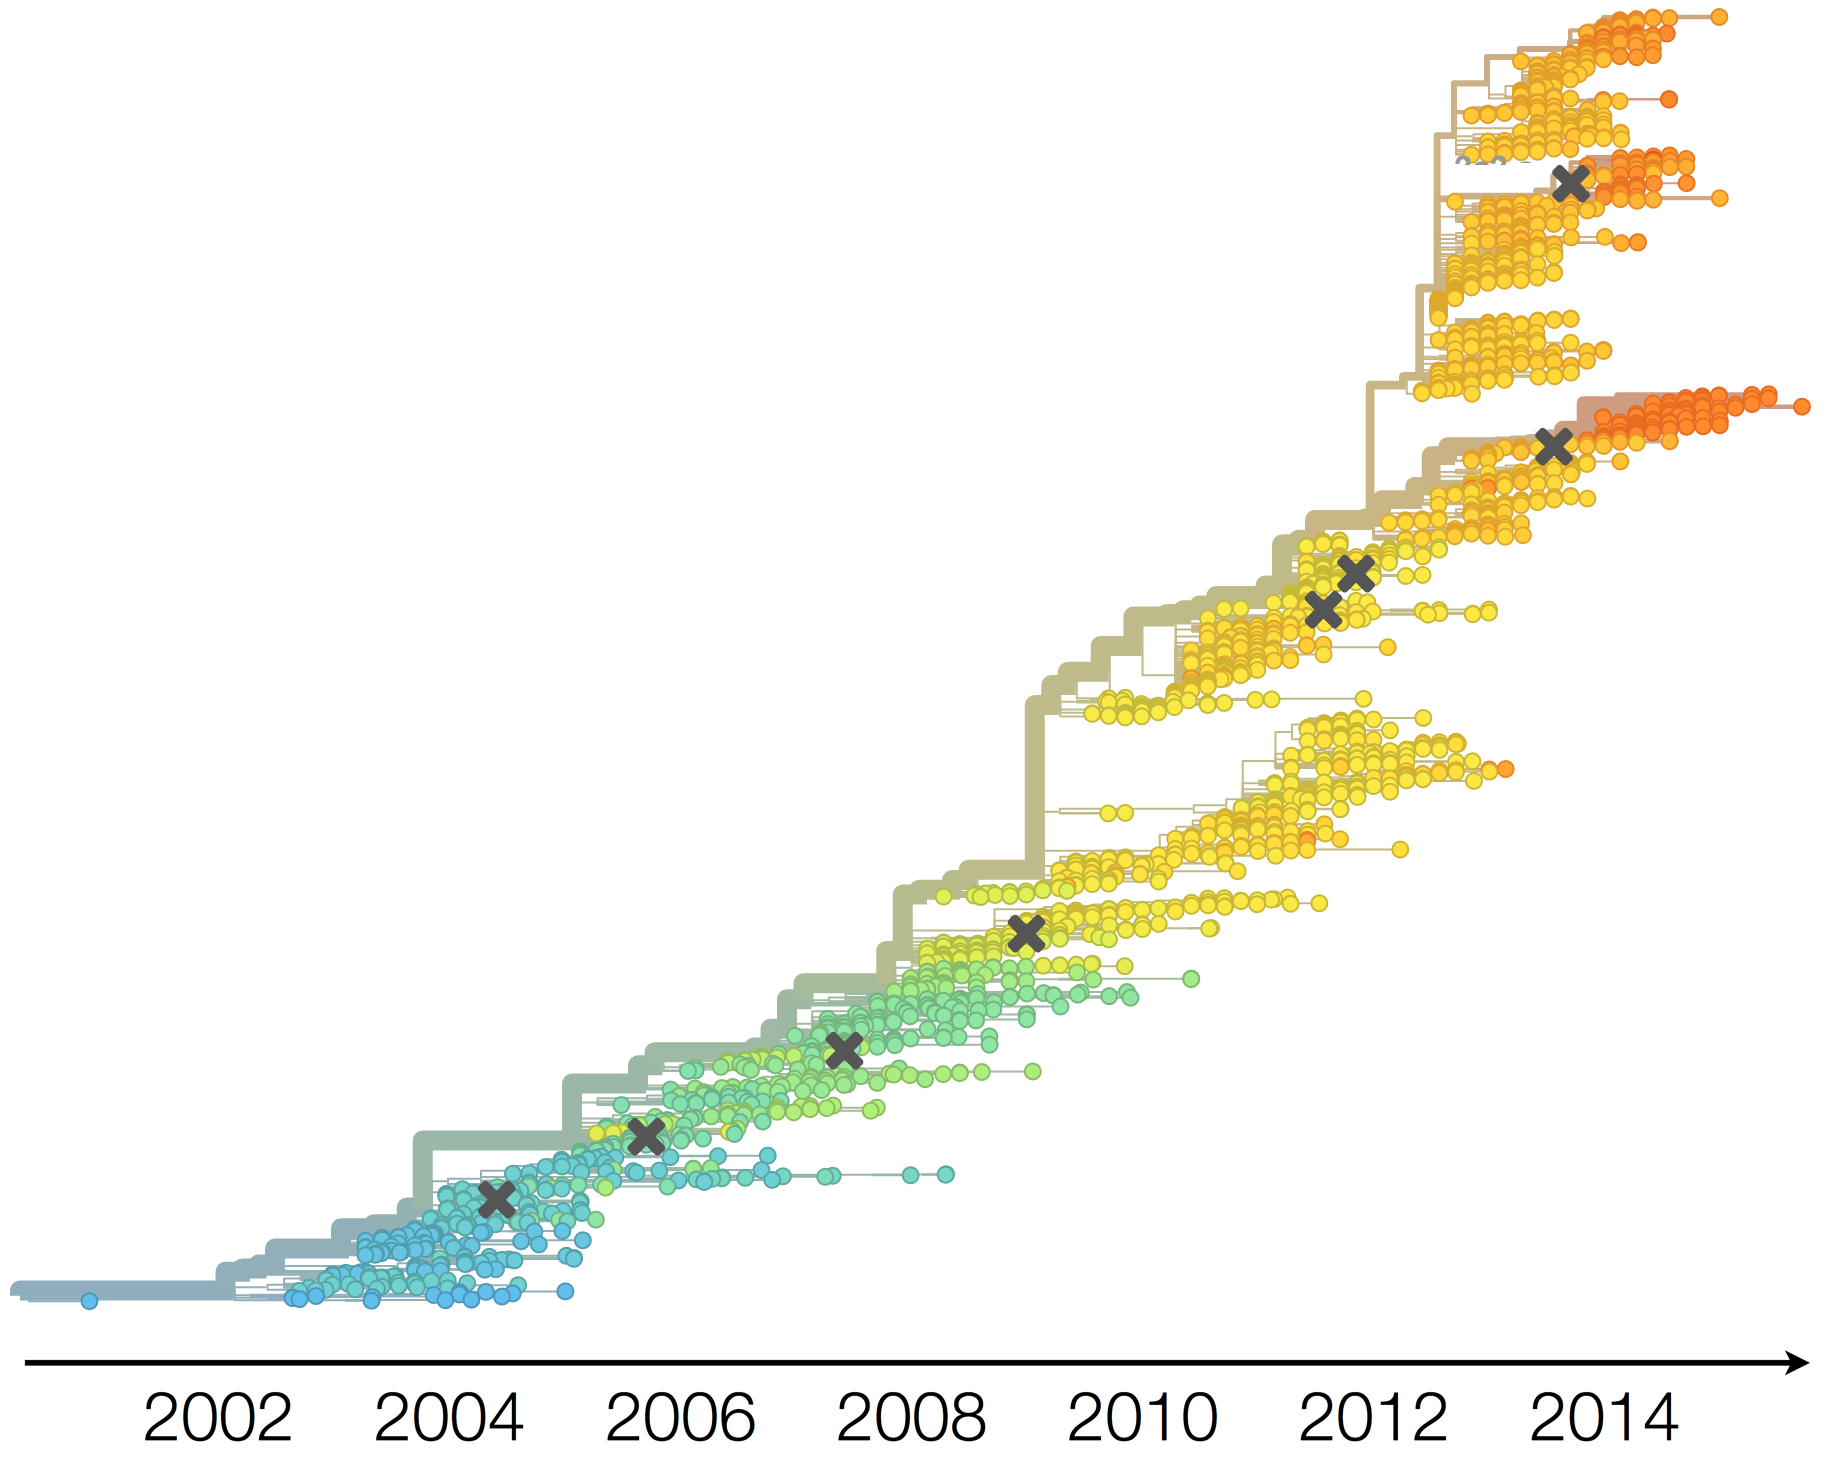
Drift variants emerge and rapidly take over in the virus population
This causes the side effect of evading existing vaccine formulations
Drift necessitates vaccine updates
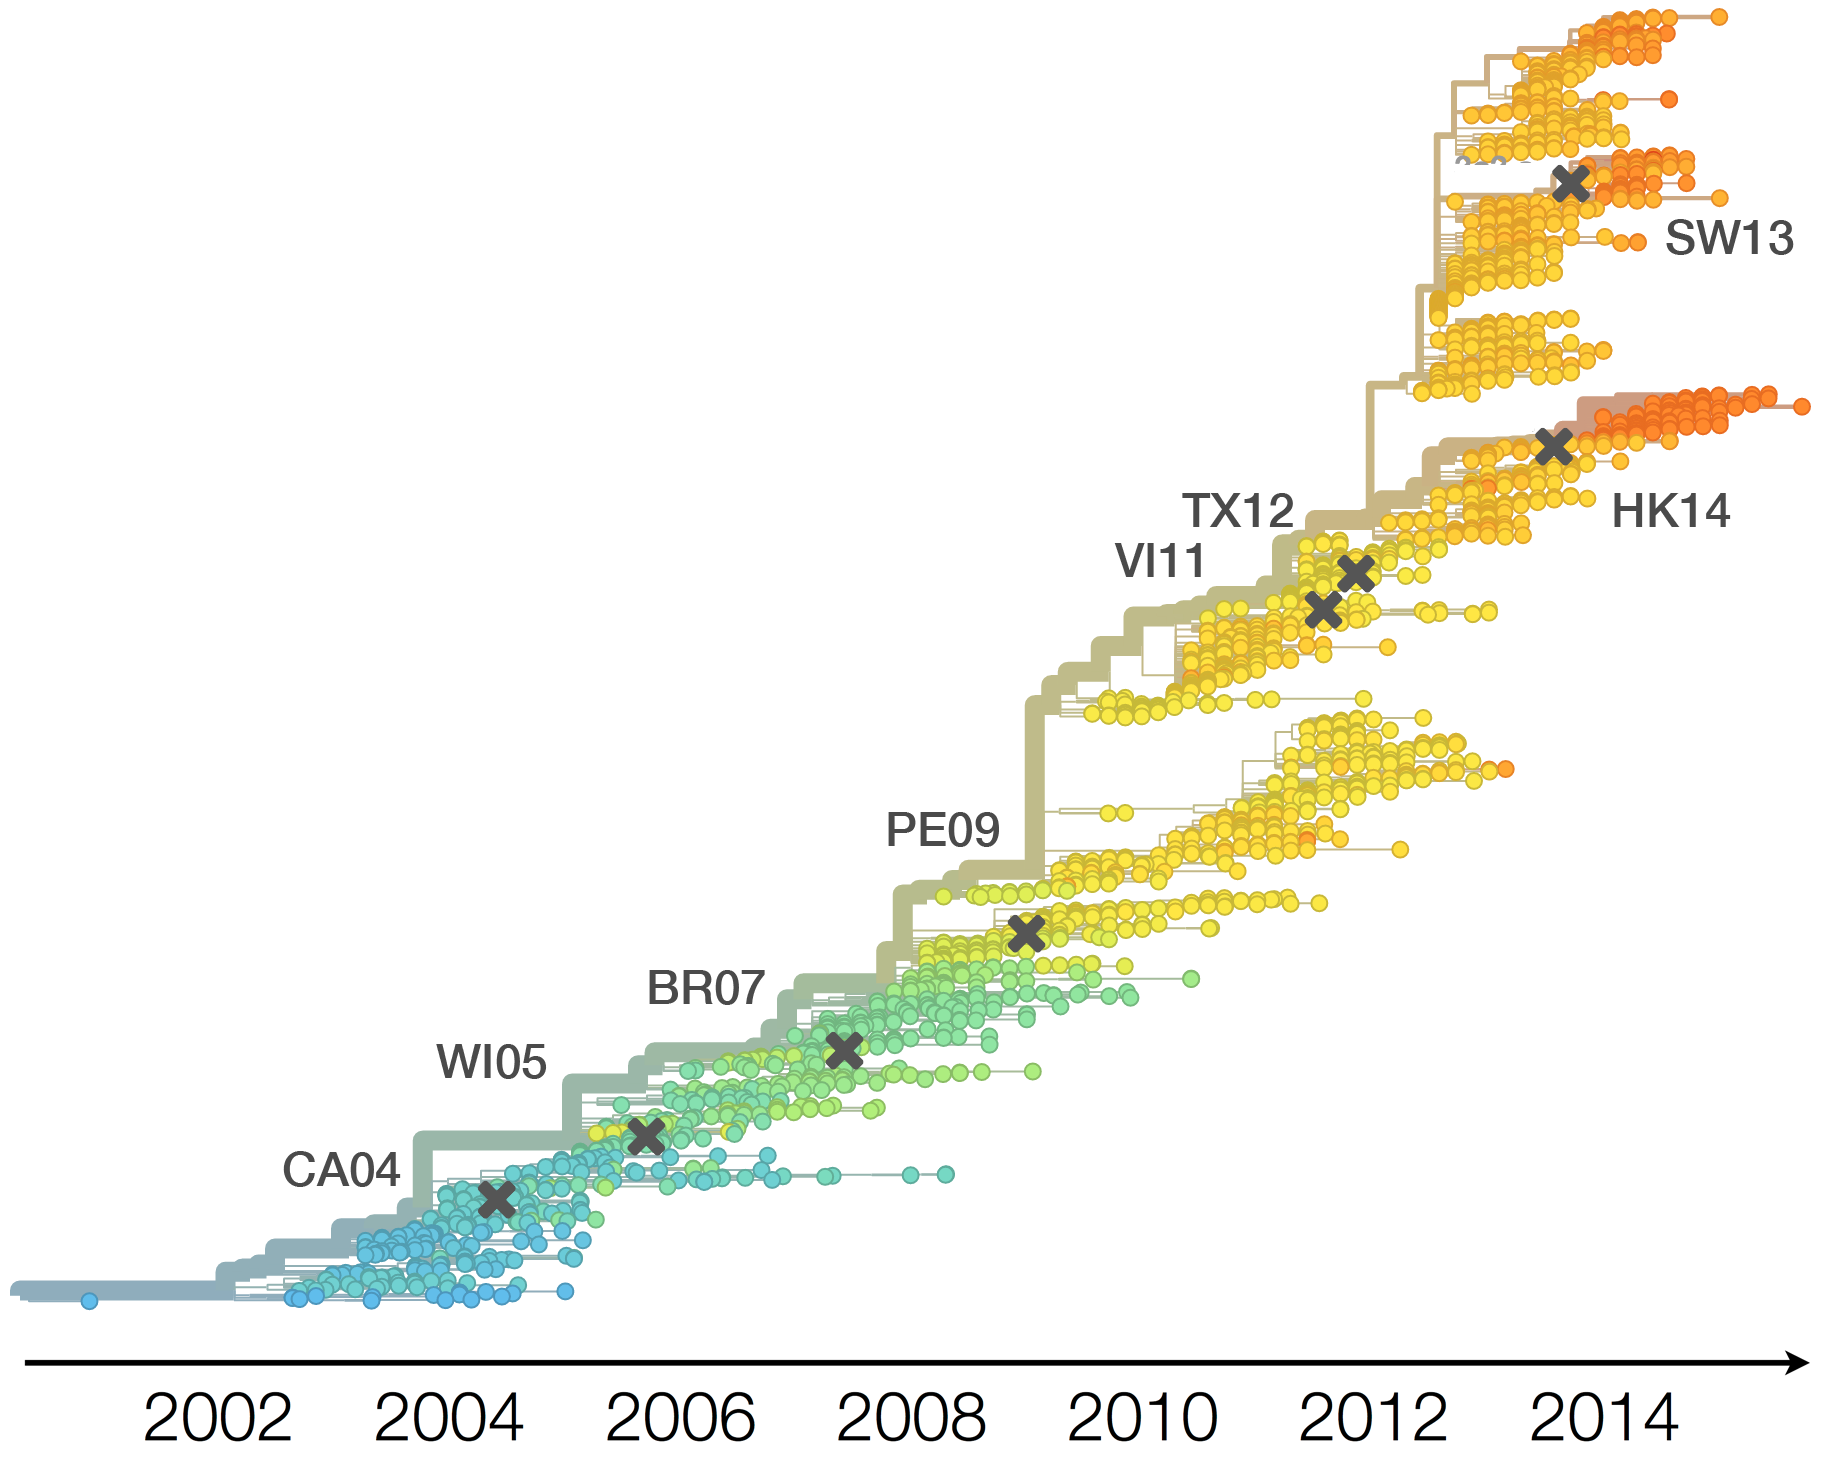
H3N2 vaccine updates occur every ~2 years
Empirical patterns of antigenic evolution
Influenza hemagglutination inhibition (HI) assay
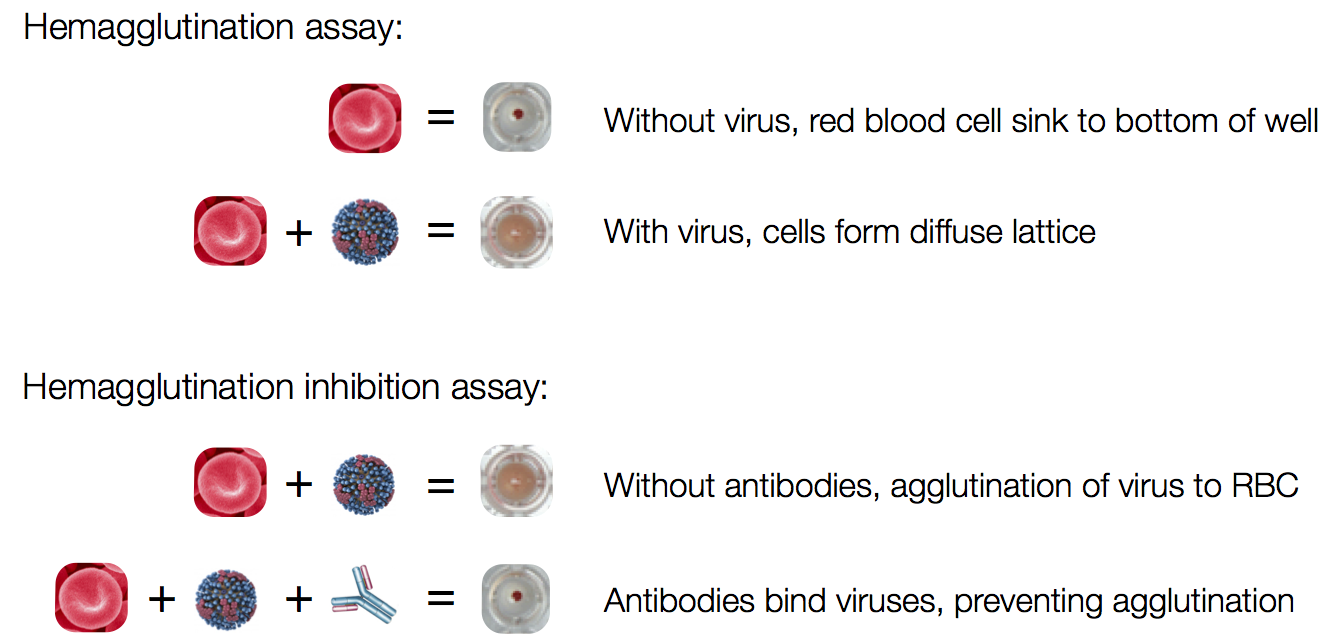
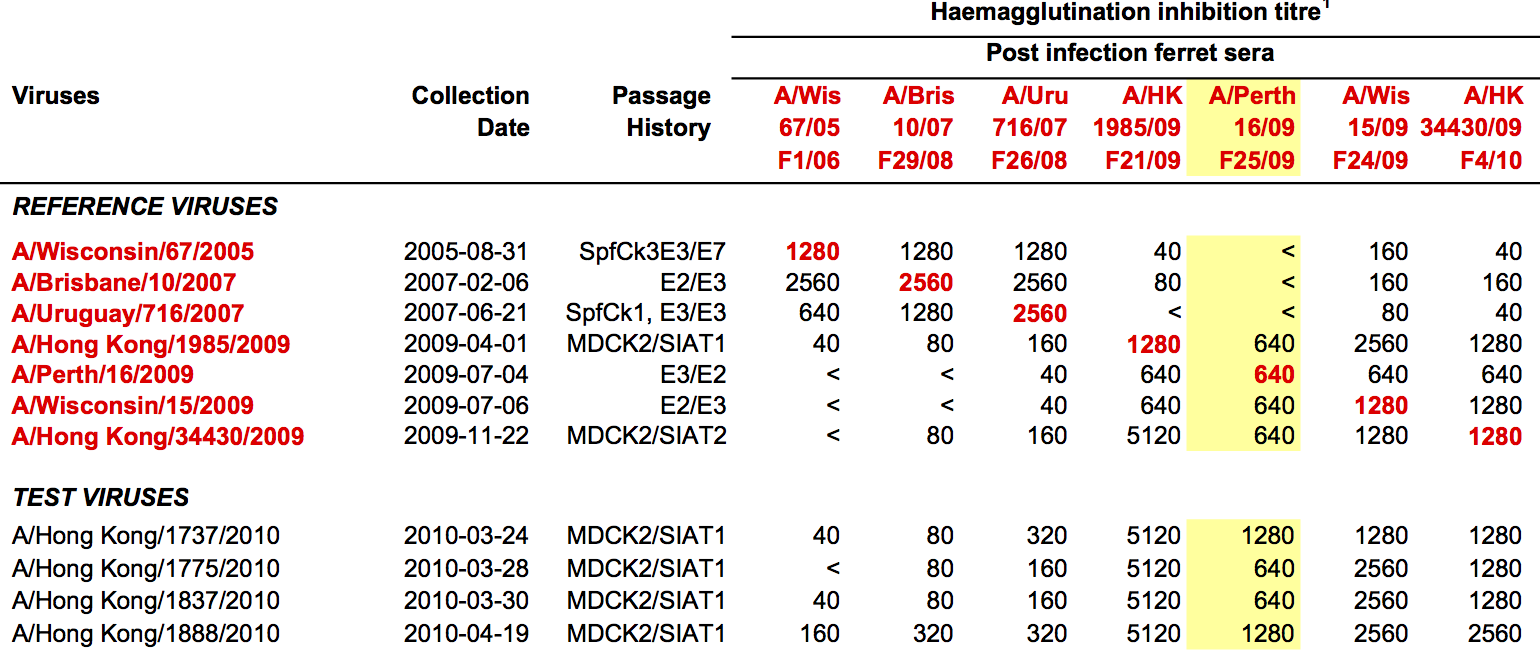
HI measures cross-reactivity across viruses

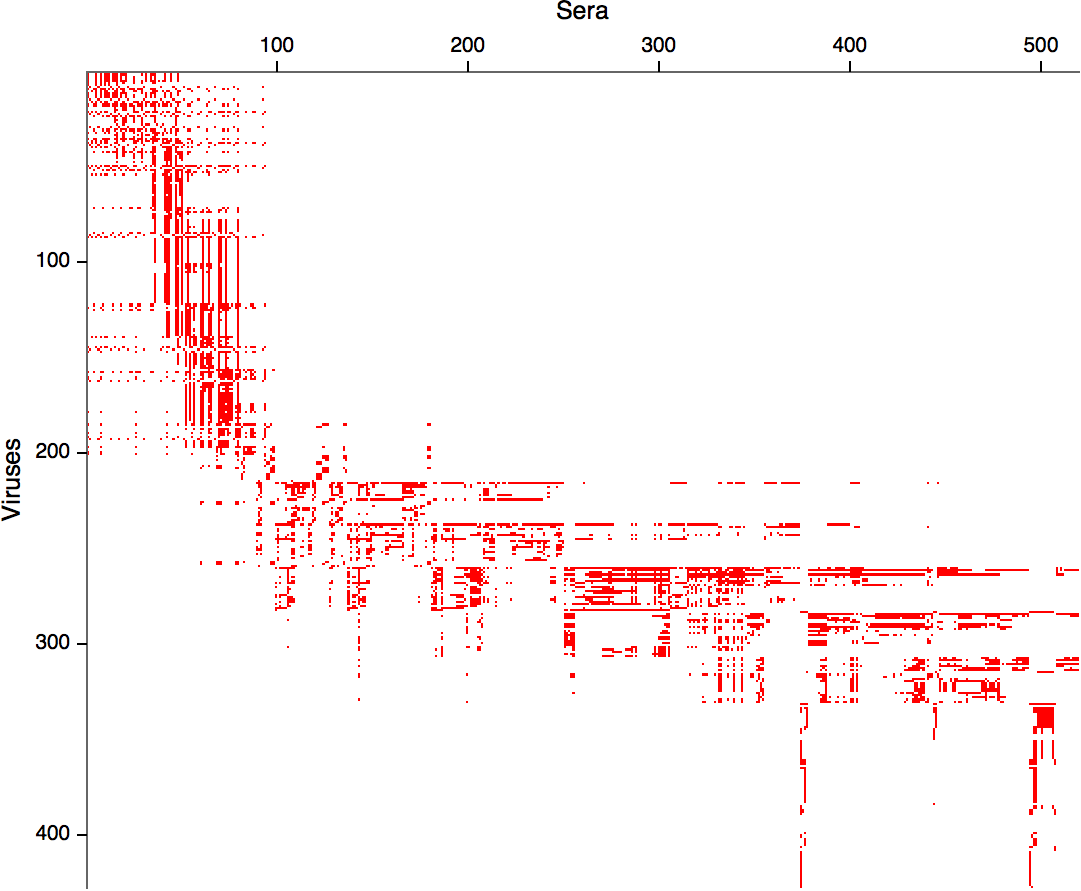
Data in the form of table of maximum inhibitory titers
Compiled HI data difficult to work with
Antigenic cartography positions viruses and sera to recapitulate titer values
Antigenic cartography positions viruses and sera to recapitulate titer values
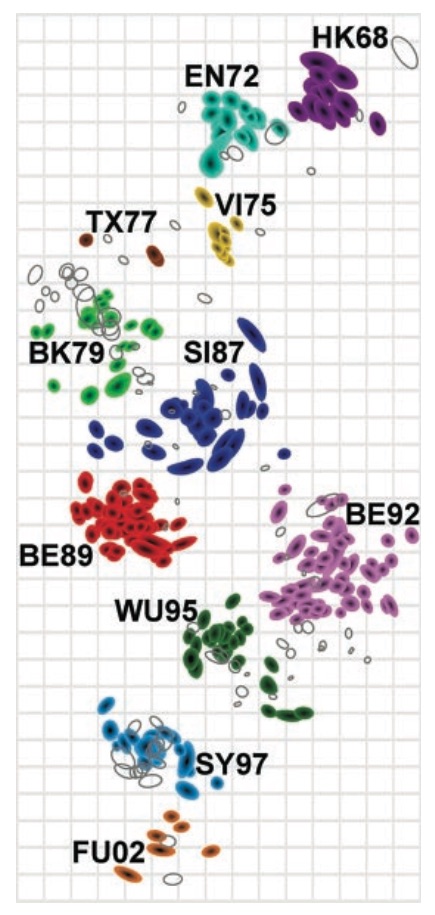
We take a Bayesian multidimensional scaling (BMDS) approach that models antigenic locations of viruses and sera
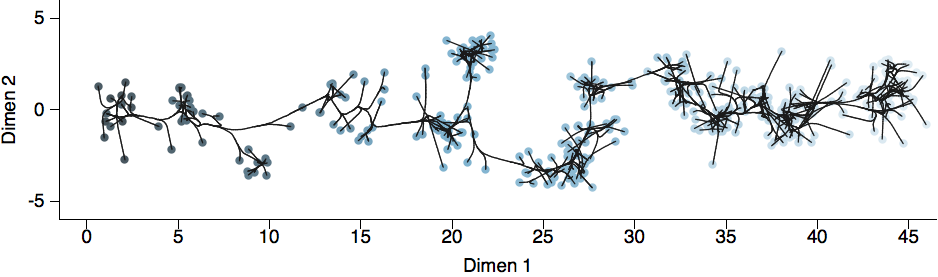
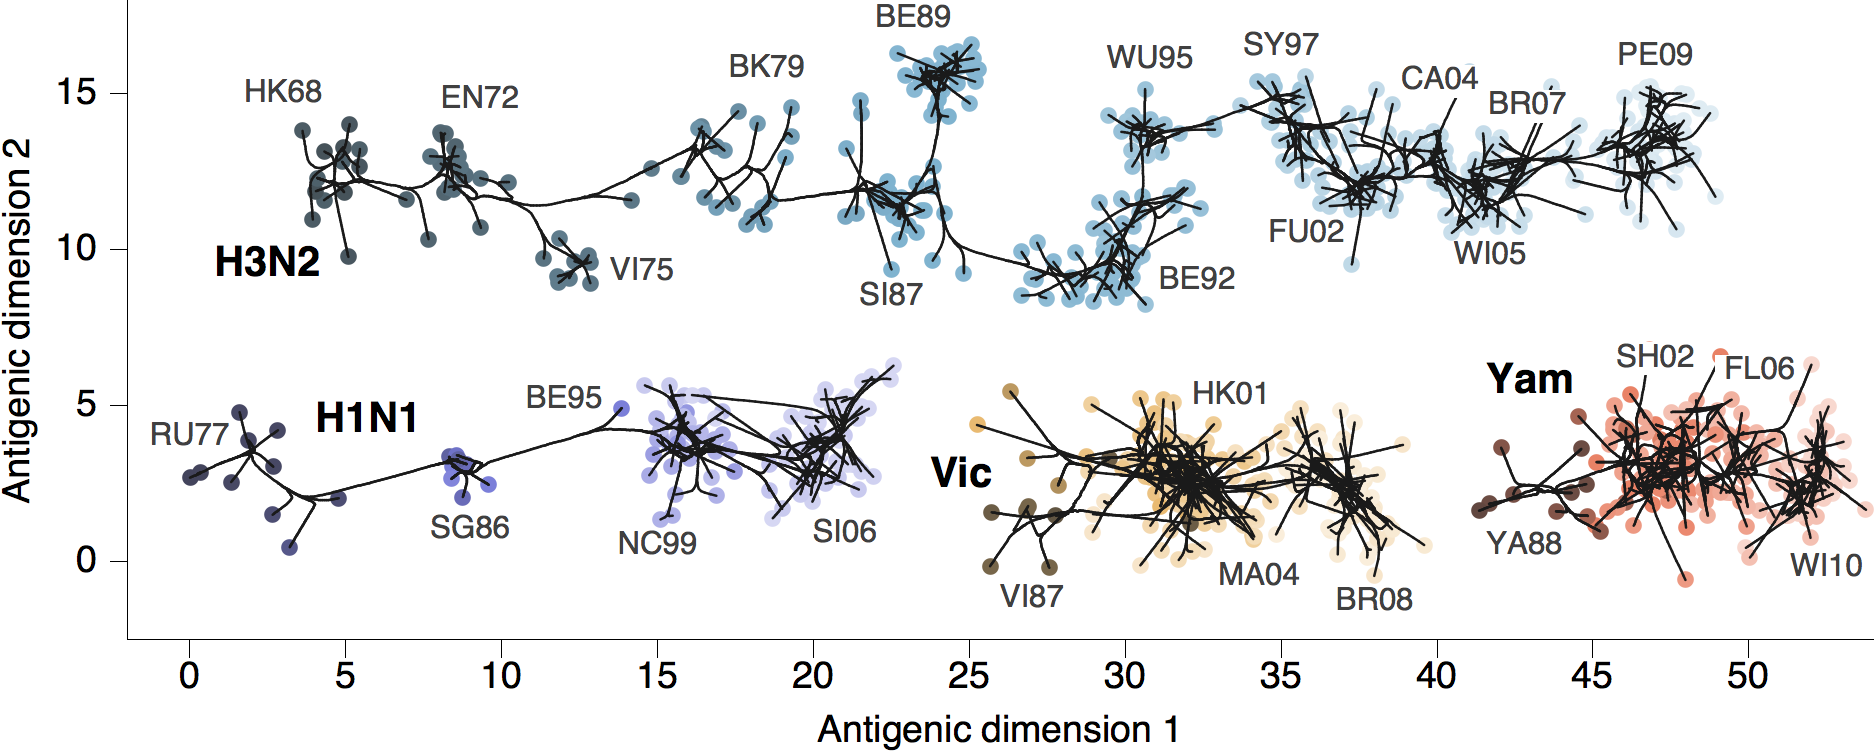
Antigenic map of H3N2 influenza from 1968 to 2011
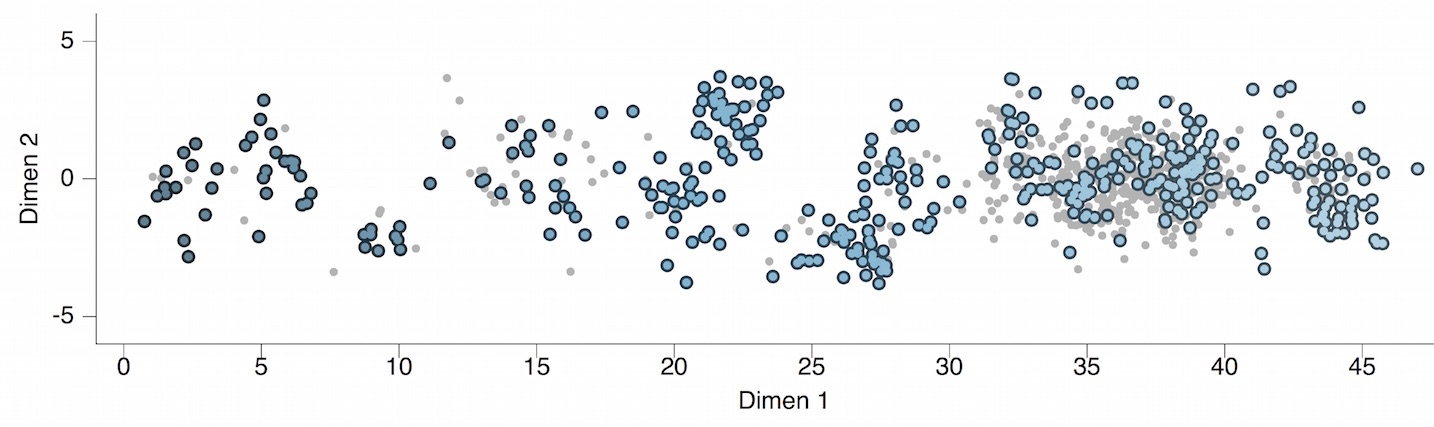
Model performs best in 2 dimensions
| Dimensions | Test error |
|---|---|
| 1 | 1.35 |
| 2 | 0.91 |
| 3 | 0.93 |
| 4 | 0.98 |
| 5 | 1.04 |
Phylogeny of H3N2 virus sequences
Modeling continuous characters via Brownian motion
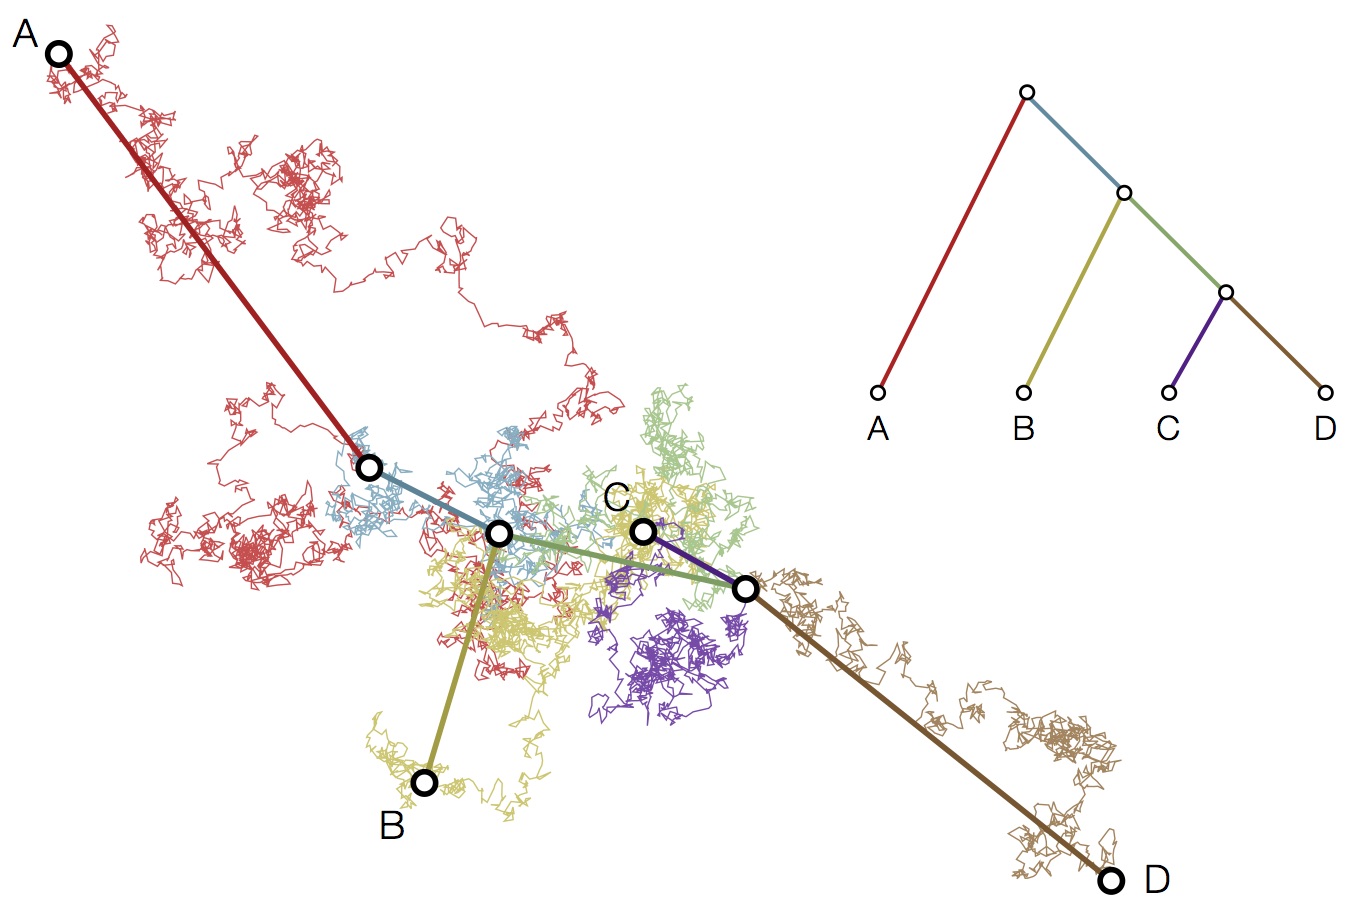
Including diffusion in MDS model
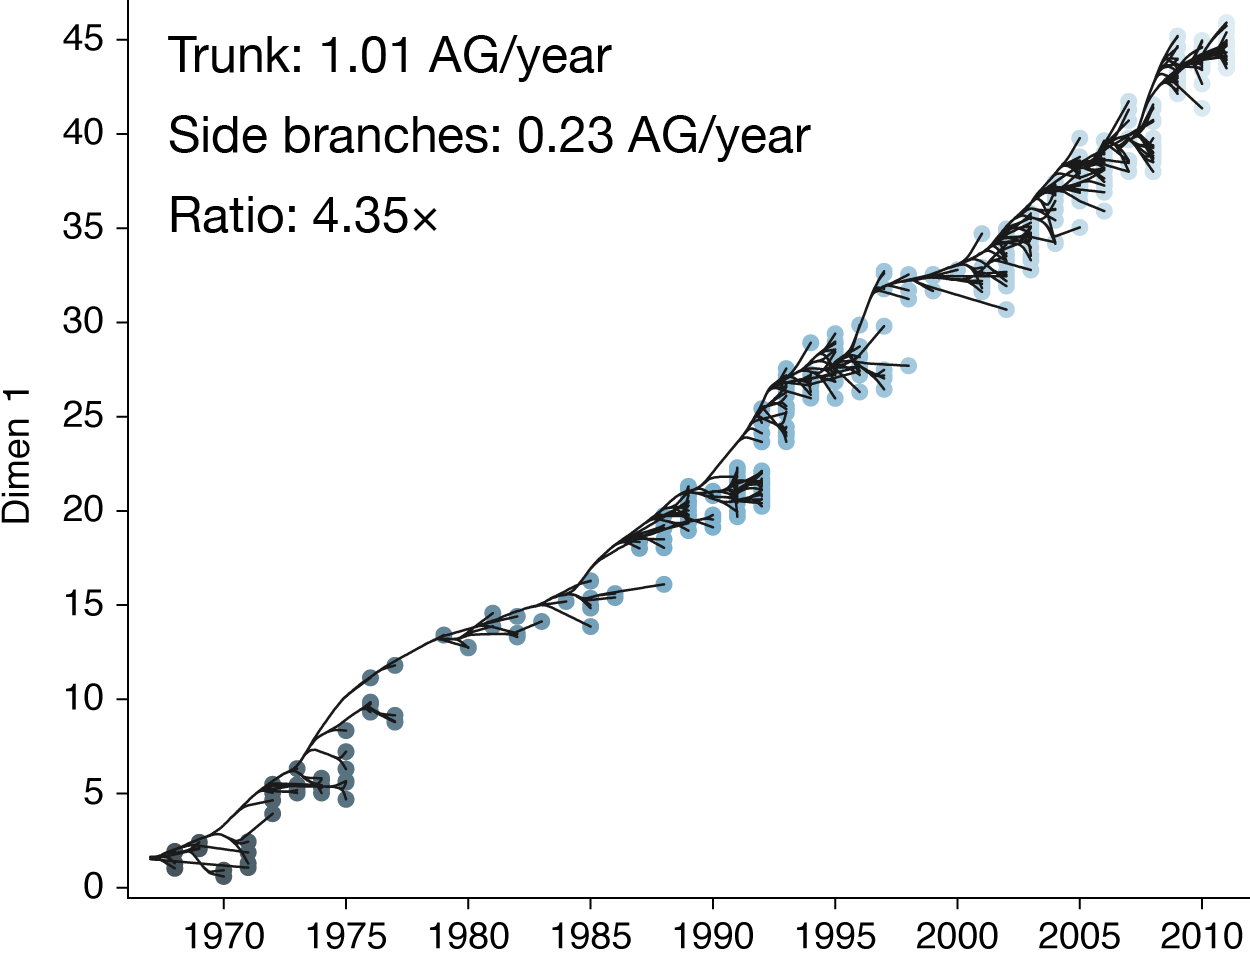
Population turnover results in antigenic drift
Modeling antigenic evolution
A good model should capture multiple empirical patterns
- Genealogical (TMRCA of 3-5 years)
- Epidemiological (attack rates of 5-10% per year)
- Antigenic (rate of antigenic drift of ~1 unit per year)
- Geographic (limited local persistence)
Large-scale individual-based simulation
40 years of simulation with 90 million hosts runs in 15 minutes
| Parameter | Value |
|---|---|
| Duration of infection | 5 days |
| $R_0$ | 1.8 |
| Host birth rate | 1/30 years |
| Host death rate | 1/30 years |
| Demes | North, Tropics, South |
| Host population size | 30 million per deme |
| Seasonal forcing amplitude | 0.15, 0, 0.15 |
| Between-deme contact proportion | 0.001 |
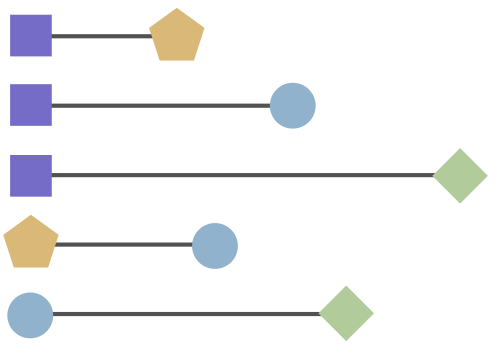
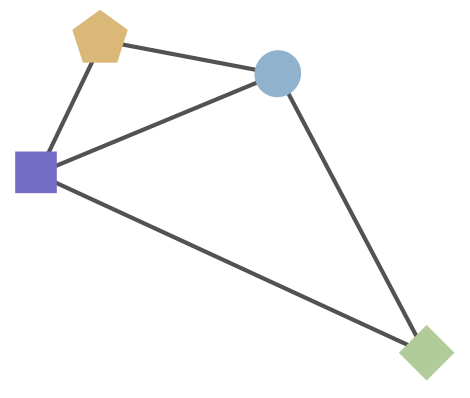
Structure of cross-immunity
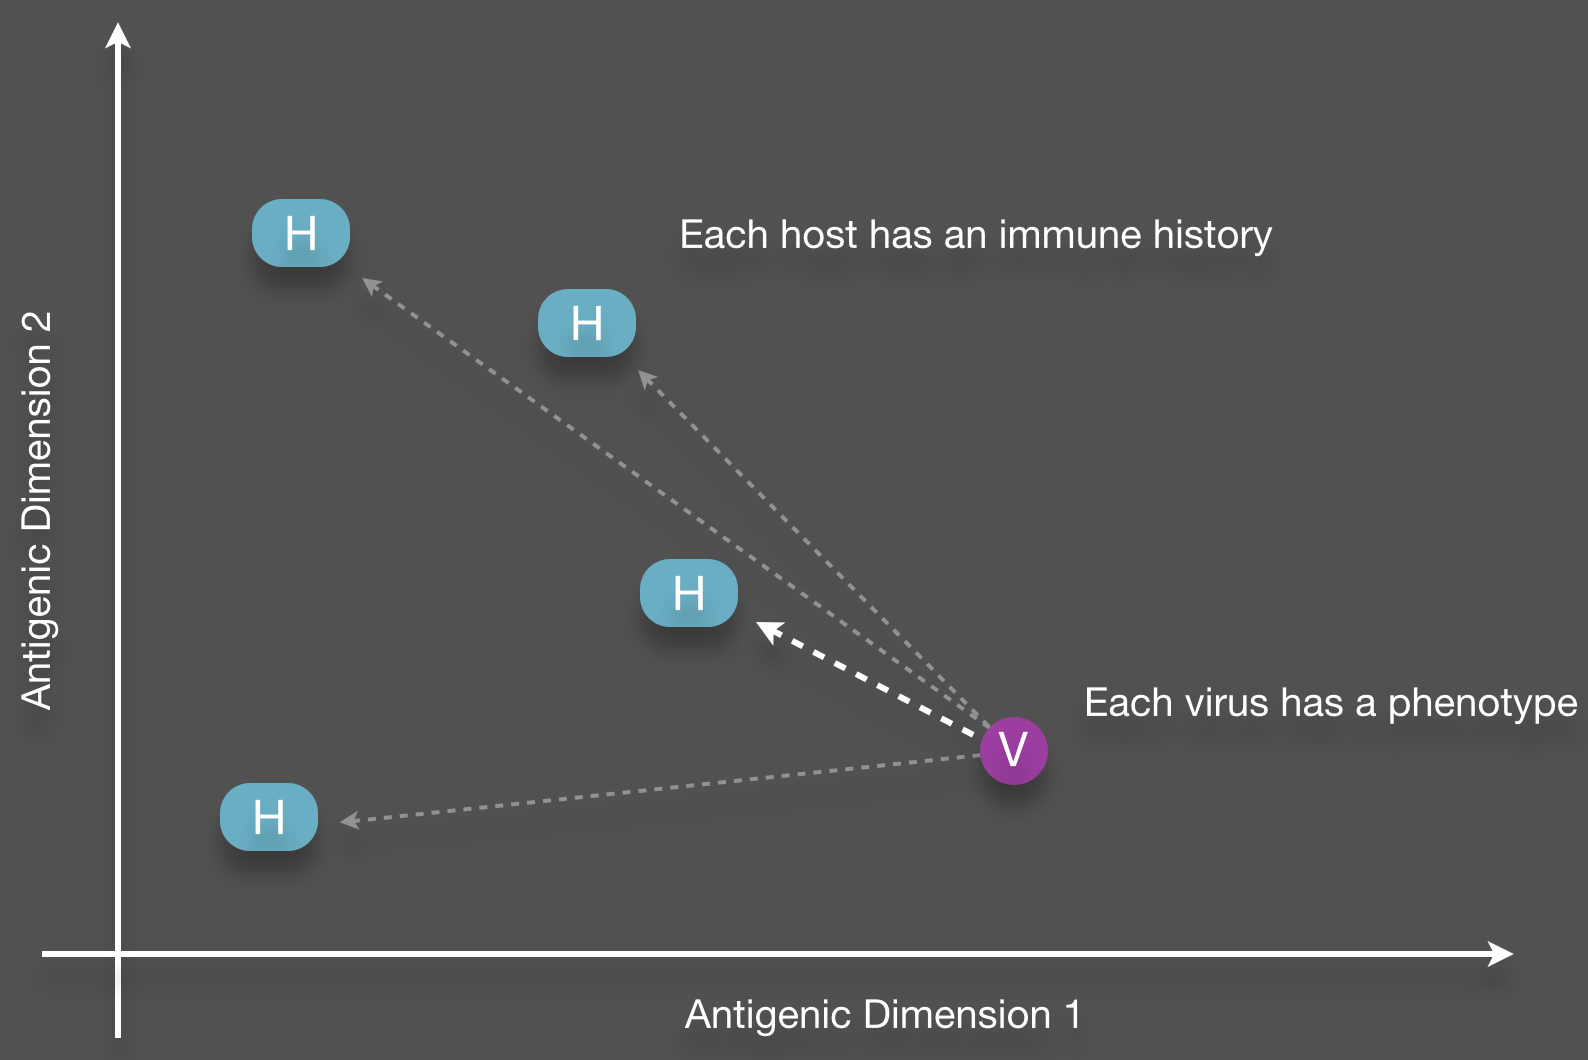
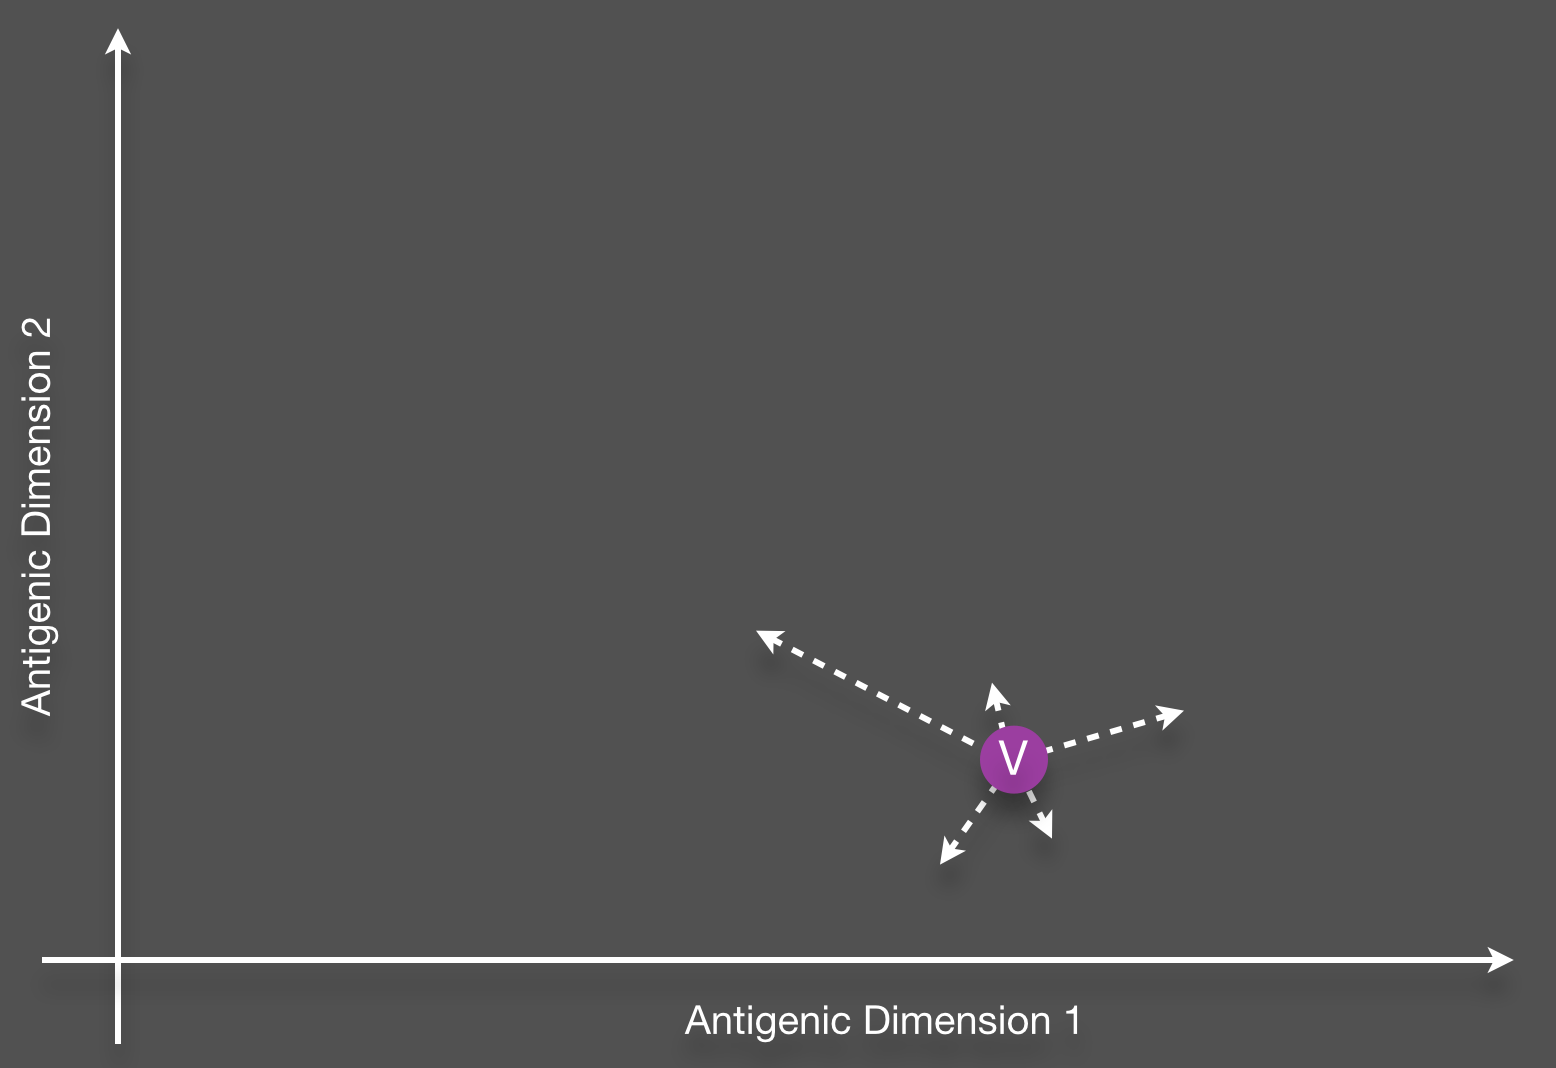
Phenotypic mutation
Genealogical tracking

Resulting phenotypes lie along a single axis
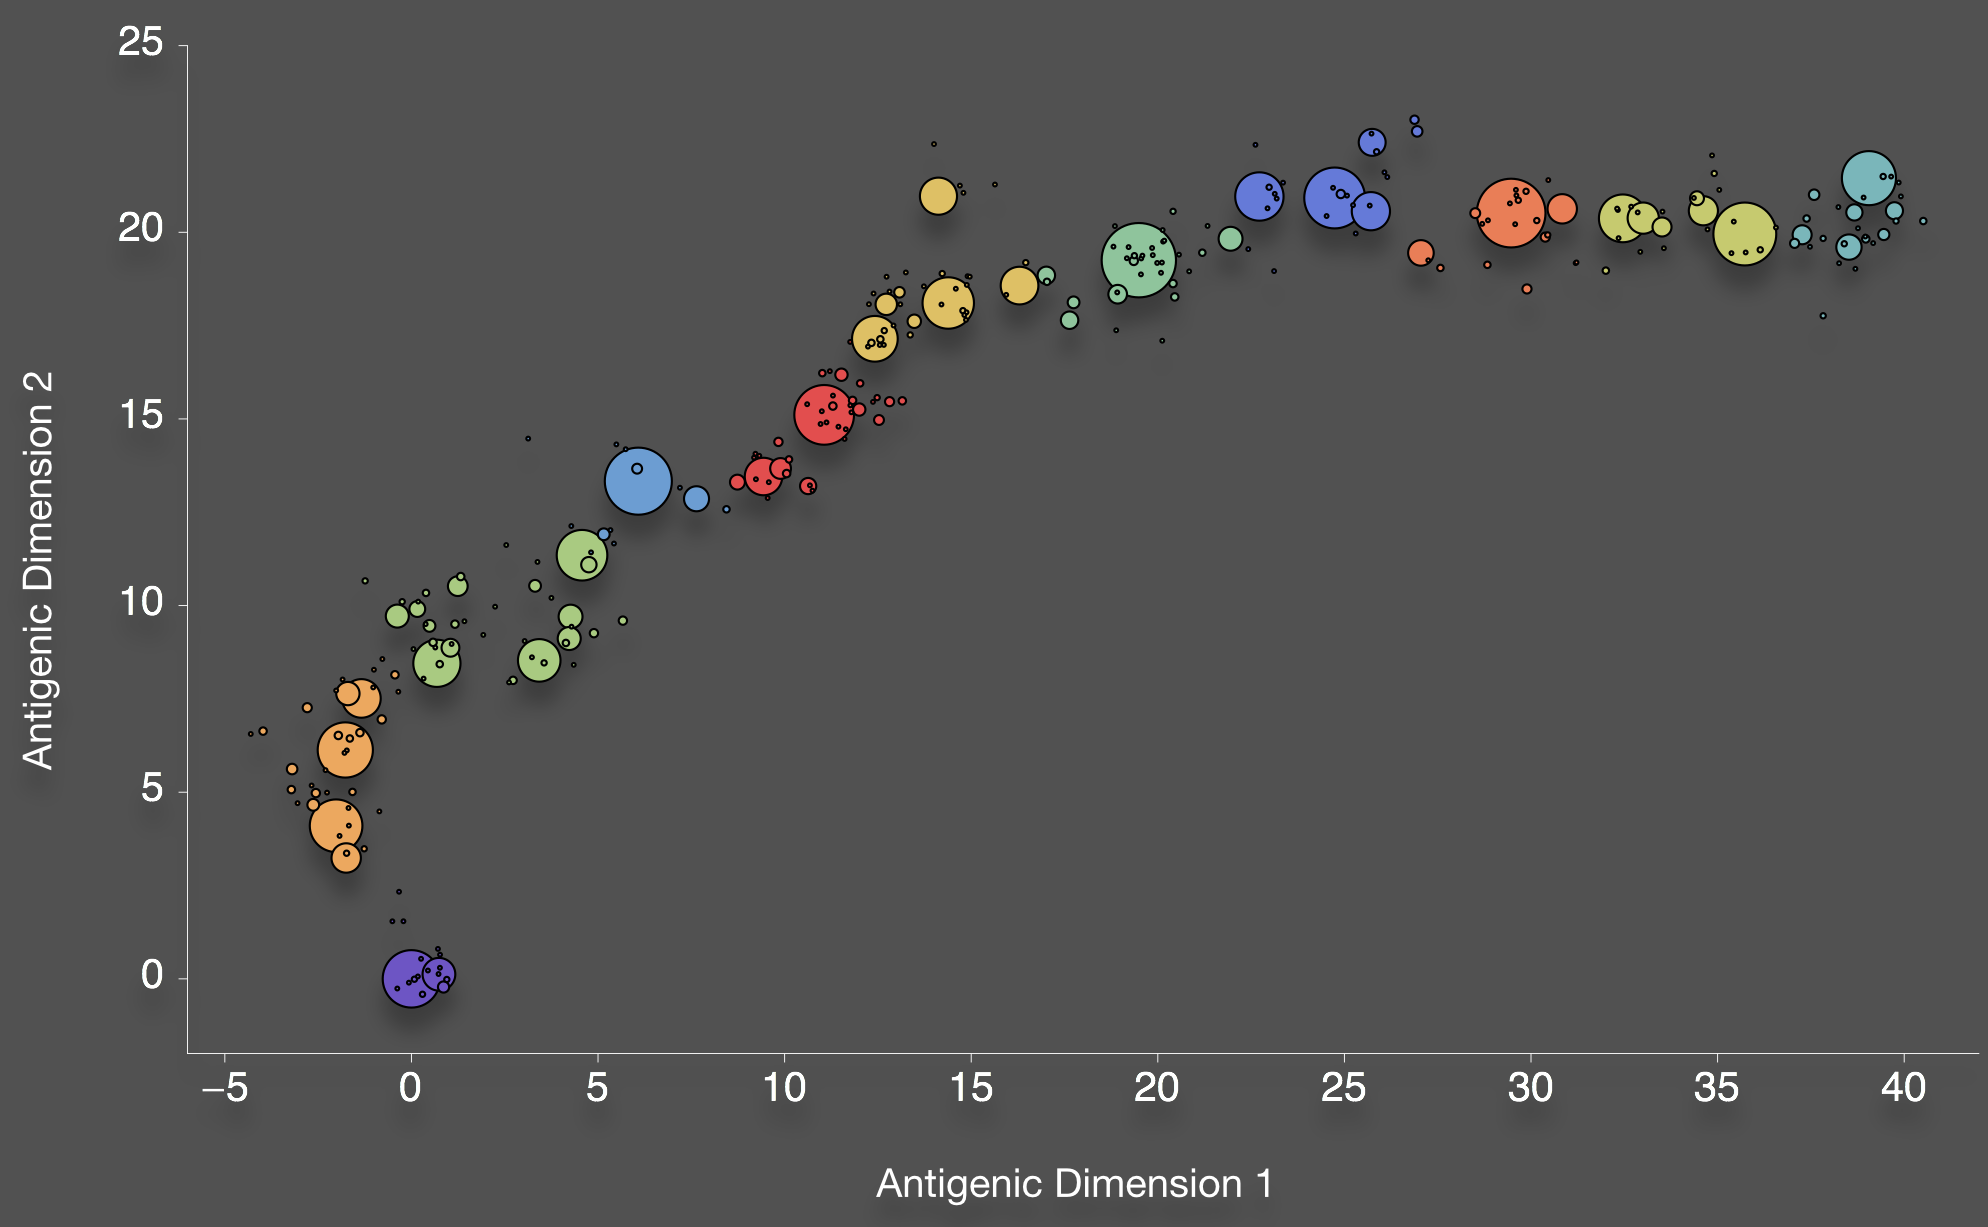
Bedford et al. 2012. BMC Biol.
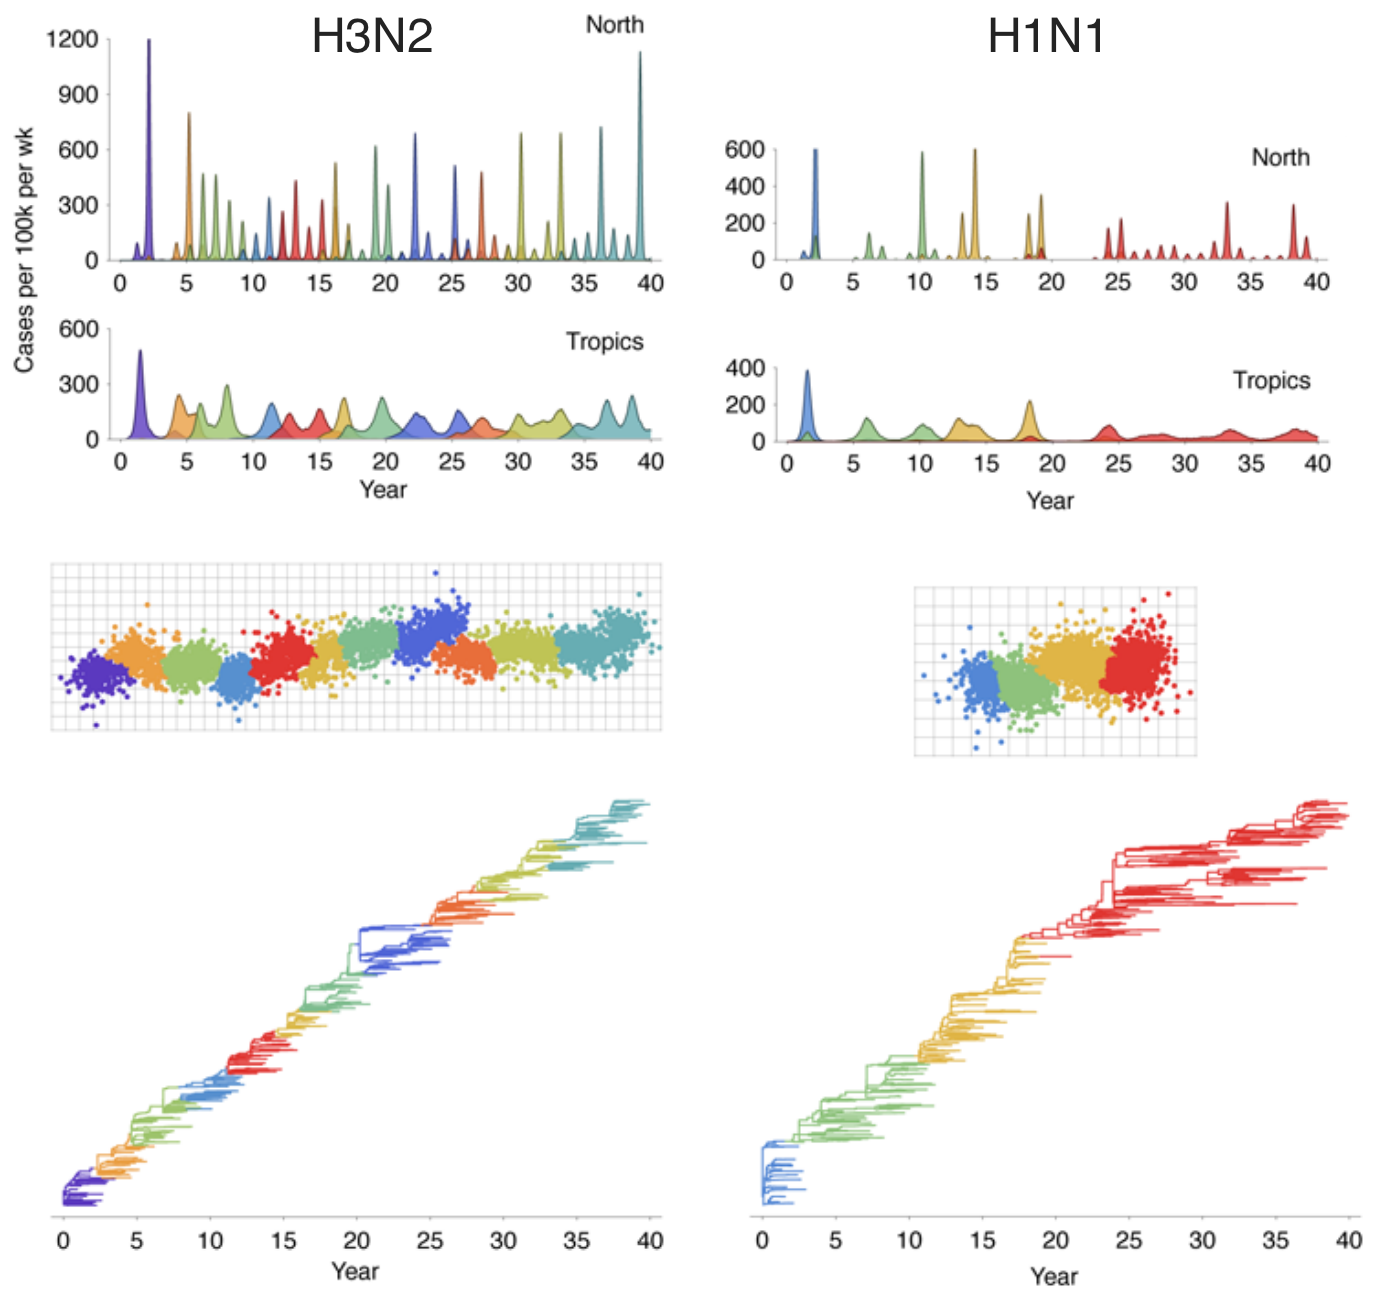
Evolution drives epidemiological dynamics
Bedford et al. 2012. BMC Biol.
Genealogy shows rapid population turnover
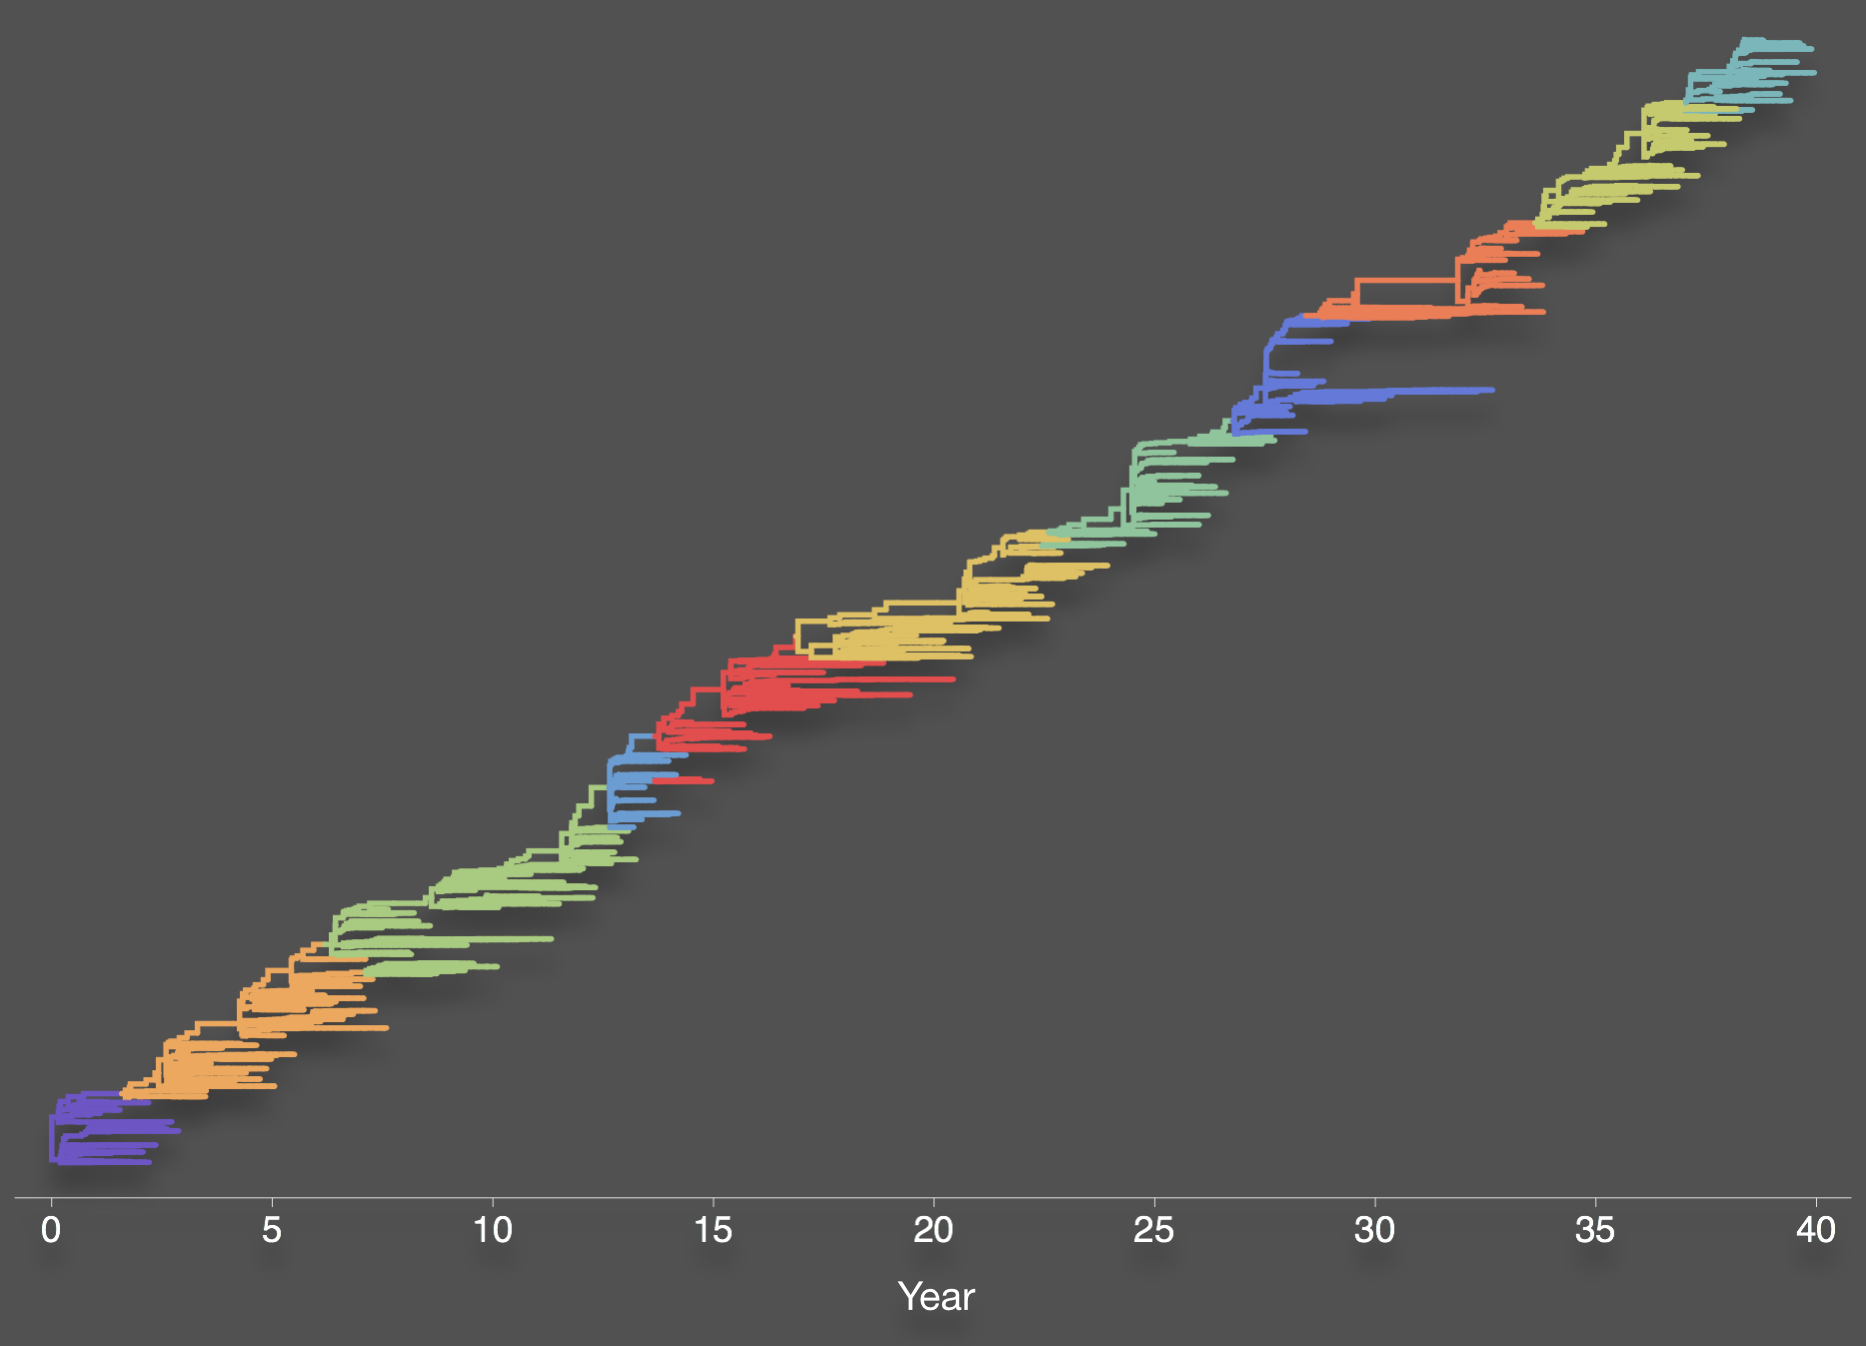
Bedford et al. 2012. BMC Biol.
Mutations connect antigenic phenotypes
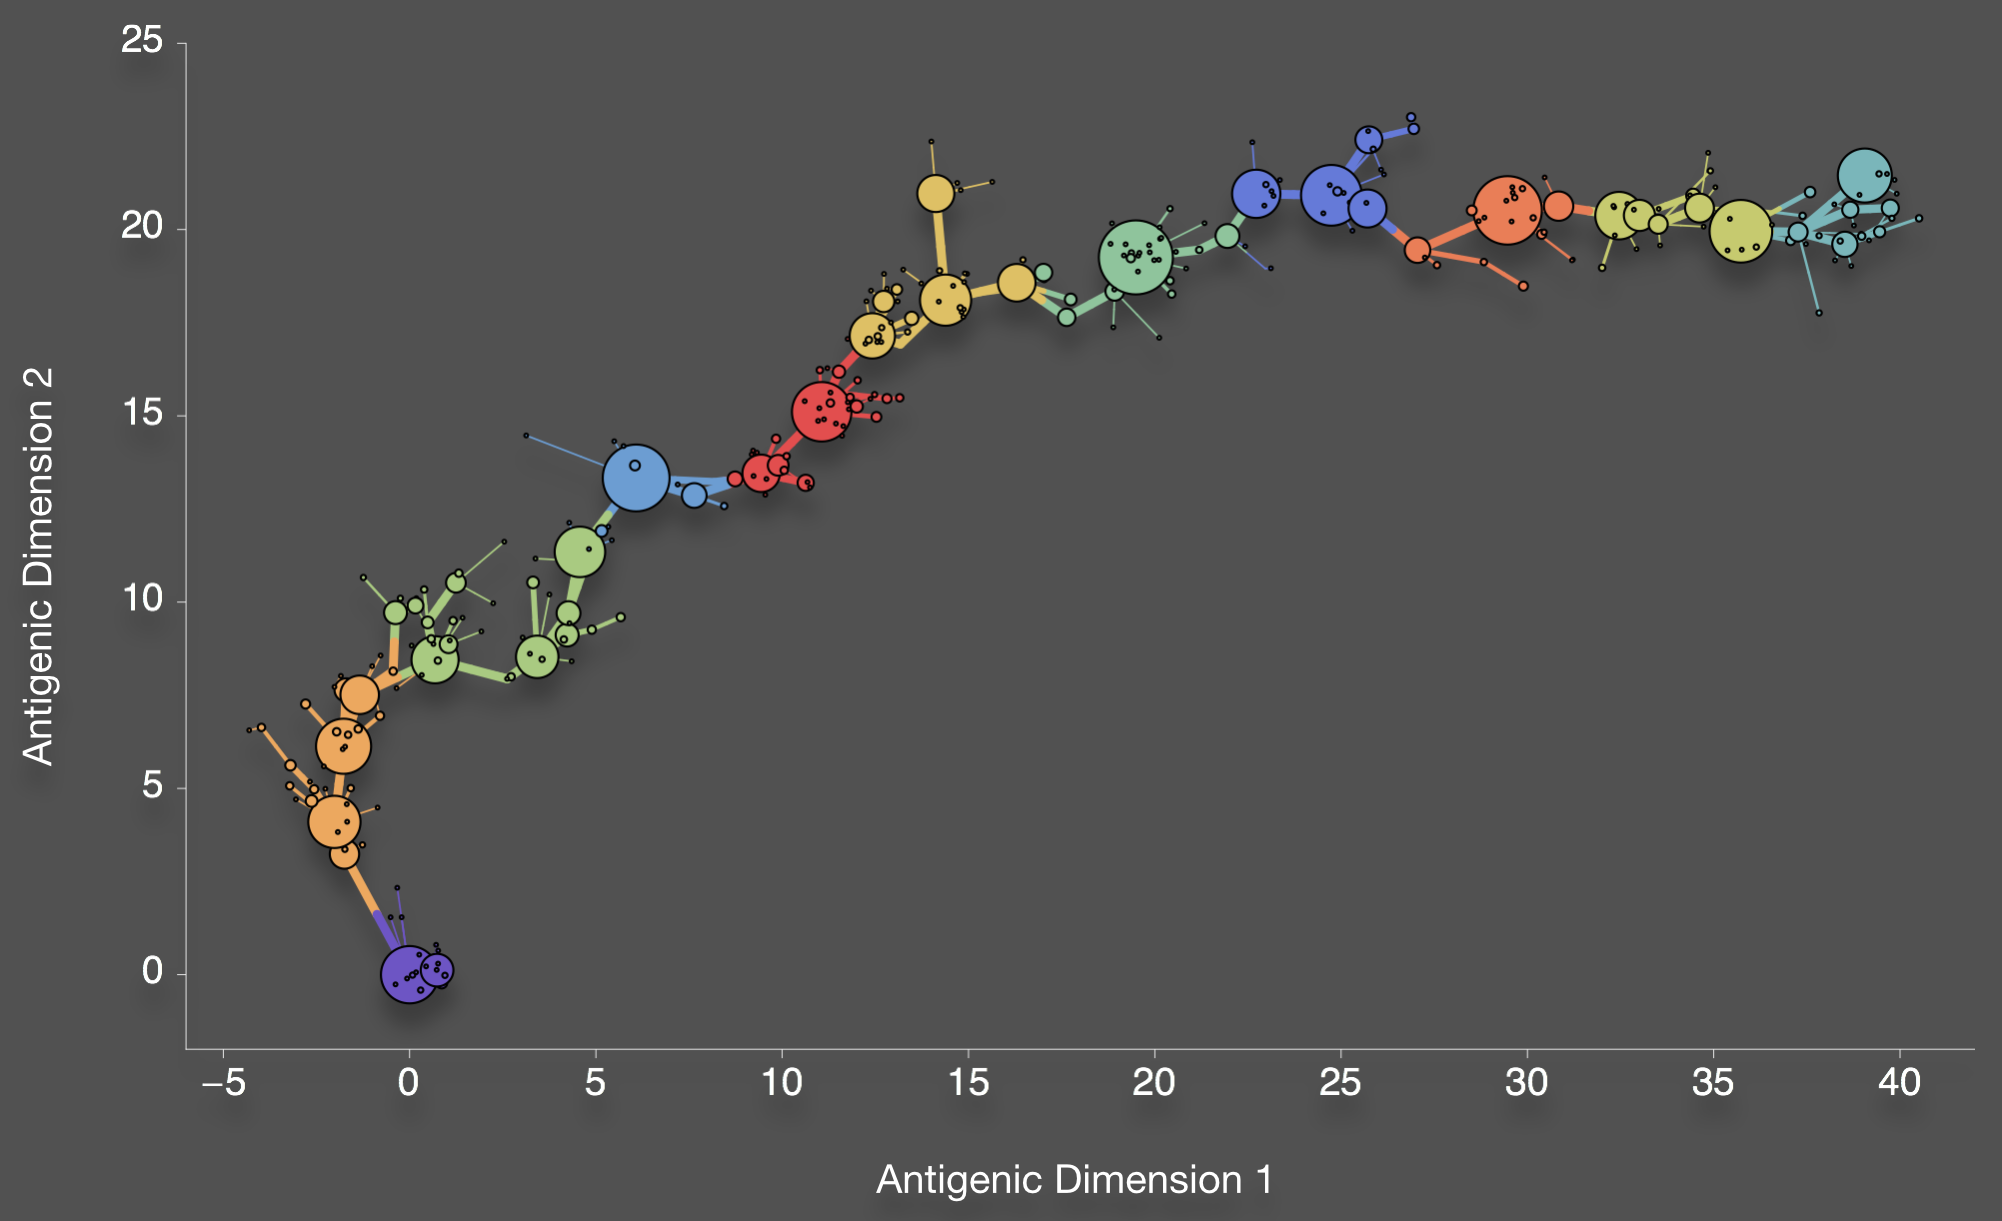
Bedford et al. 2012. BMC Biol.
Population moves up the steepest fitness gradient
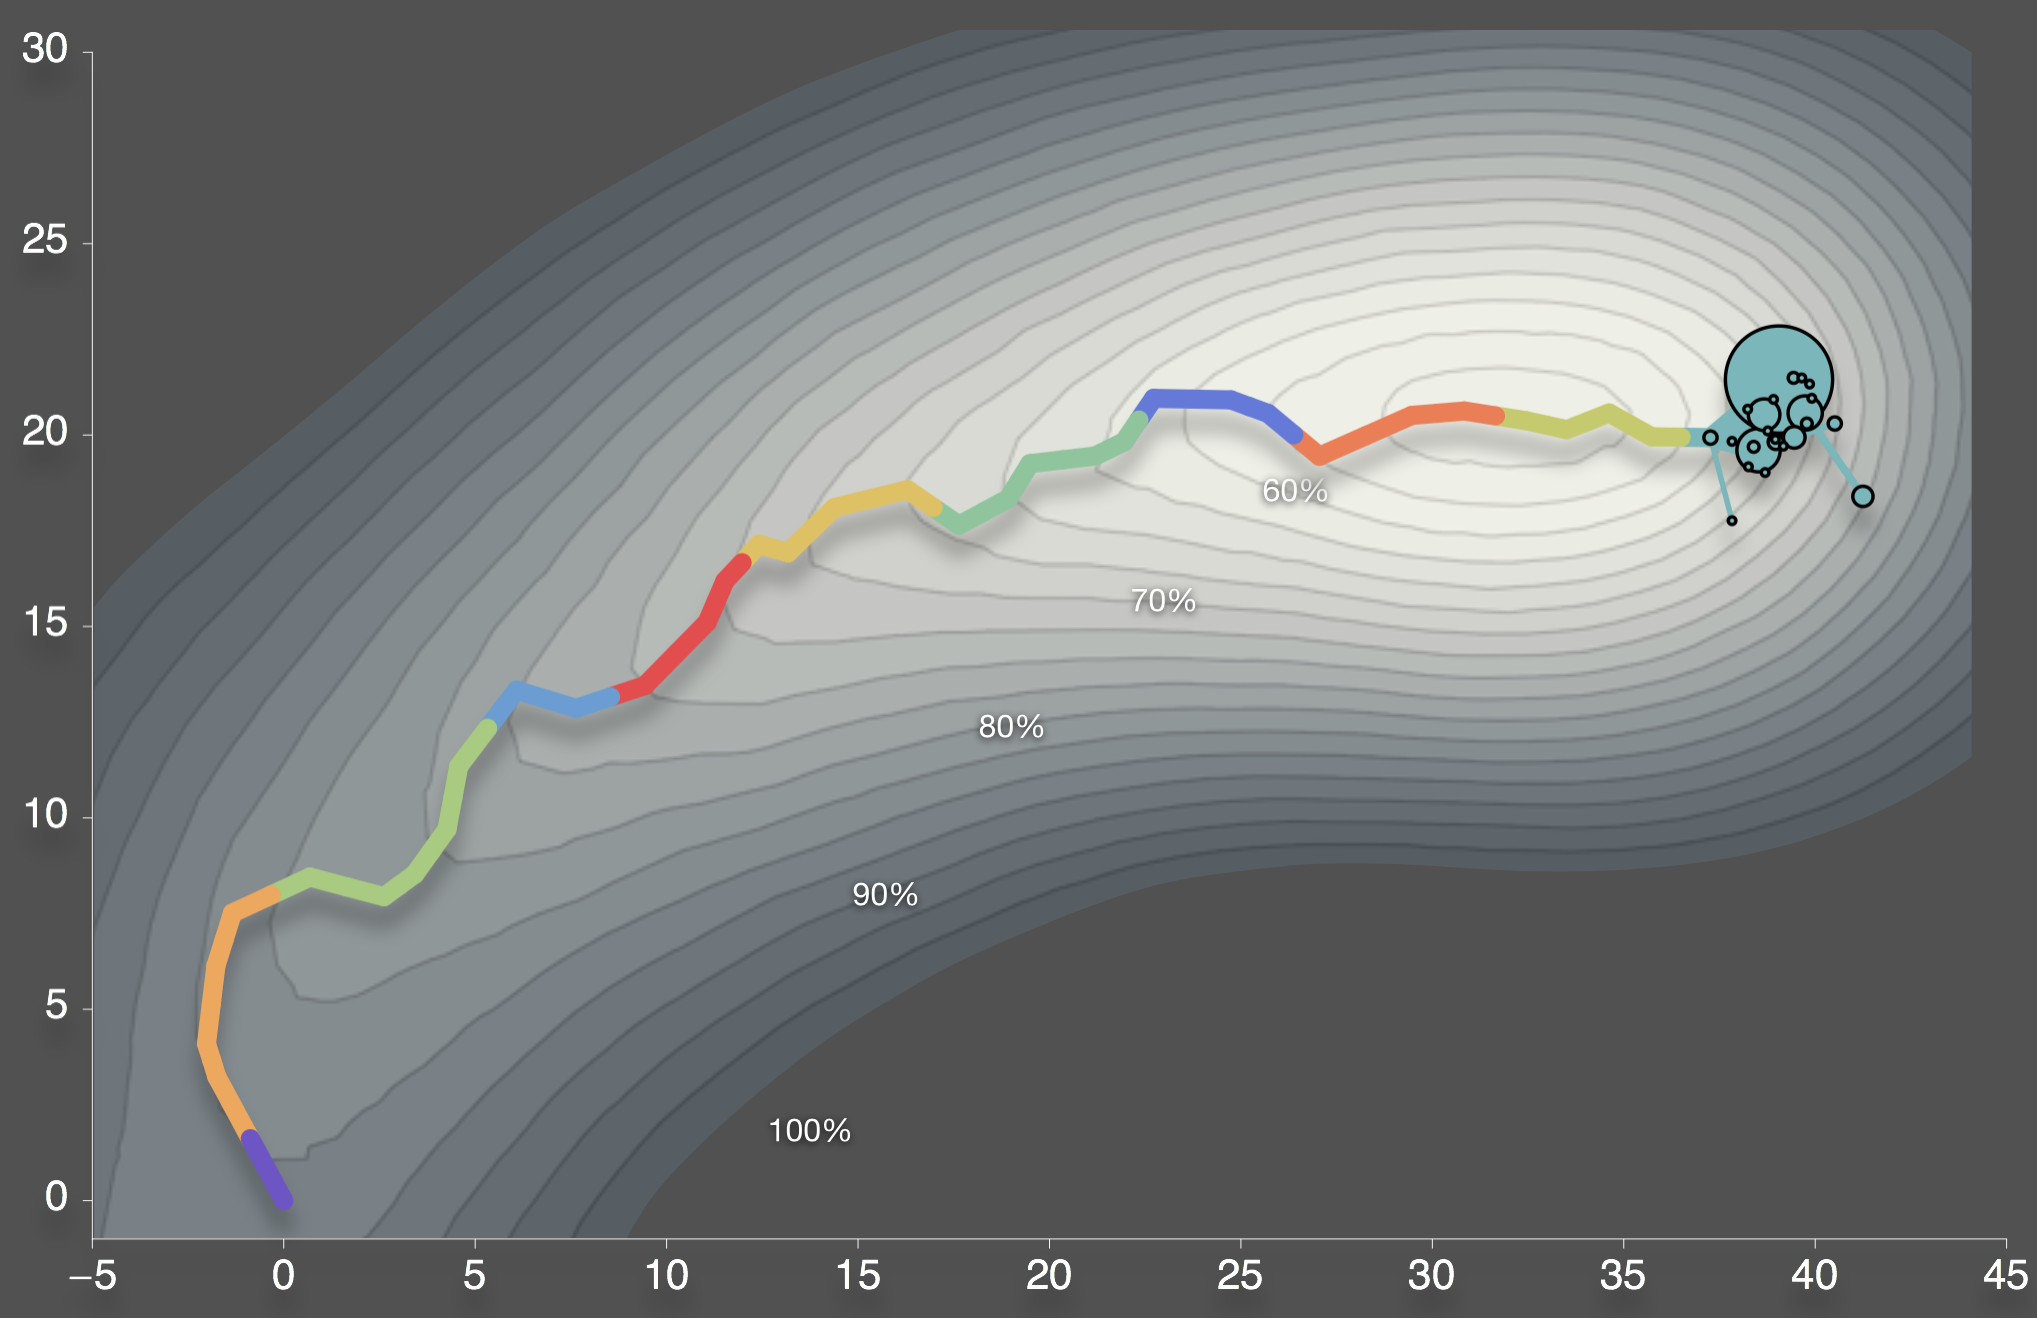
Bedford et al. 2012. BMC Biol.
Best move is a forward move
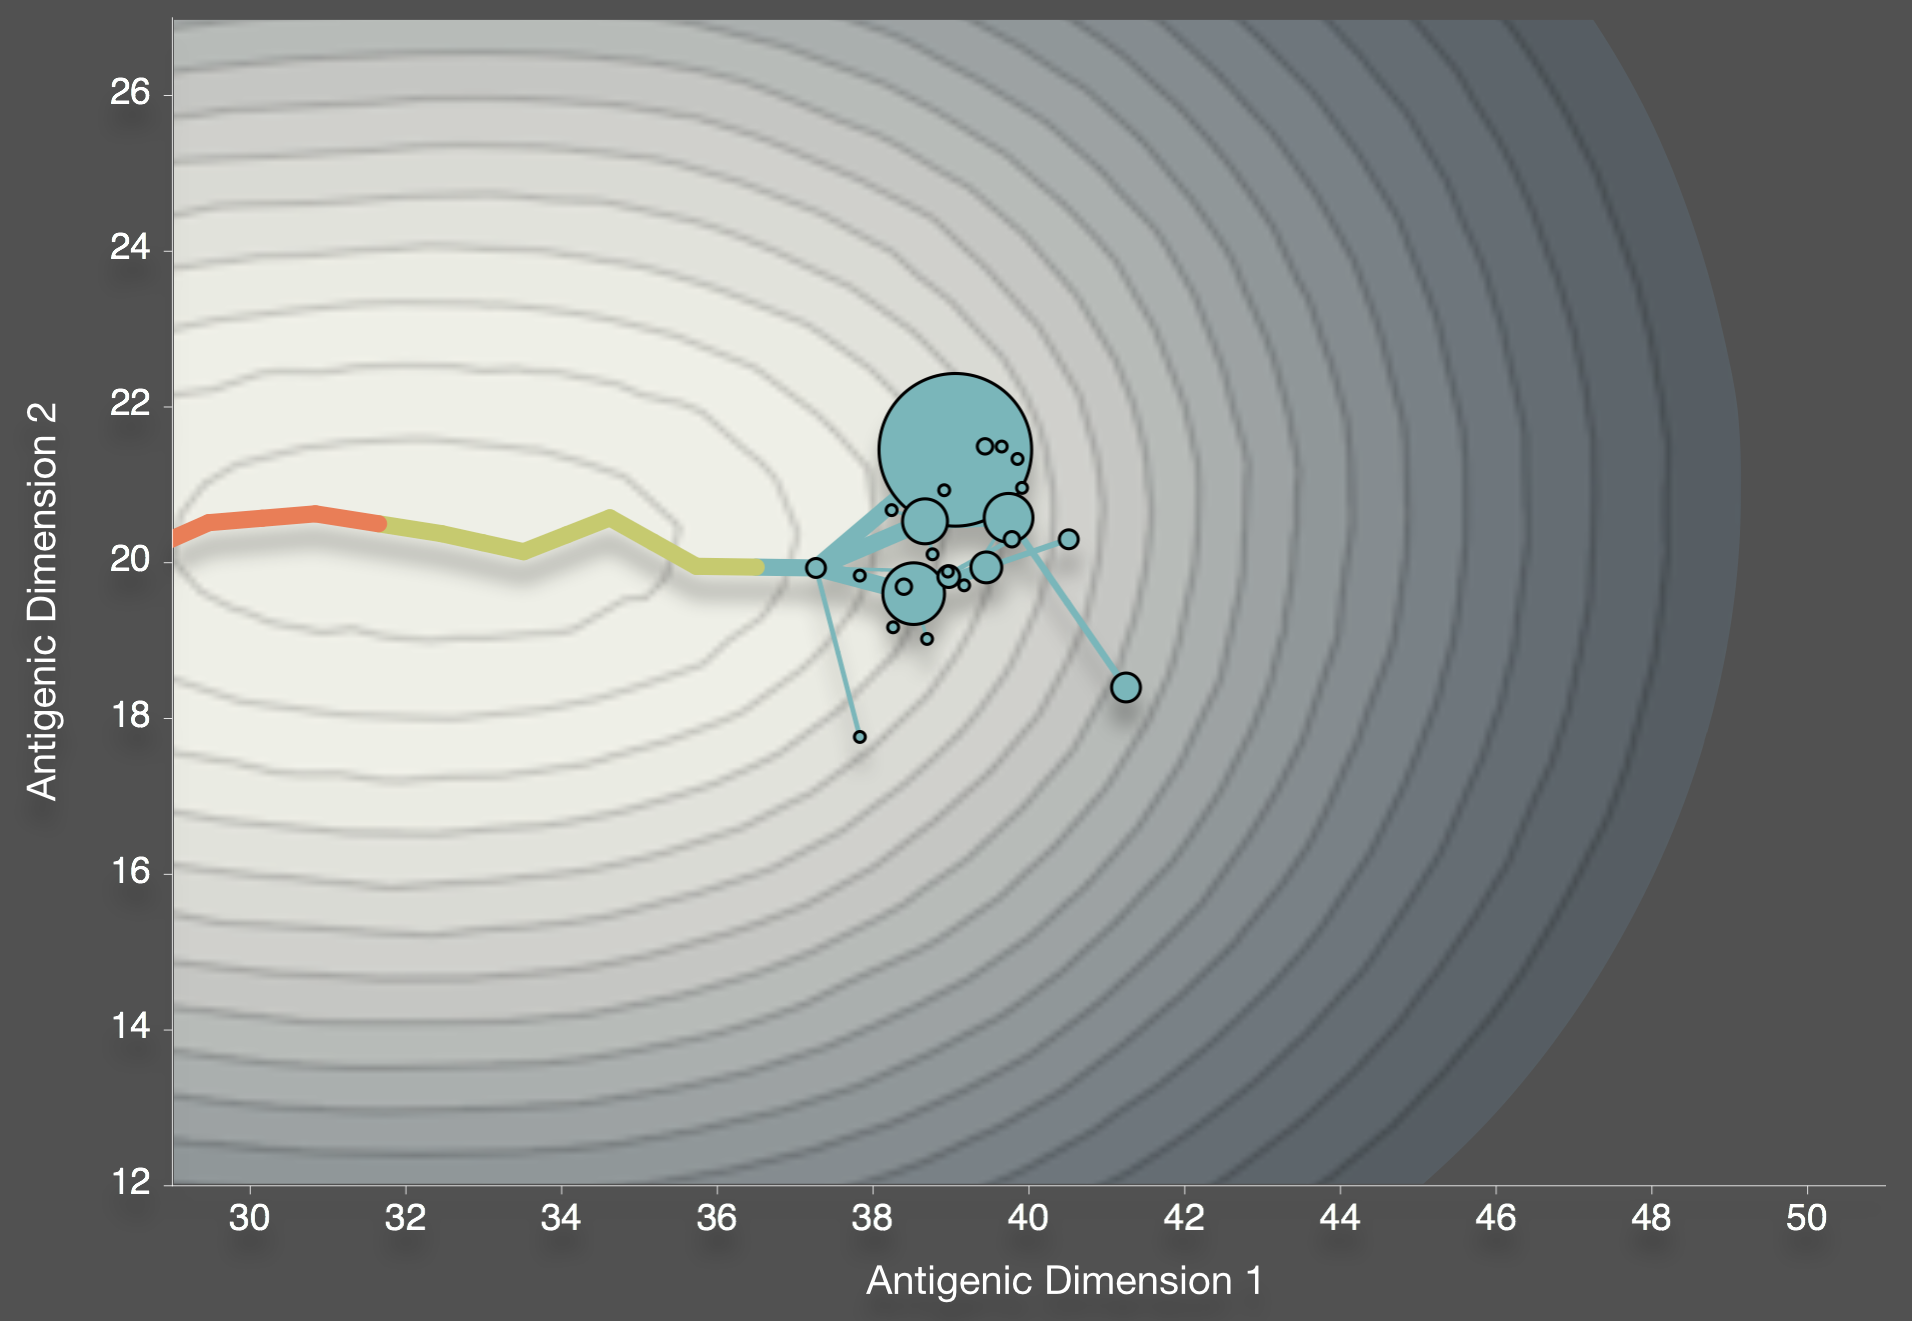
Bedford et al. 2012. BMC Biol.
Results in a canalized trajectory where strains are forced to compete heavily
Limited diversity and strain replacement can result from
- Rare (or constrained) mutations
- "Long distance" interference
Patterns across lineages
Phylogenetic trees of different influenza lineages
Antigenic phenotype across lineages
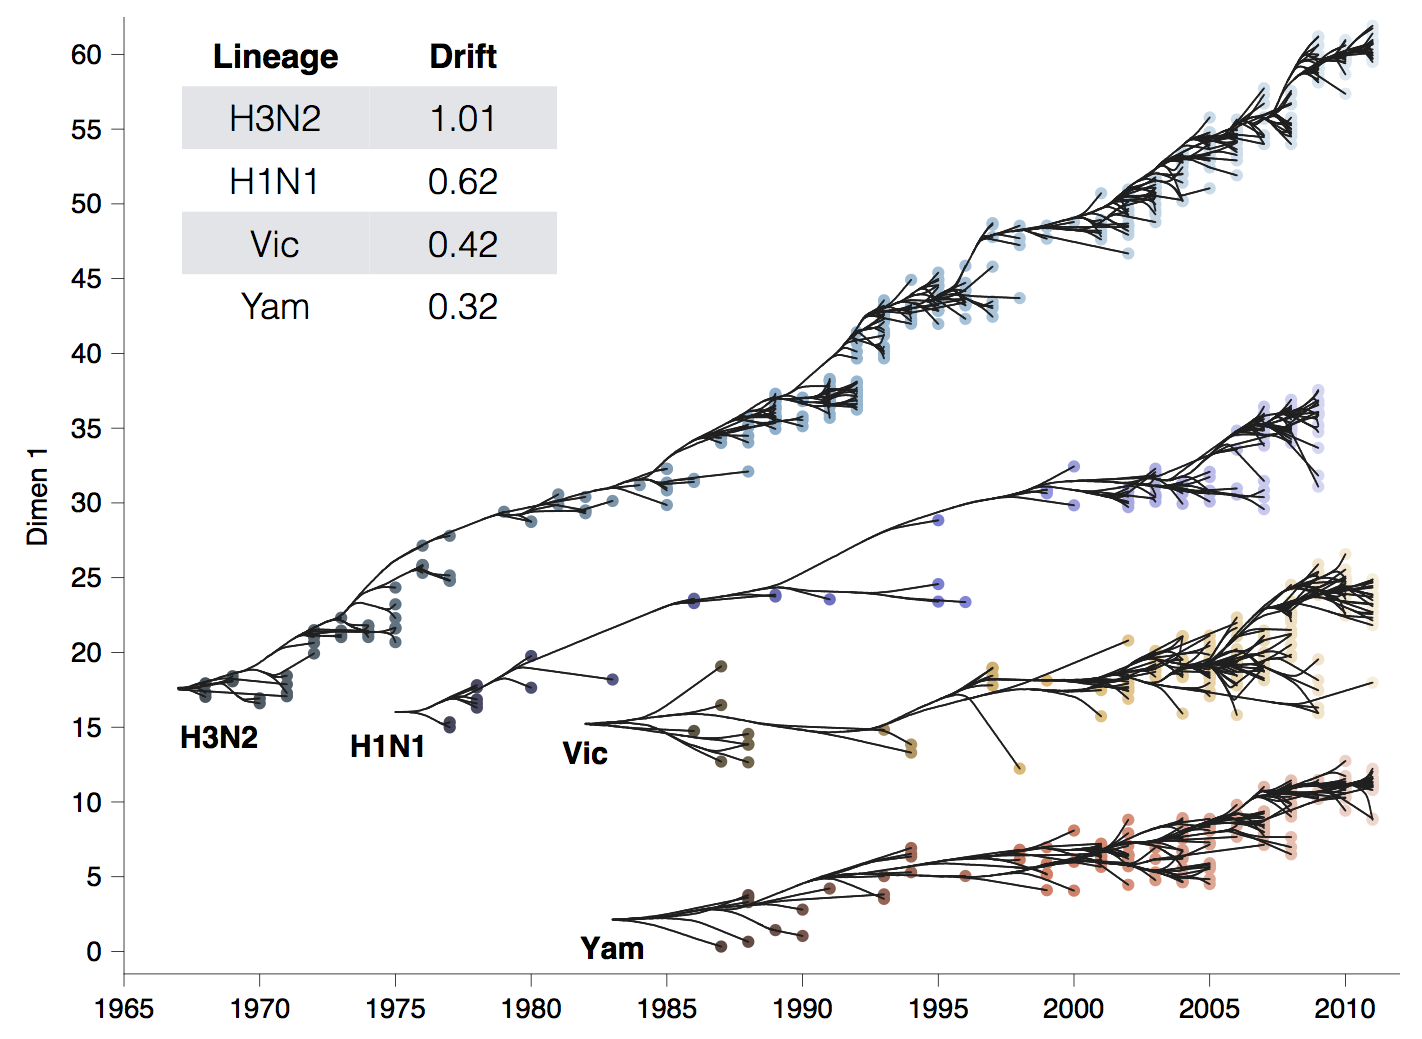
Antigenic drift across lineages
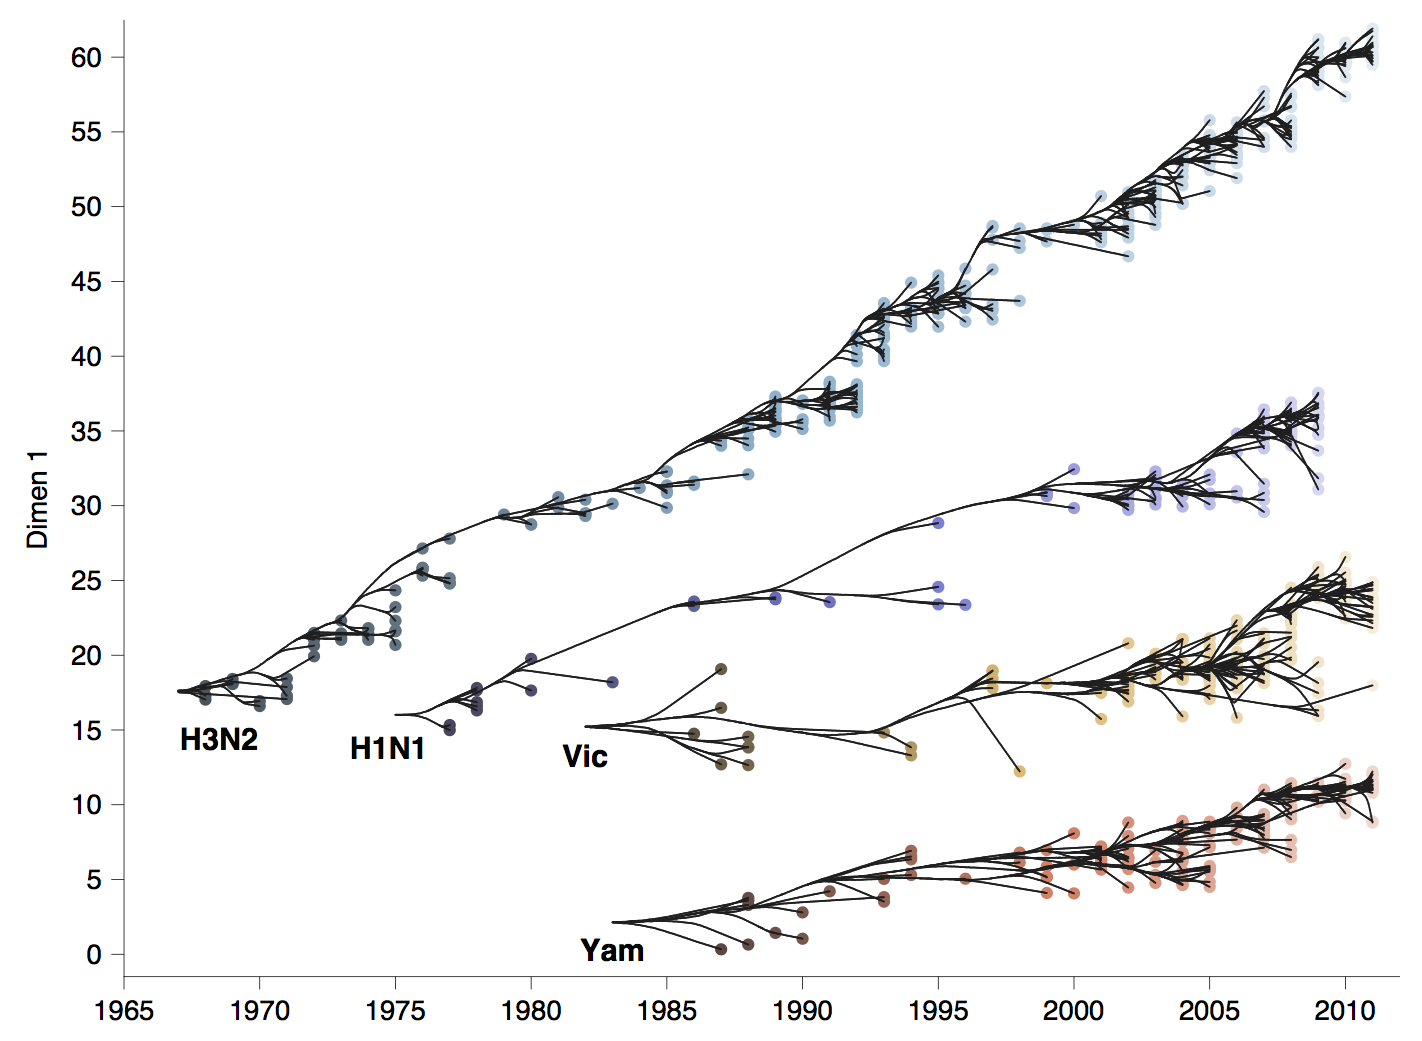
Antigenic drift across lineages
Patterns recapitulated in model
Open questions
Why constant rate despite 2x increase in global population and hugely increased mobility?
What drives different dynamics in different lineages? Why fixed behavior within a lineage?
Why is the only observed bifurcation in flu B?
Acknowledgements
Empirical work: GISRS, GISAID, Richard Neher, Andrew Rambaut, Colin Russell, Marc Suchard, Philippe Lemey, Derek Smith, John McCauley
Modeling work: Mercedes Pascual, Andrew Rambaut, Sarah Cobey