Genomic tracking of SARS-CoV-2 evolution and spread
Trevor Bedford (@trvrb)
Associate Professor, Fred Hutchinson Cancer Research Center
20 Oct 2020
AMD Virtual
CDC
Slides at: bedford.io/talks
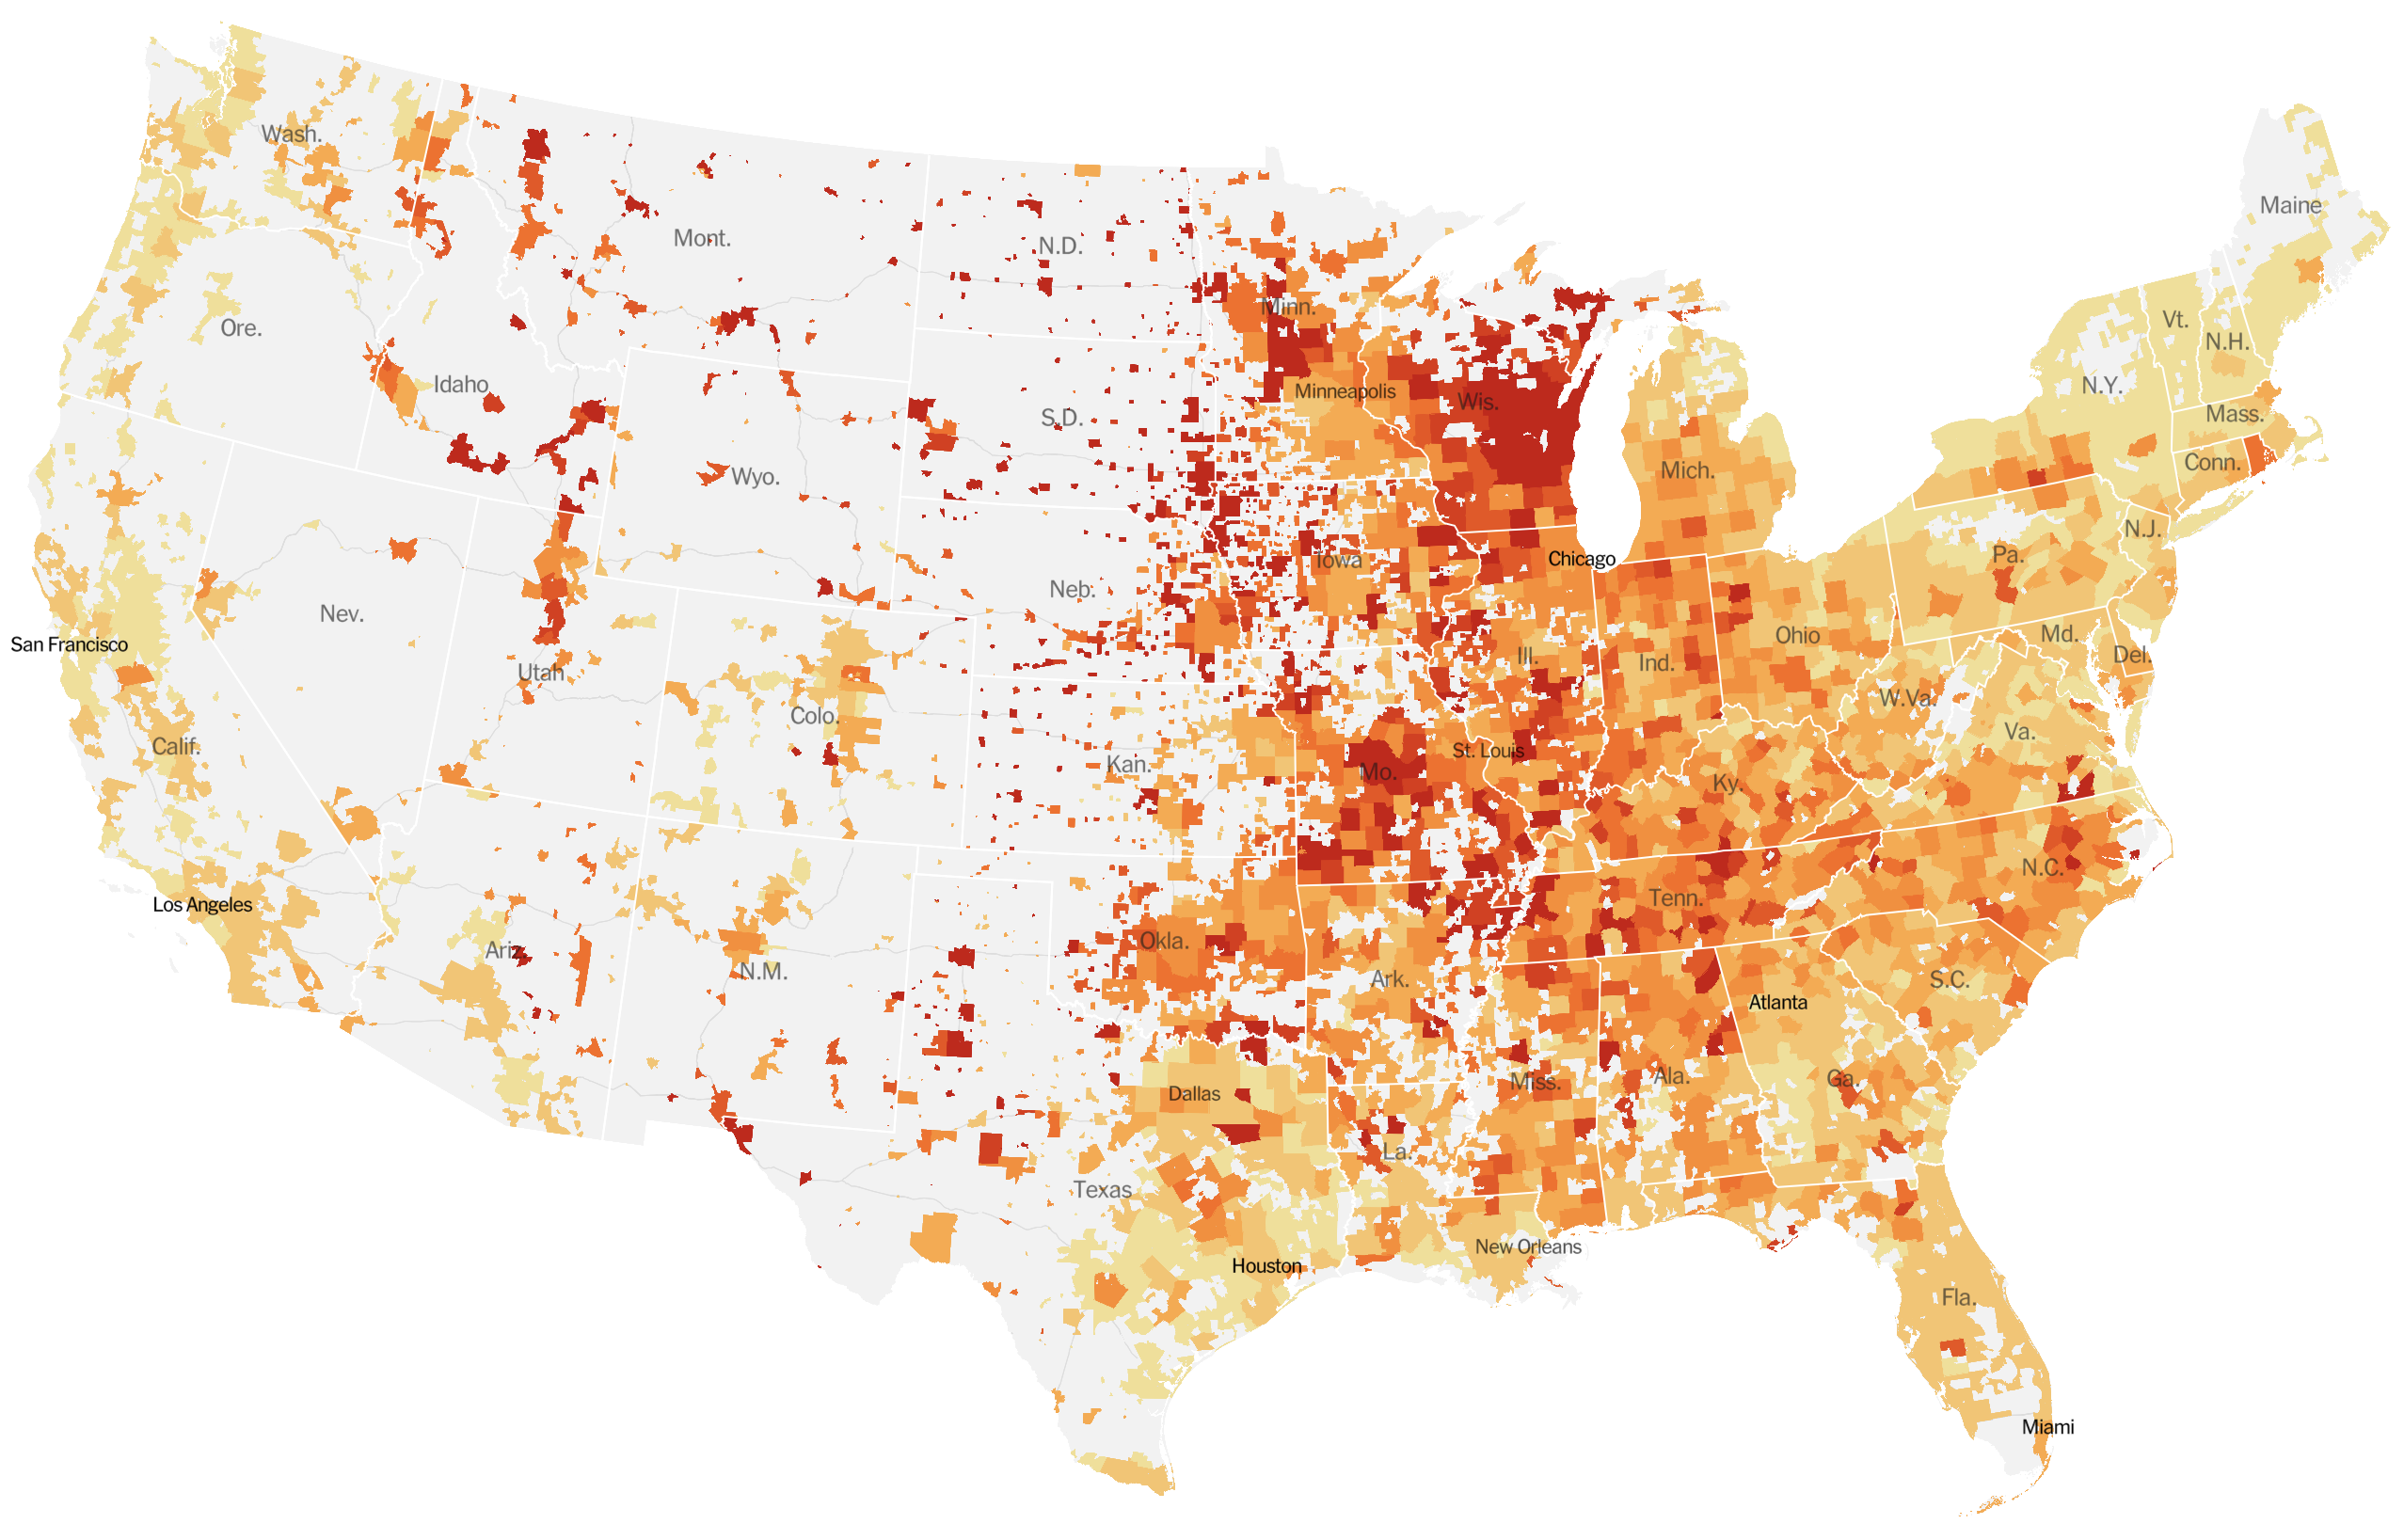
Significant fog of war. Genomic approaches offer orthogonal data source to understand the pandemic.
Epidemic process
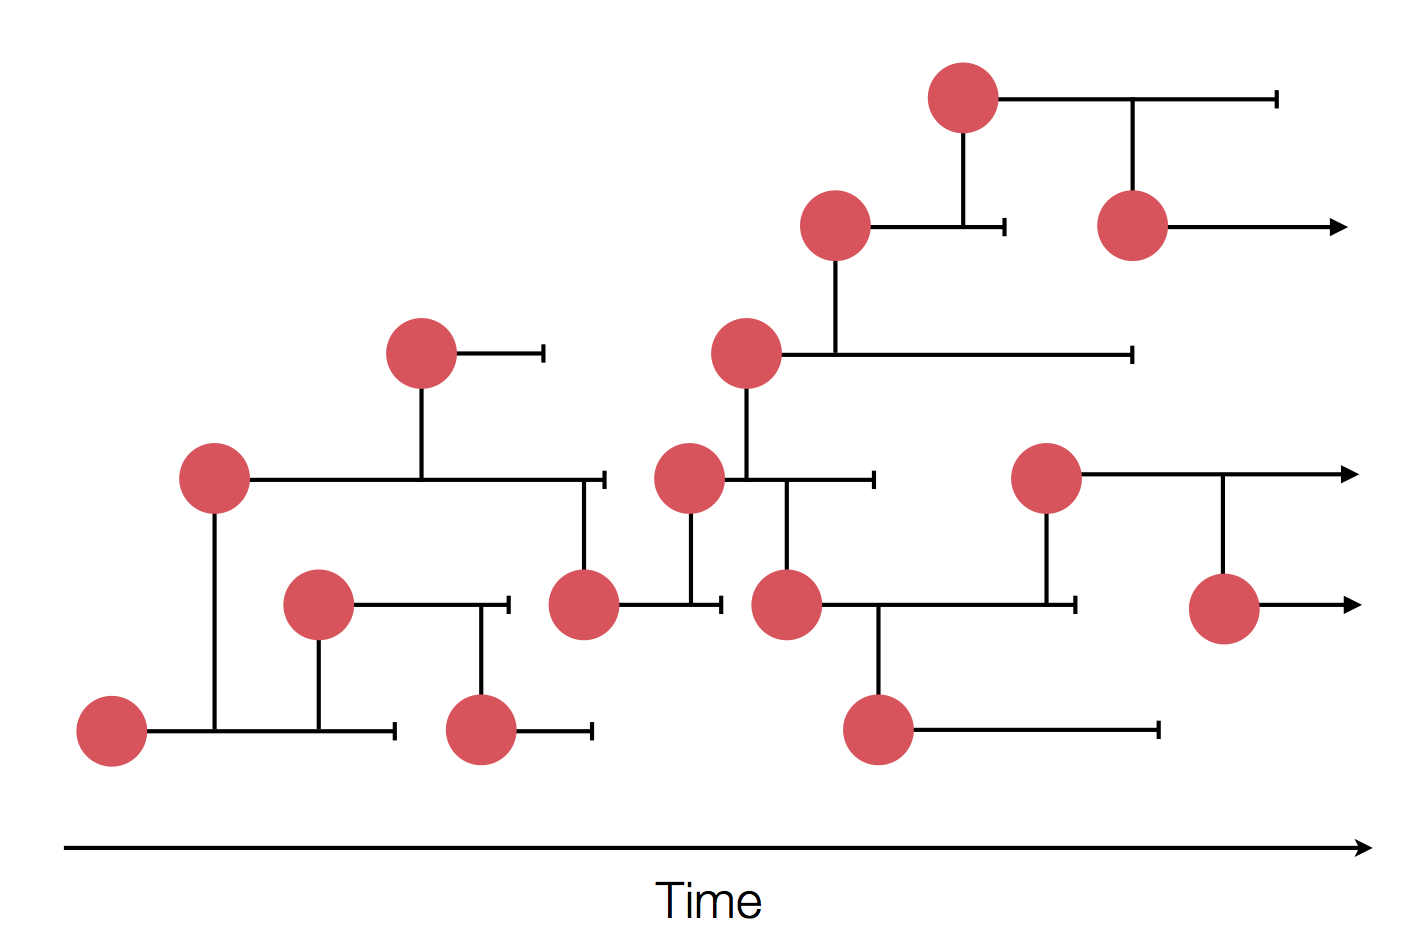
Sample some individuals
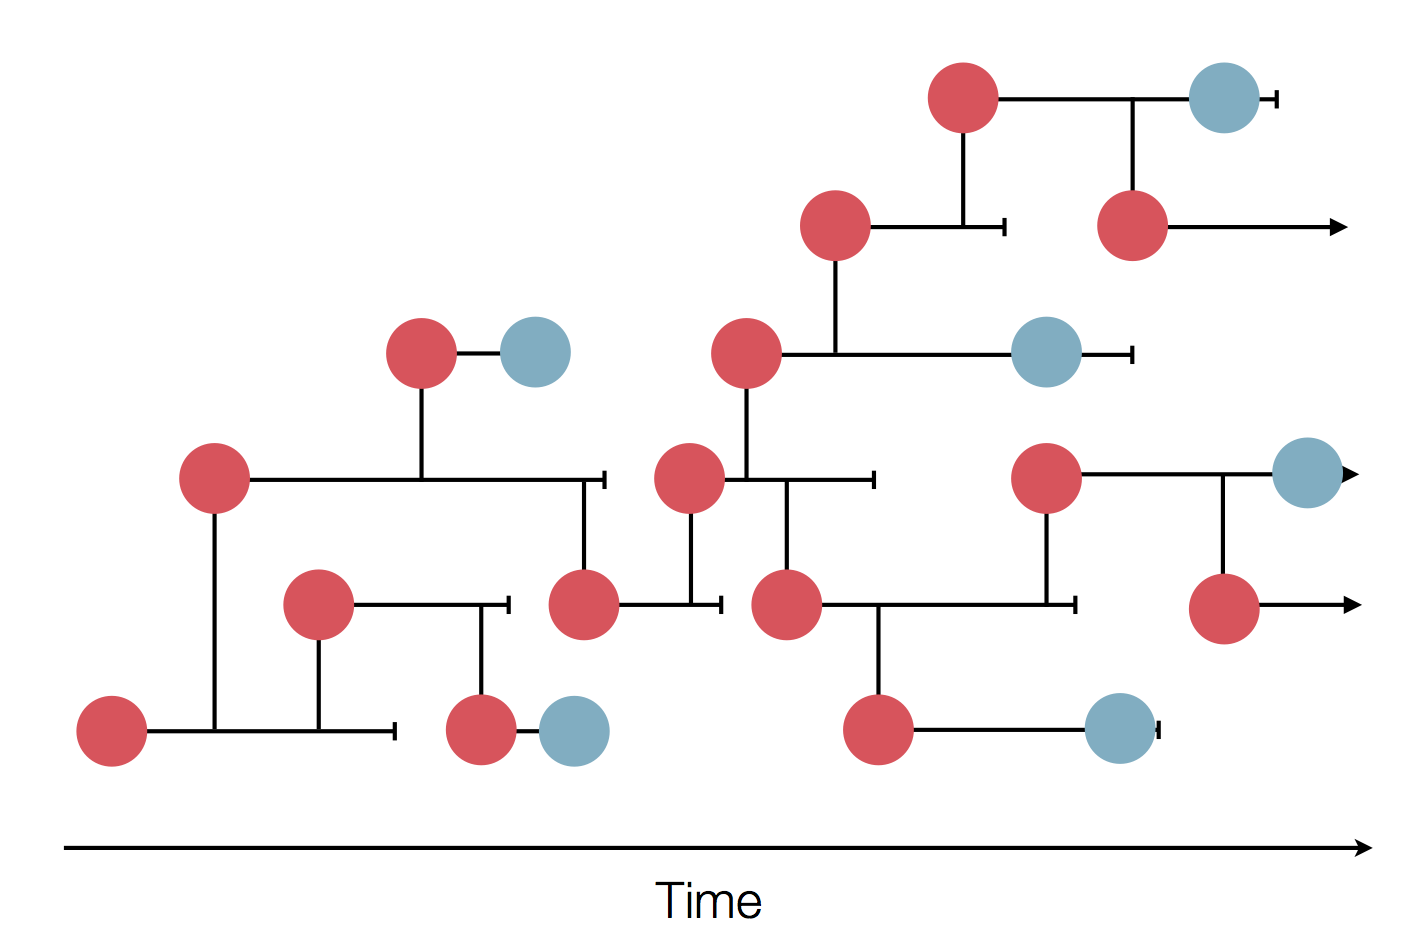
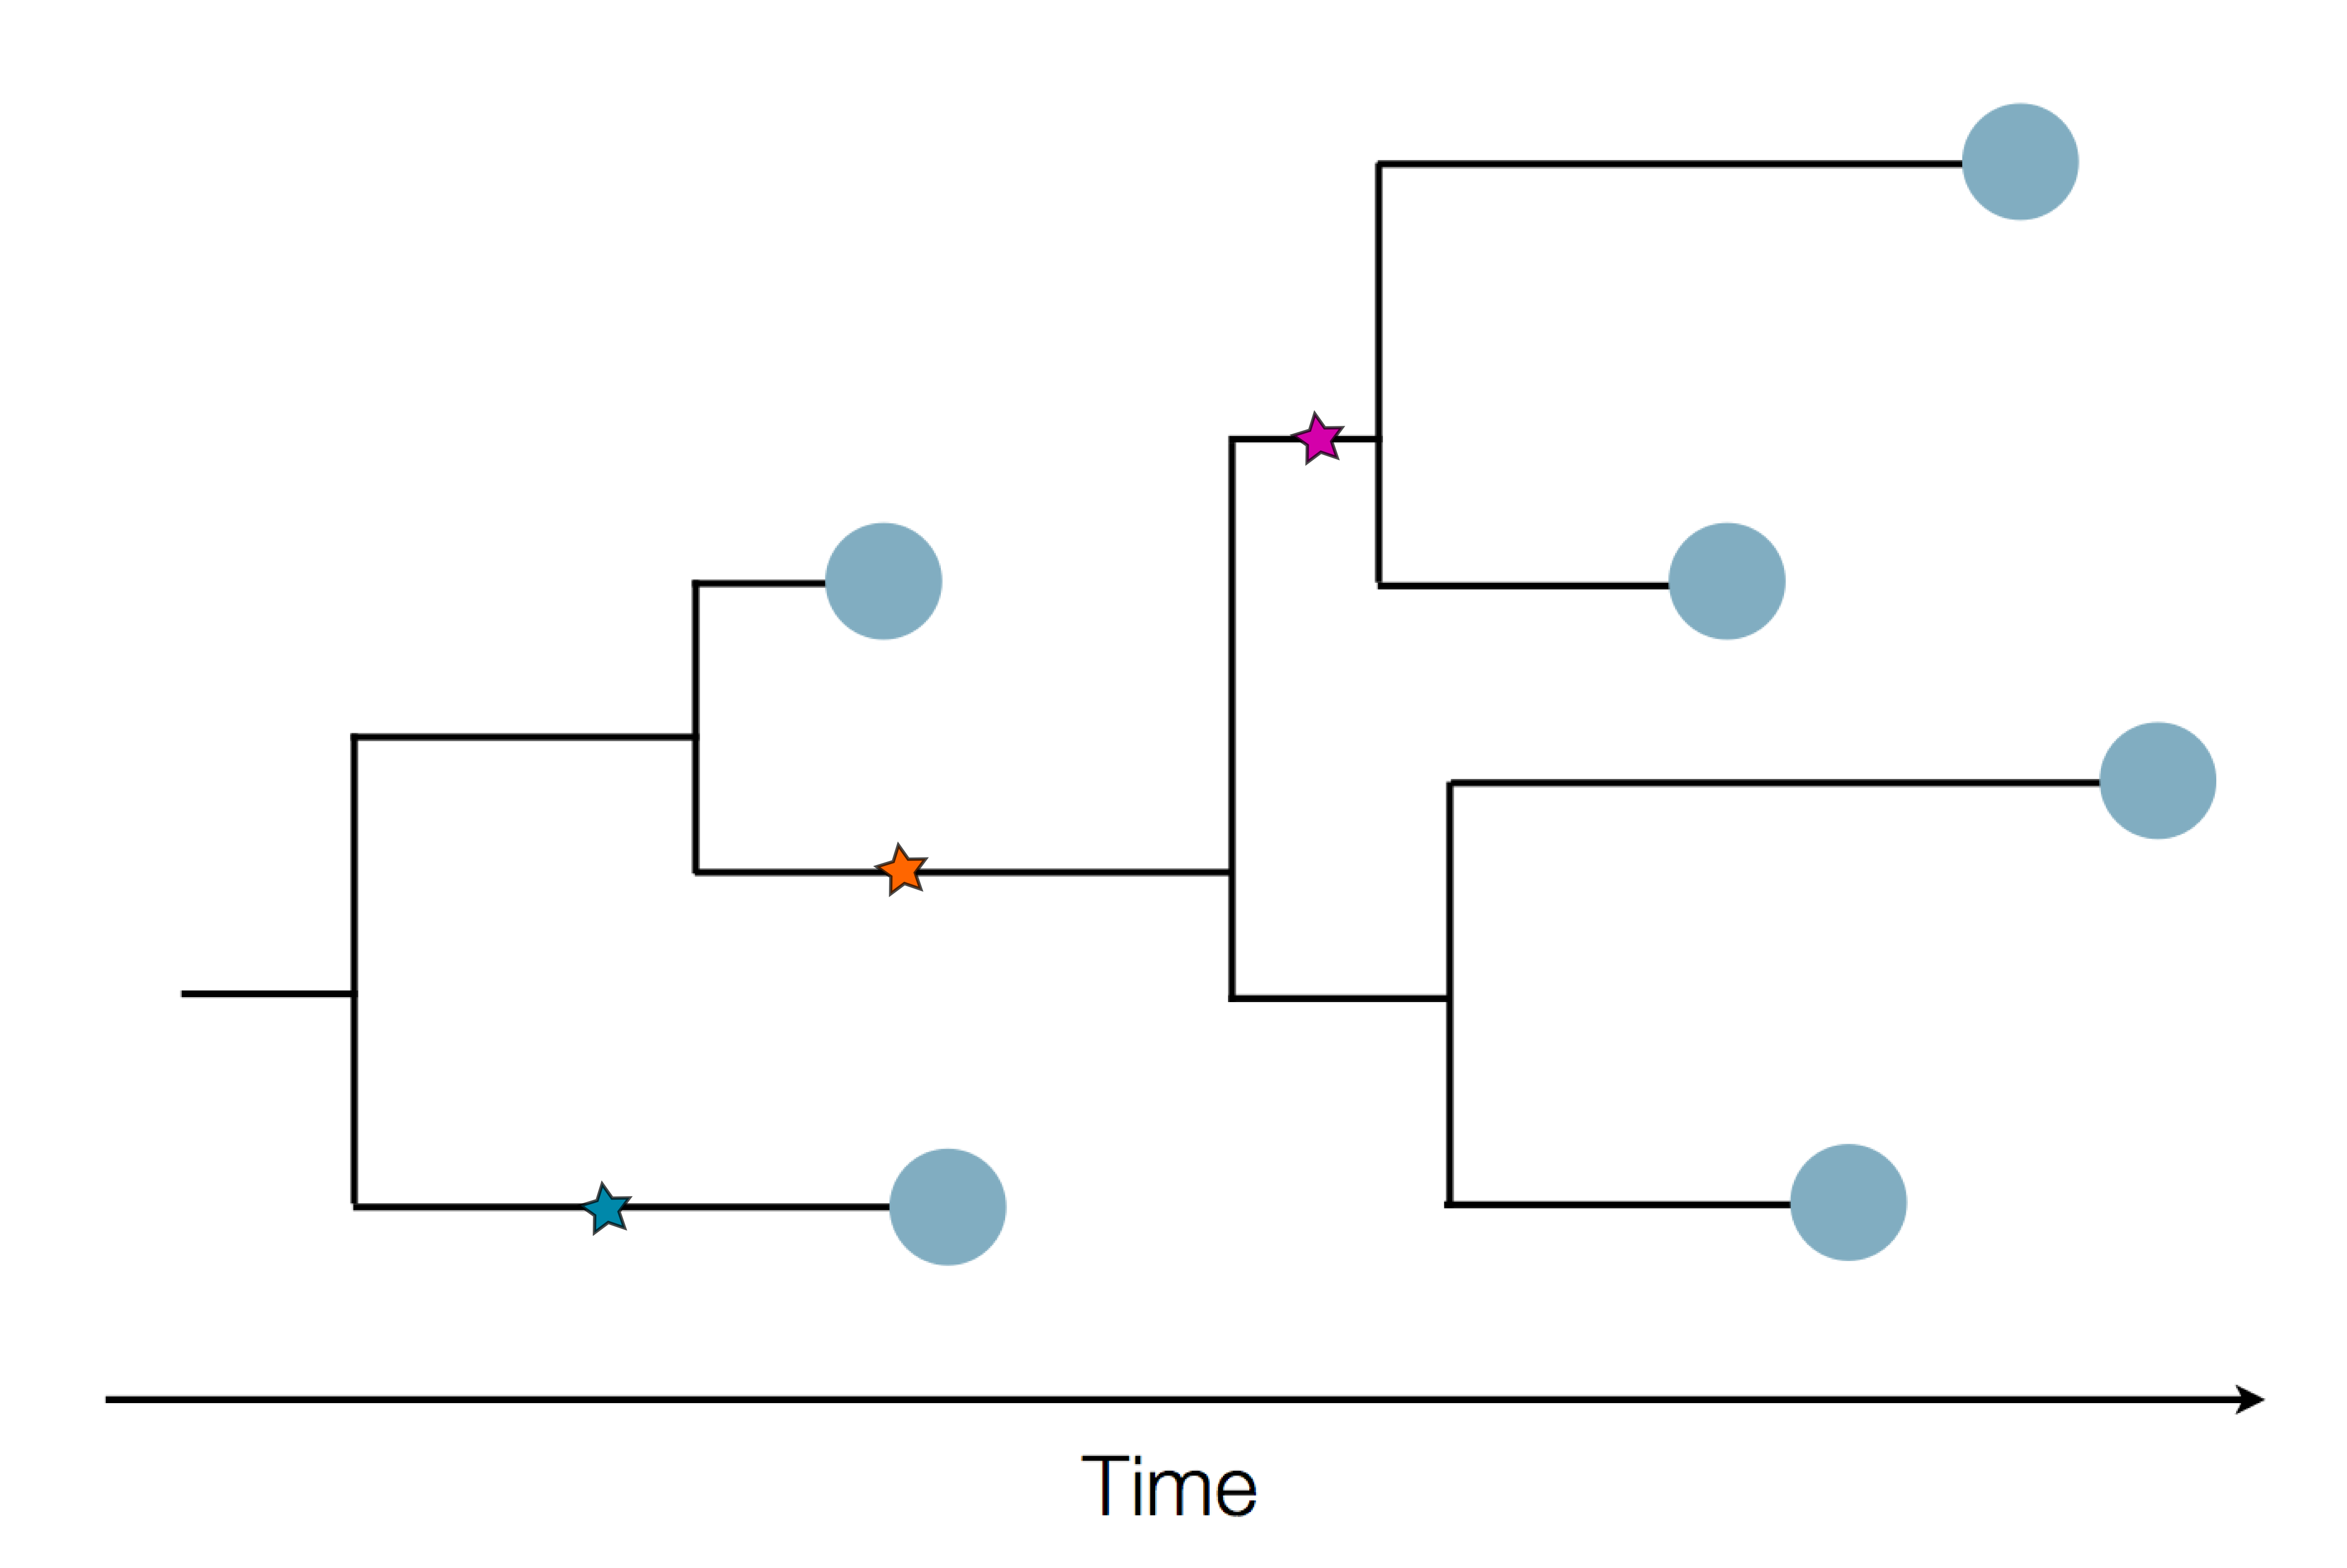
Sequence and determine phylogeny
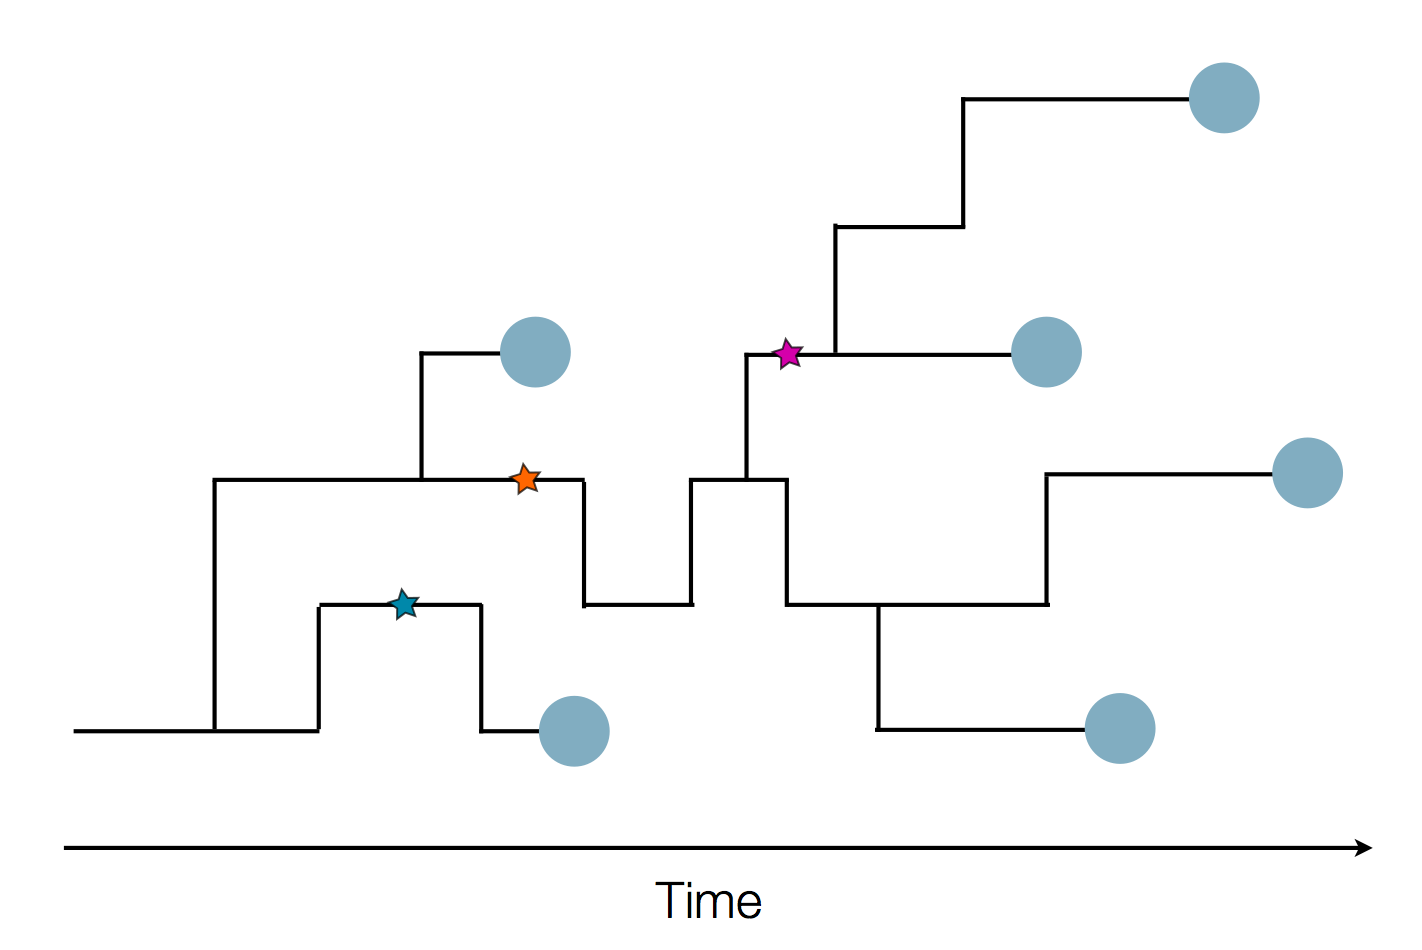
Sequence and determine phylogeny
Outline
- Genomic epidemiology of SARS-CoV-2
- Nextstrain platform for real-time phylodynamics
Detection and sequencing of SARS-CoV-2 in January
Jan 11: First five genomes showed that the outbreak was caused by a novel SARS-like coronavirus
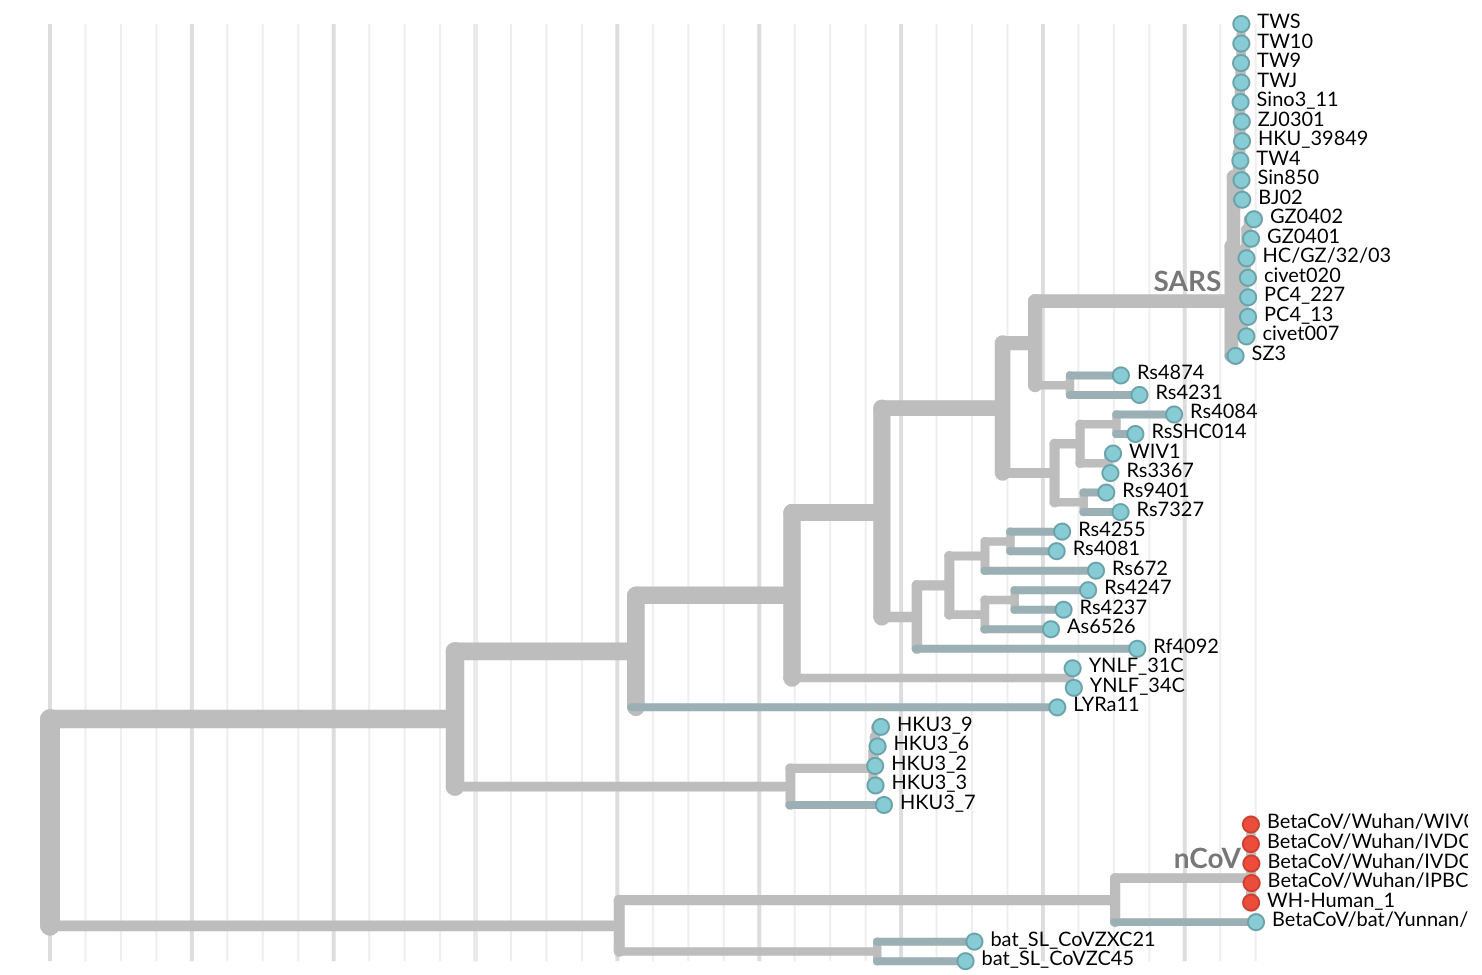
Jan 19: First 12 genomes from Wuhan and Bangkok lack genetic diversity
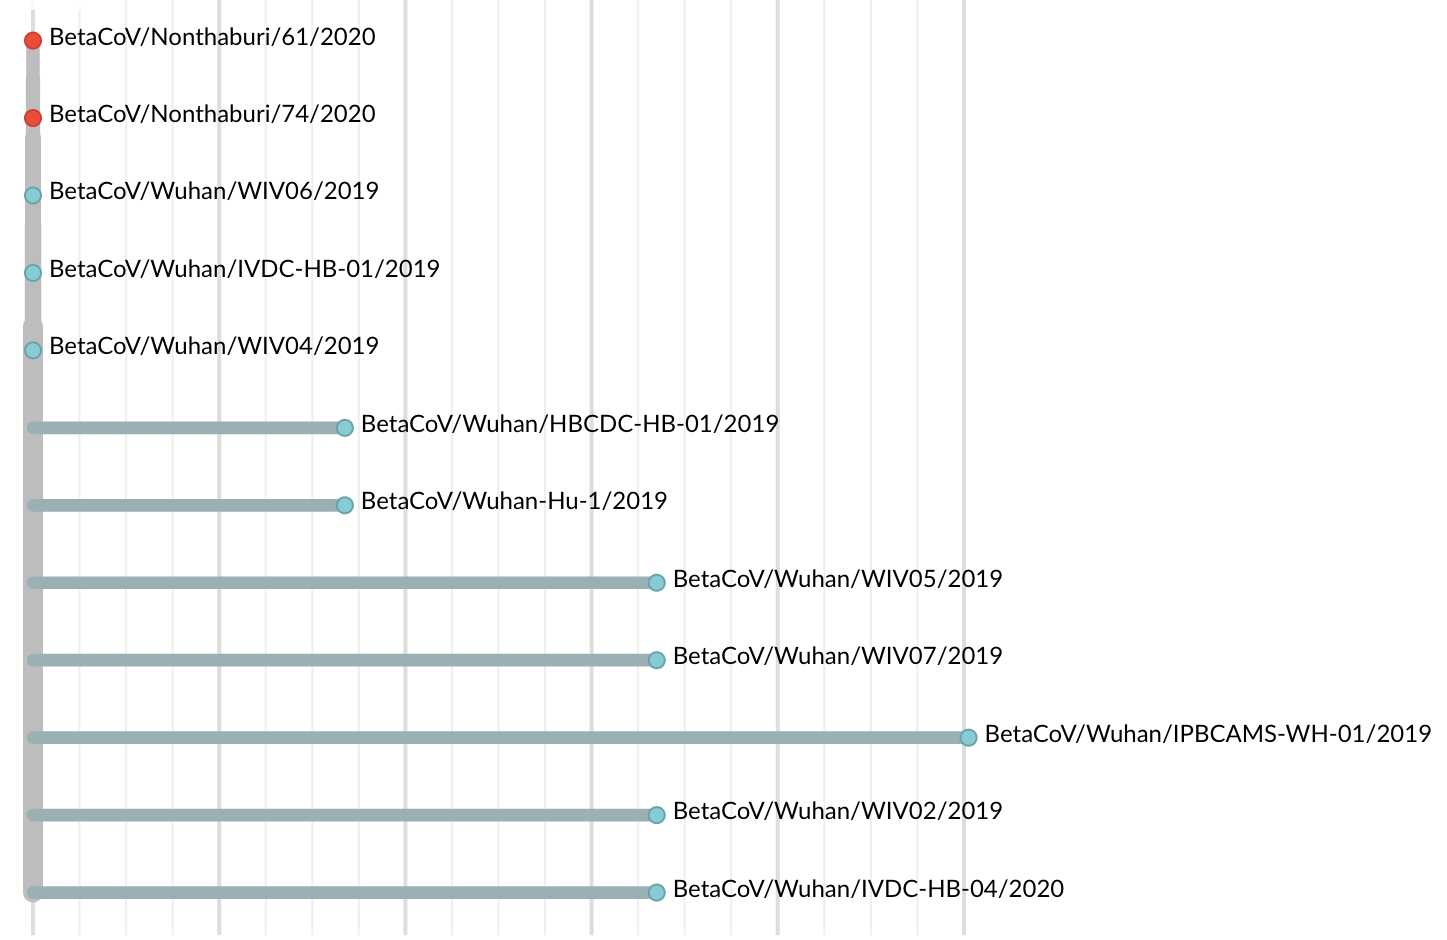
Single introduction into the human population between Nov 15 and Dec 15 and human-to-human epidemic spread from this point forward
😧
Spent the week of Jan 20 alerting public health officials, and since then have aimed to keep nextstrain.org up-to-date
Nextstrain
Project to conduct real-time genomic epidemiology and evolutionary analysis of emerging epidemics
with
![]() Richard Neher,
Richard Neher,
![]() James Hadfield,
James Hadfield,
![]() Emma Hodcroft,
Emma Hodcroft,
![]() Thomas Sibley,
Thomas Sibley,
![]() John Huddleston,
John Huddleston,
![]() Louise Moncla,
Louise Moncla,
![]() Cassia Wagner,
Cassia Wagner,
![]() Ivan Aksamentov,
Ivan Aksamentov,
![]() Moira Zuber,
Moira Zuber,
![]() Eli Harkins,
Eli Harkins,
![]() Misja Ilcisin,
Misja Ilcisin,
![]() Kairsten Fay,
Kairsten Fay,
![]() Jover Lee,
Jover Lee,
![]() Allison Black,
Allison Black,
![]() Miguel Paredes,
Miguel Paredes,
![]() Sidney Bell,
Sidney Bell,
![]() Colin Megill
Colin Megill
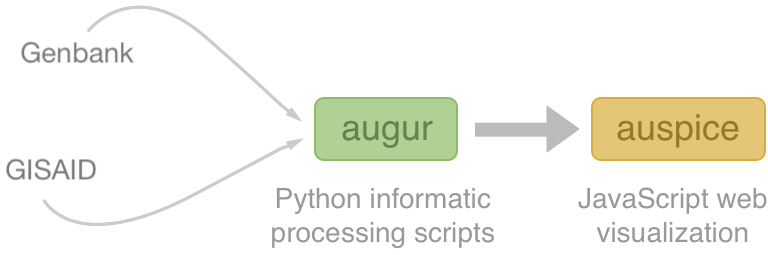
Nextstrain architecture
All code open source at github.com/nextstrain
Two central aims: (1) rapid and flexible phylodynamic analysis and
(2) interactive visualization
Rapid build pipeline for 3000 SARS-CoV-2 genomes (timings are for a laptop)
- Align with MAFFT (~20 min)
- Build ML tree with IQTREE (~40 min)
- Temporally resolve tree and geographic ancestry with TreeTime (~50 min)
- Total pipeline (~2 hr)
Current data flow for SARS-CoV-2
- Labs contribute directly to GISAID (now have >150k full genomes)
- Nextstrain pulls a complete dataset from GISAID every 24 hours
- This triggers an automatic rebuild on Amazon Web Services
- We manually update new lat/longs, etc...
- We push this build online to nextstrain.org and tweet the update from @nextstrain
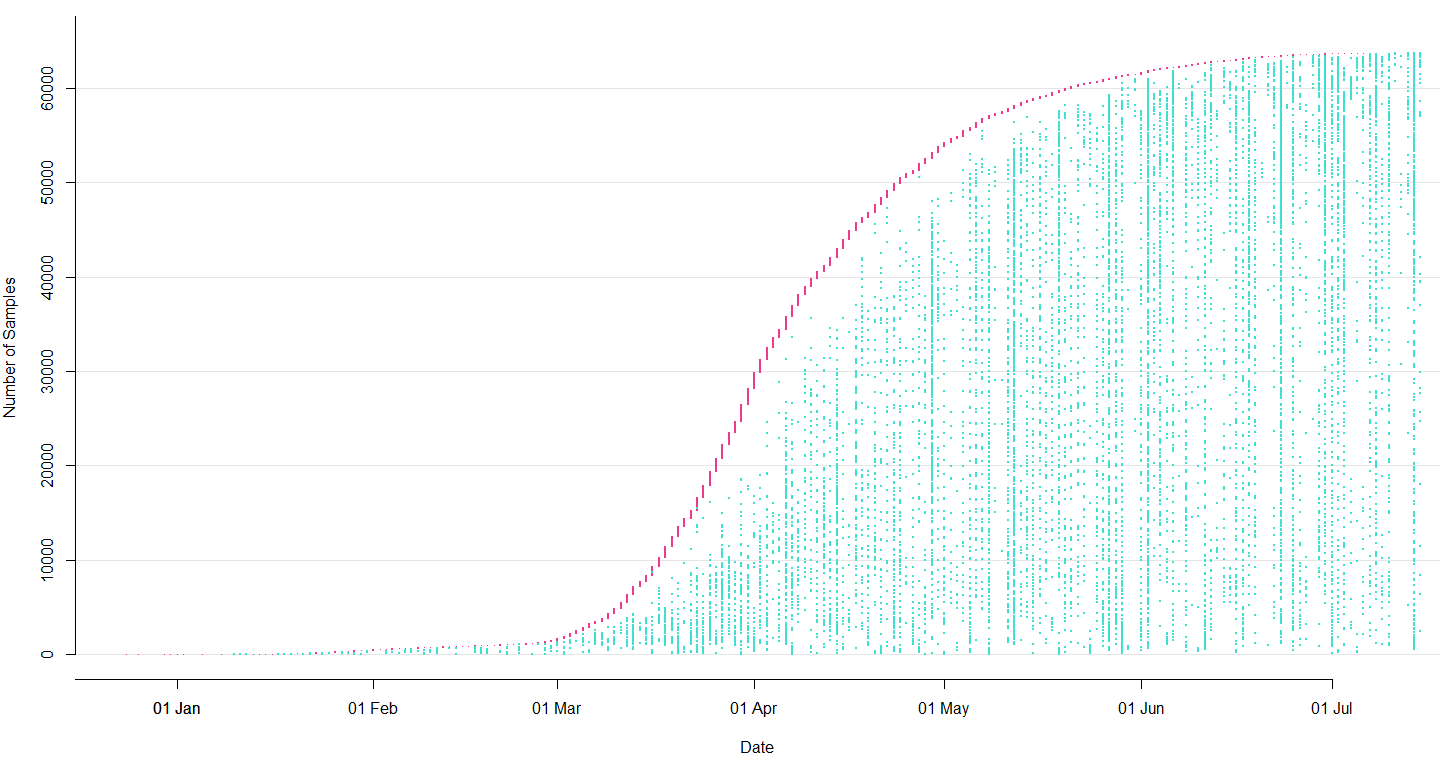
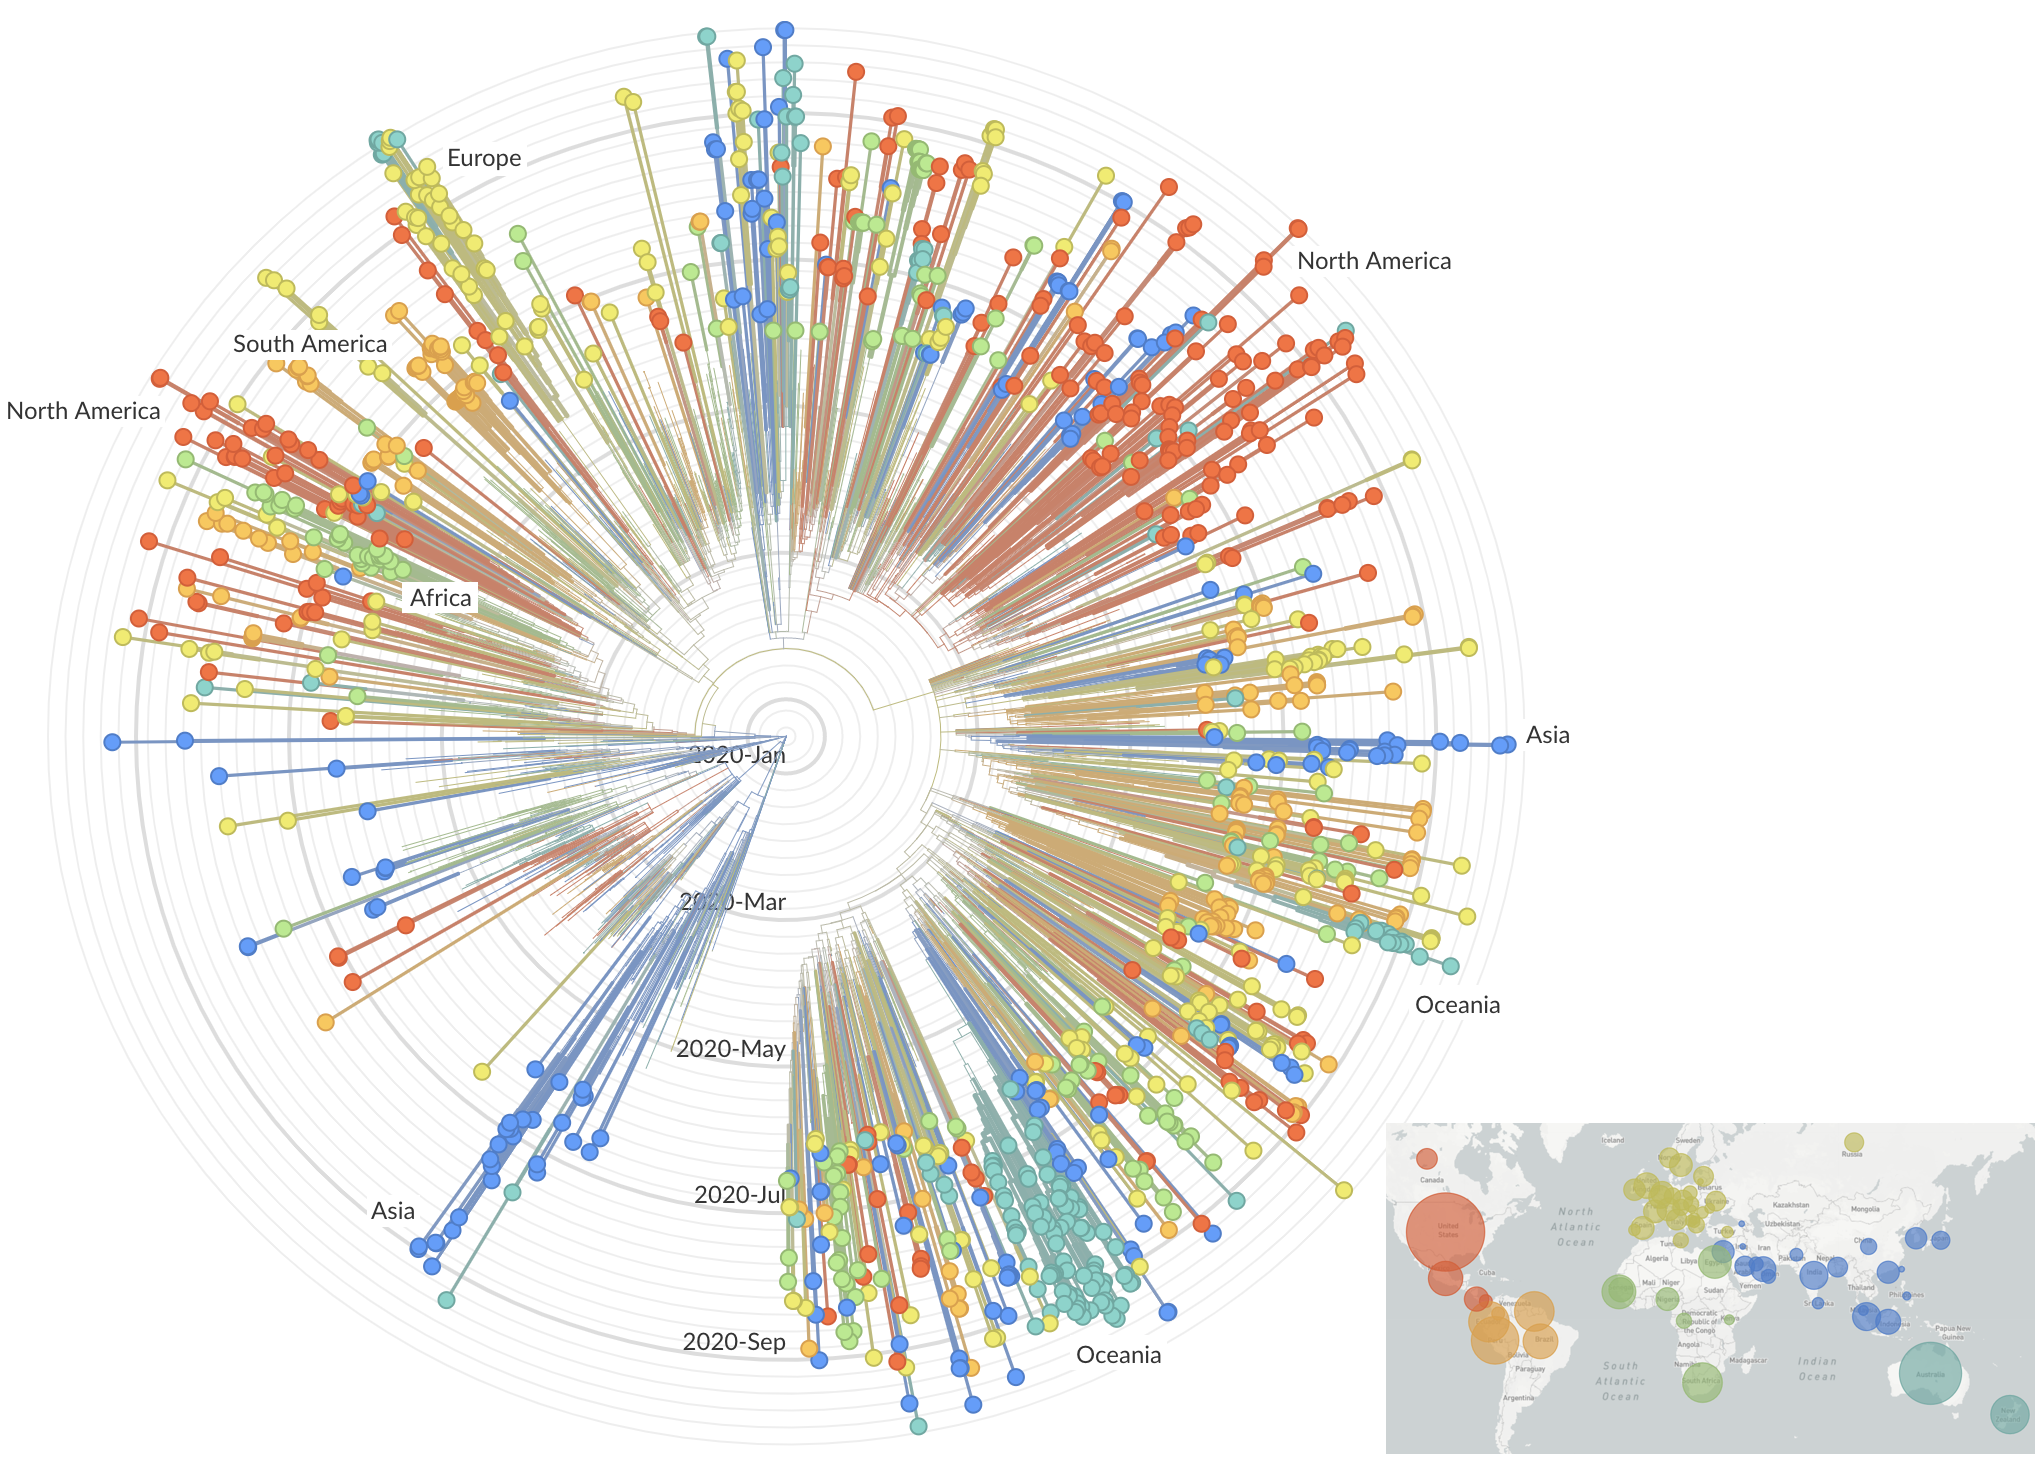
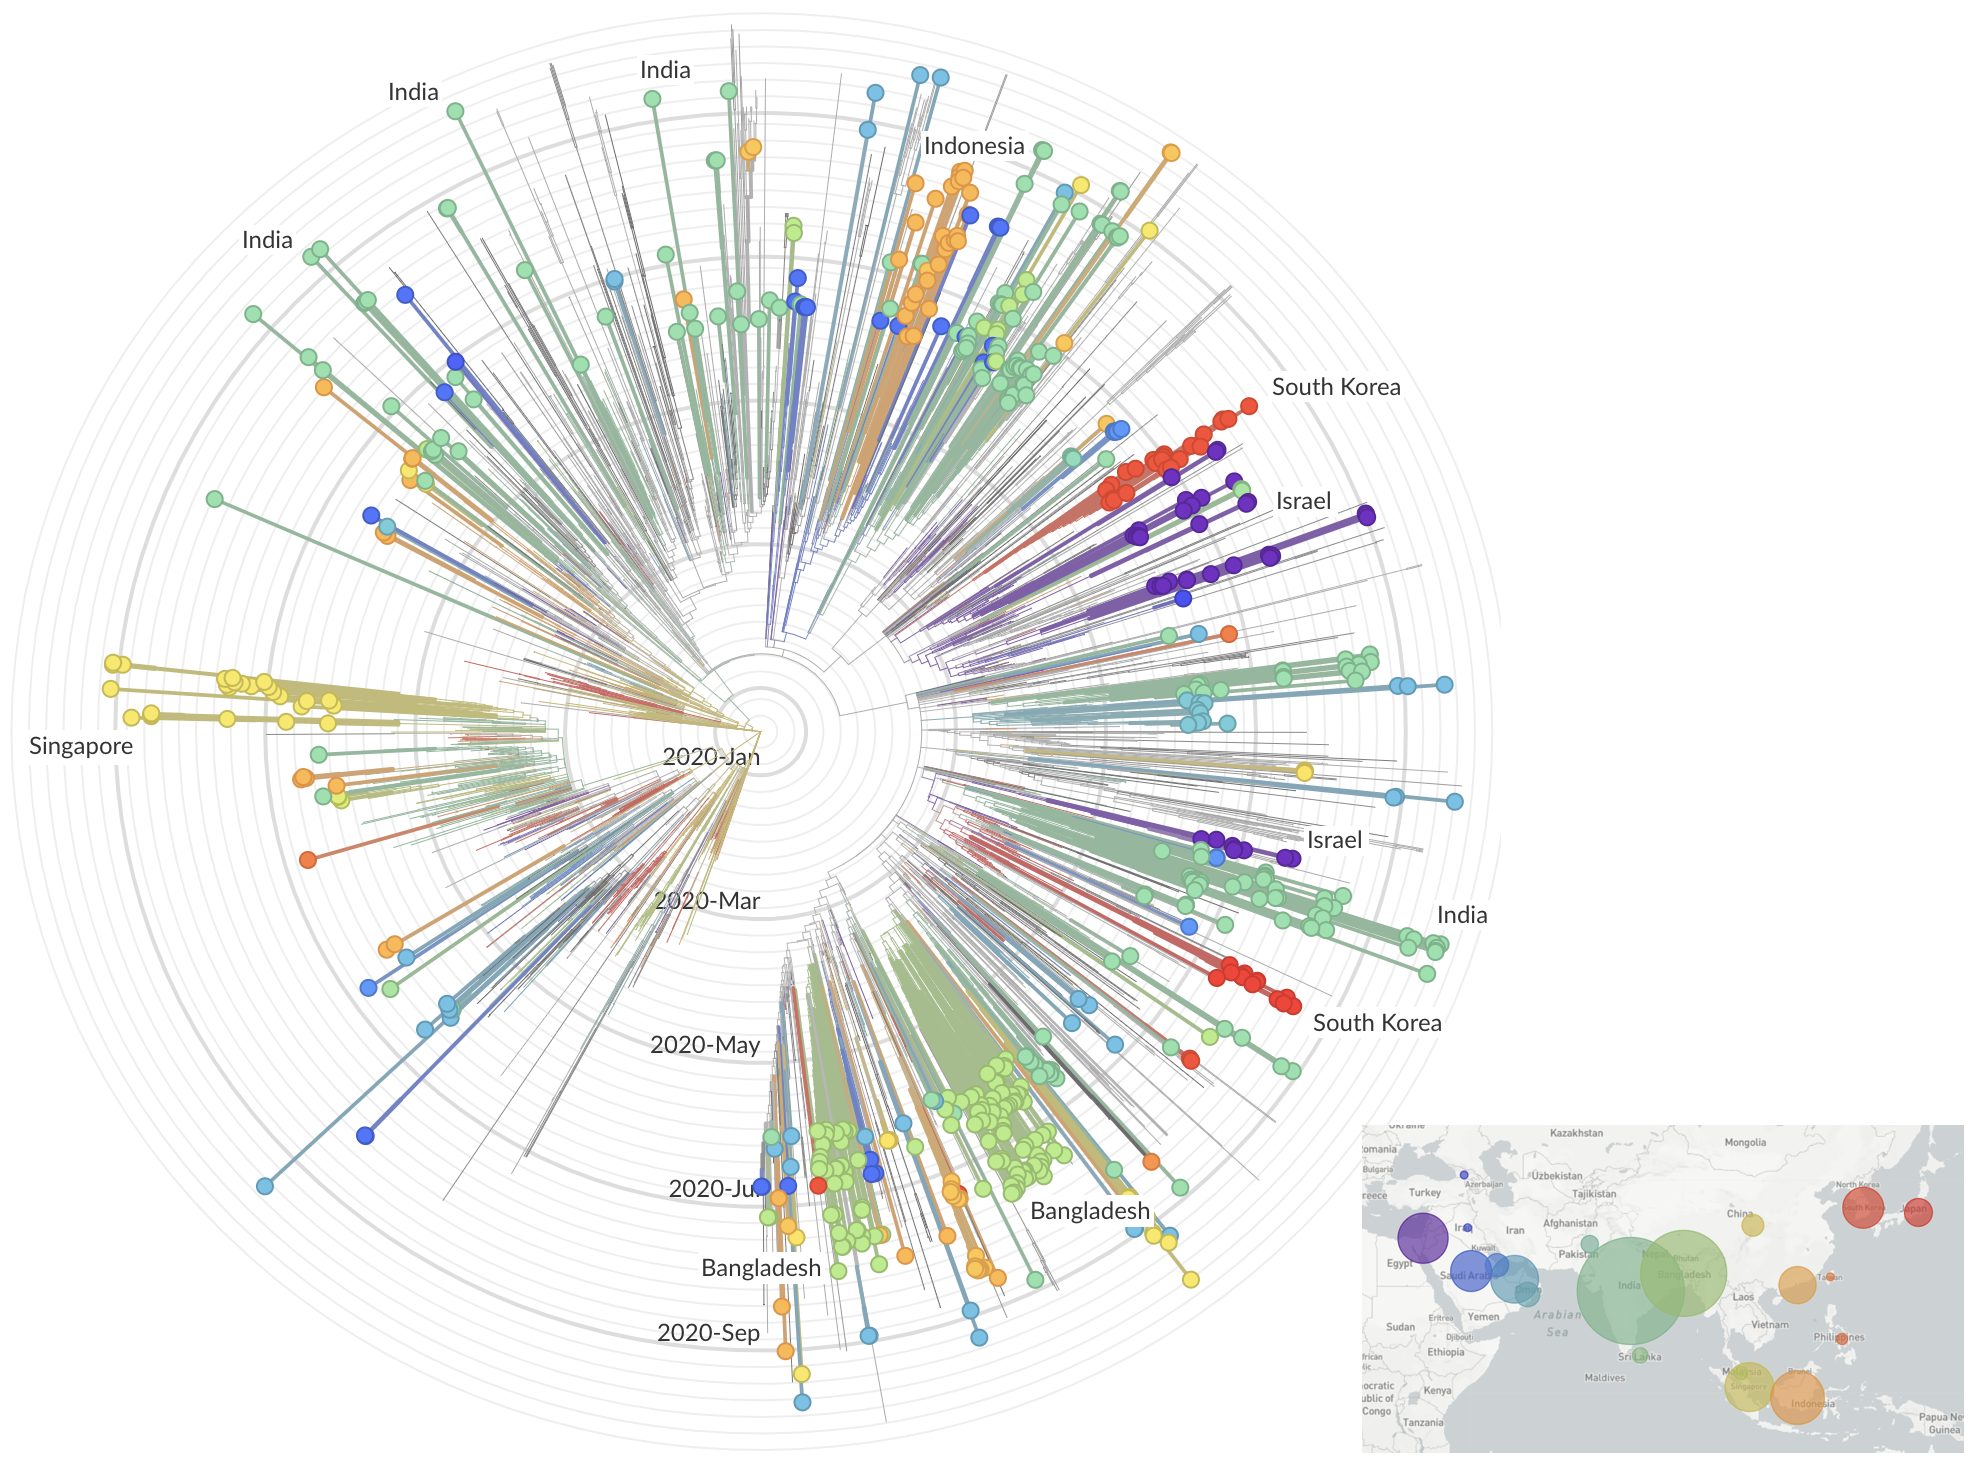
Sequencing and data sharing in almost real-time
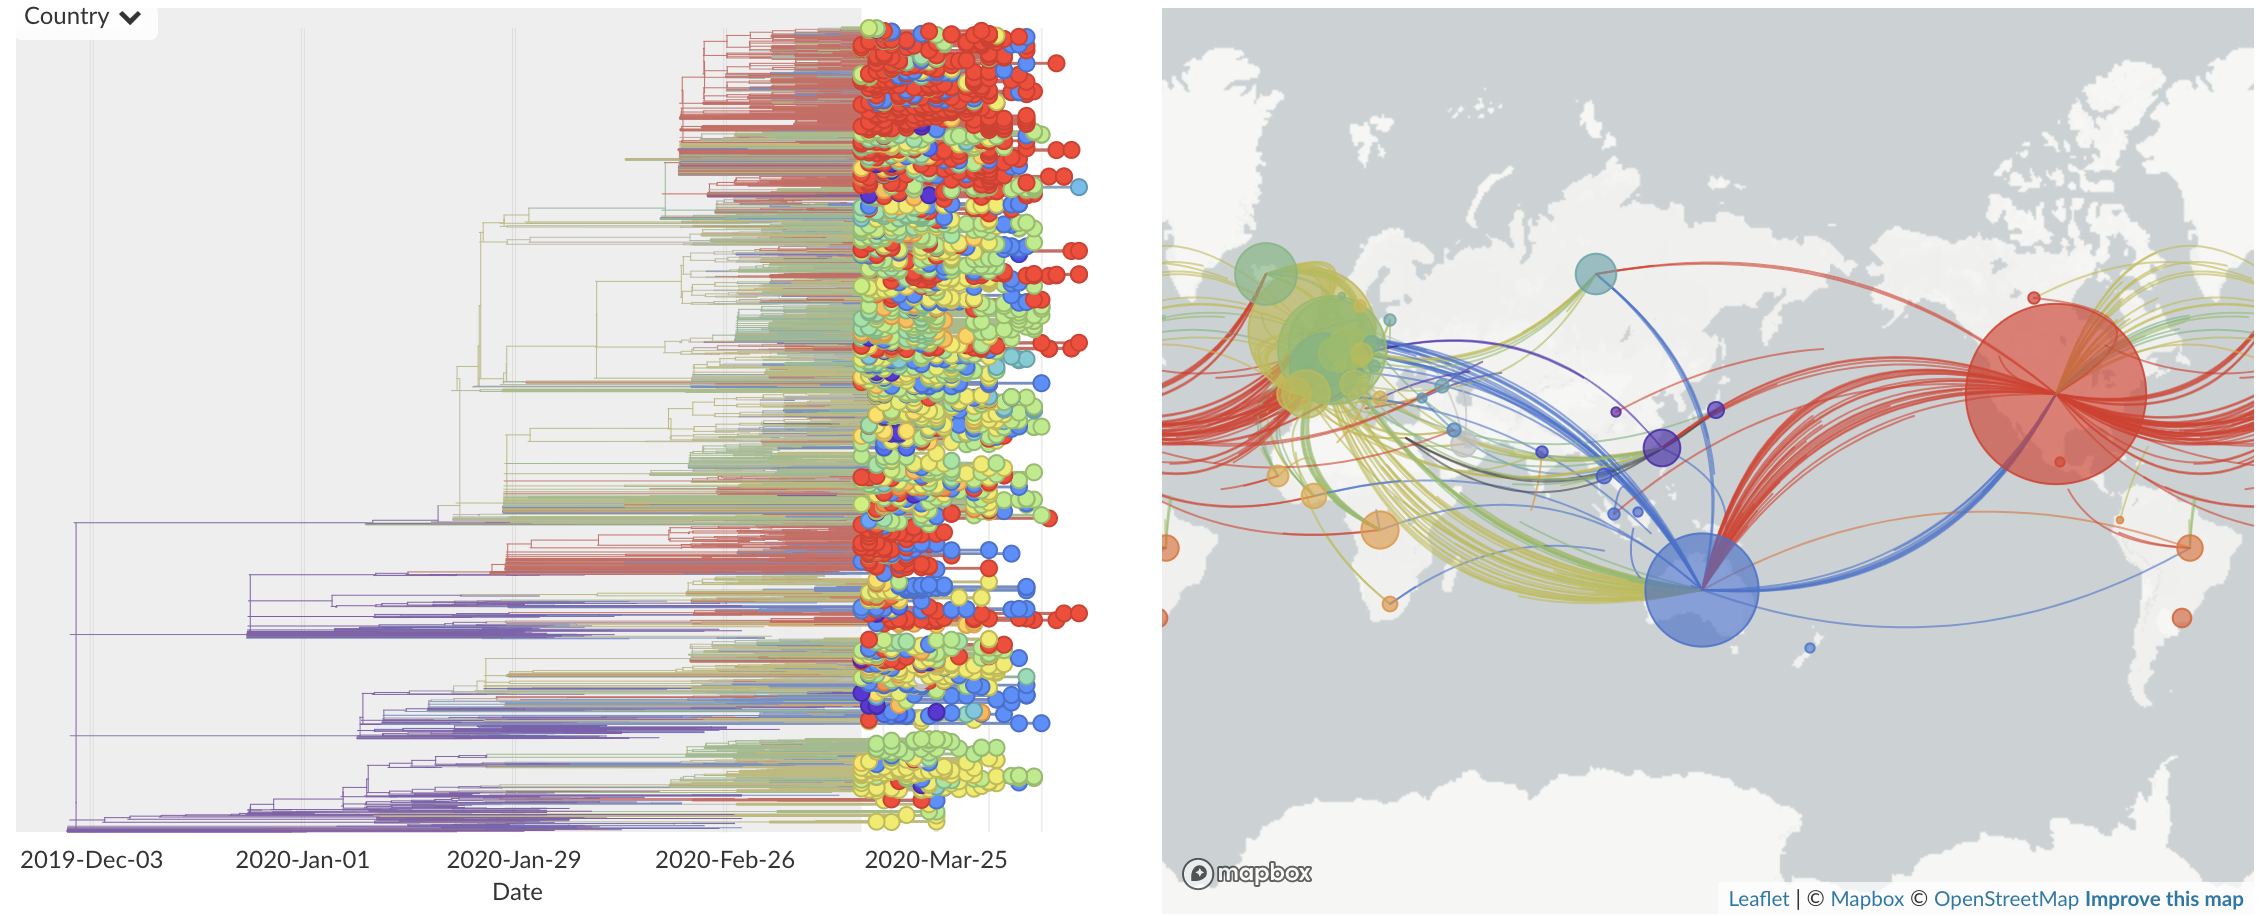
Dec/Jan: Emergence from Wuhan in ~Nov 2019
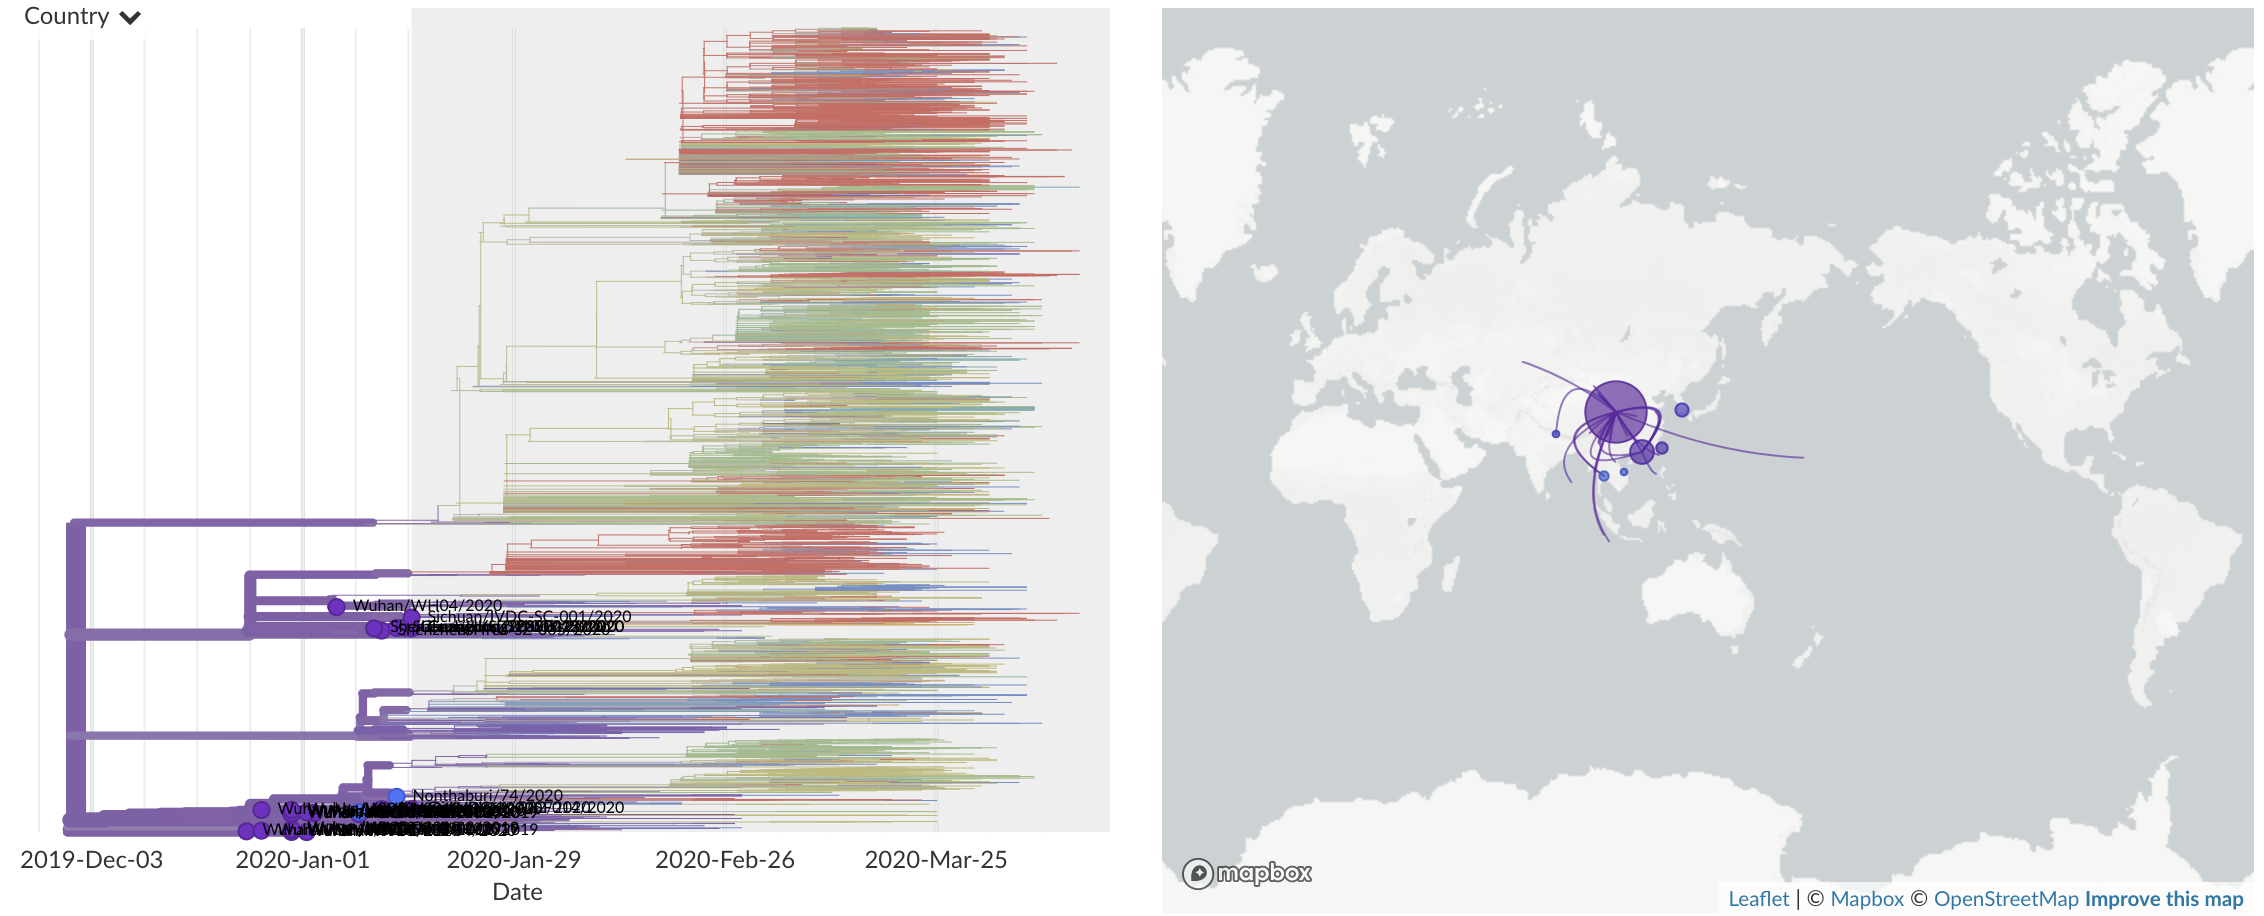
Jan/Feb: Spread within China and seeding elsewhere
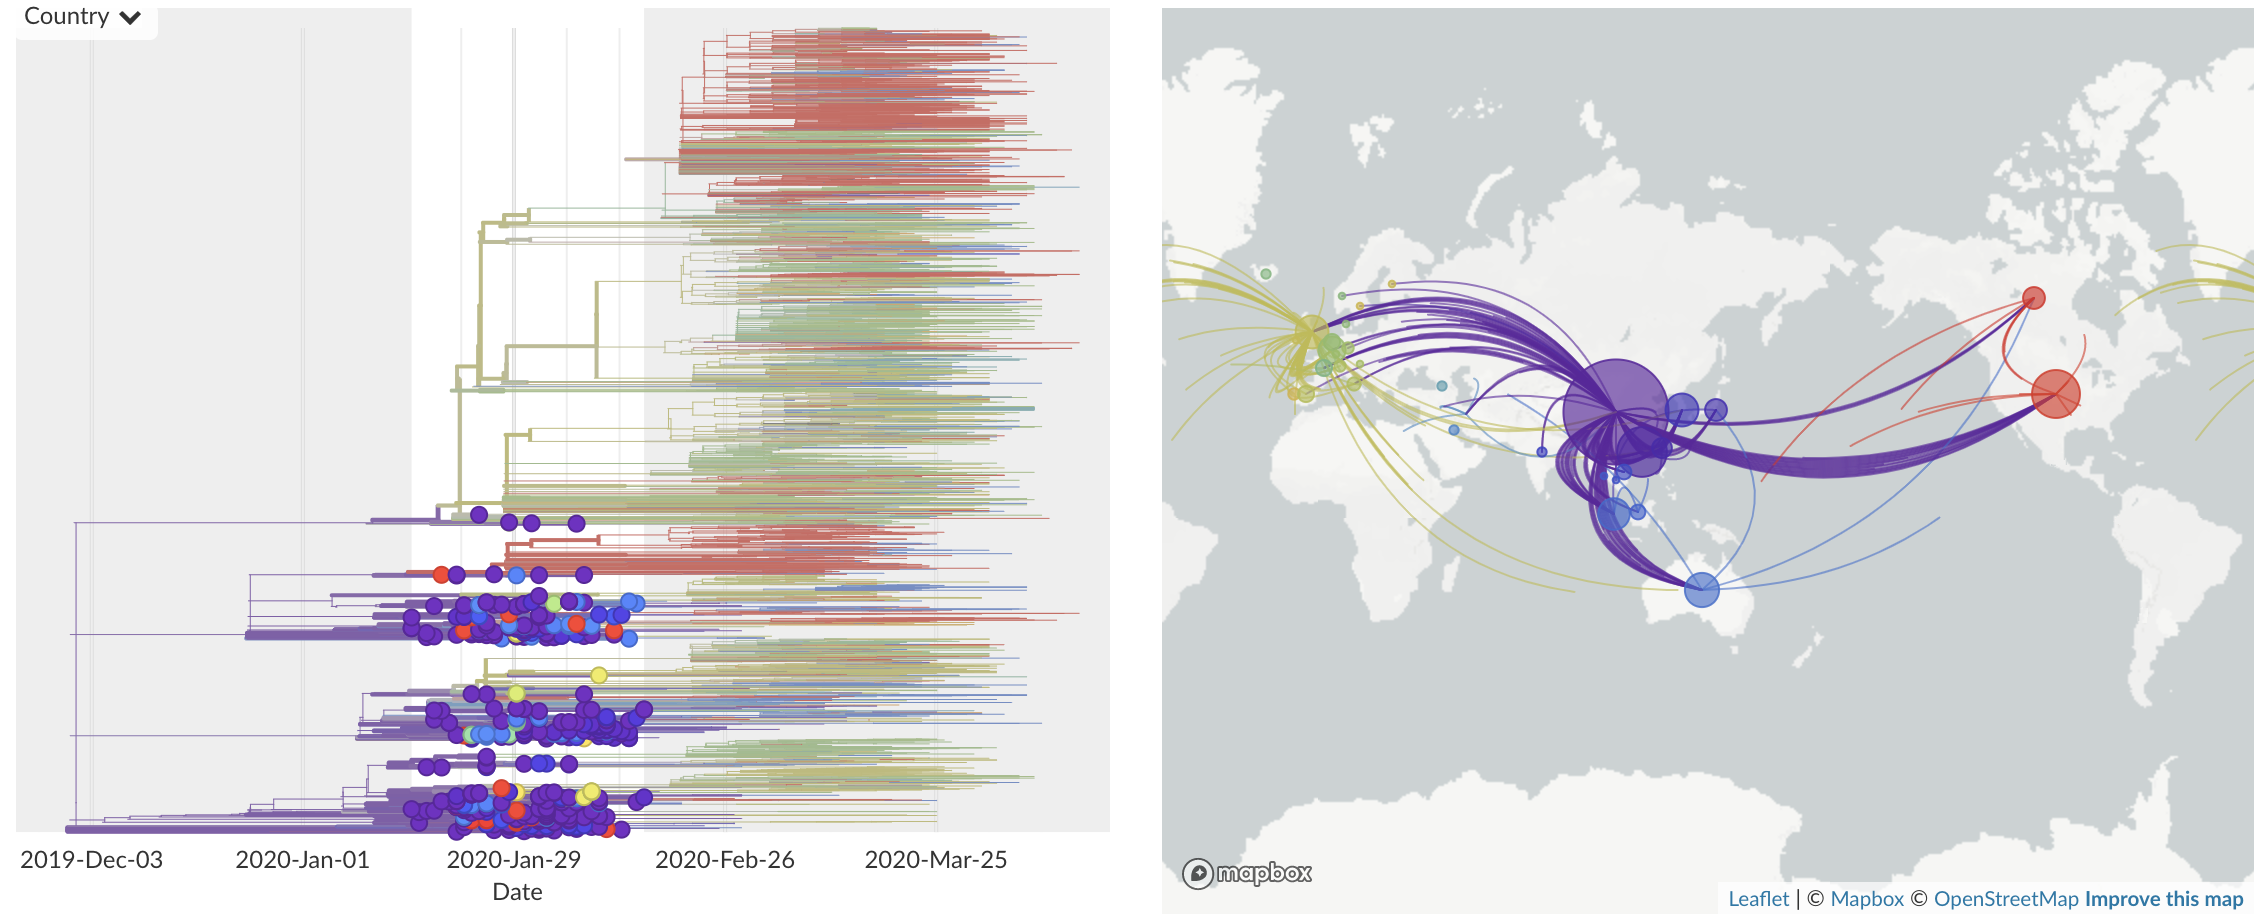
Feb/Mar: Epidemic spread within North America and Europe
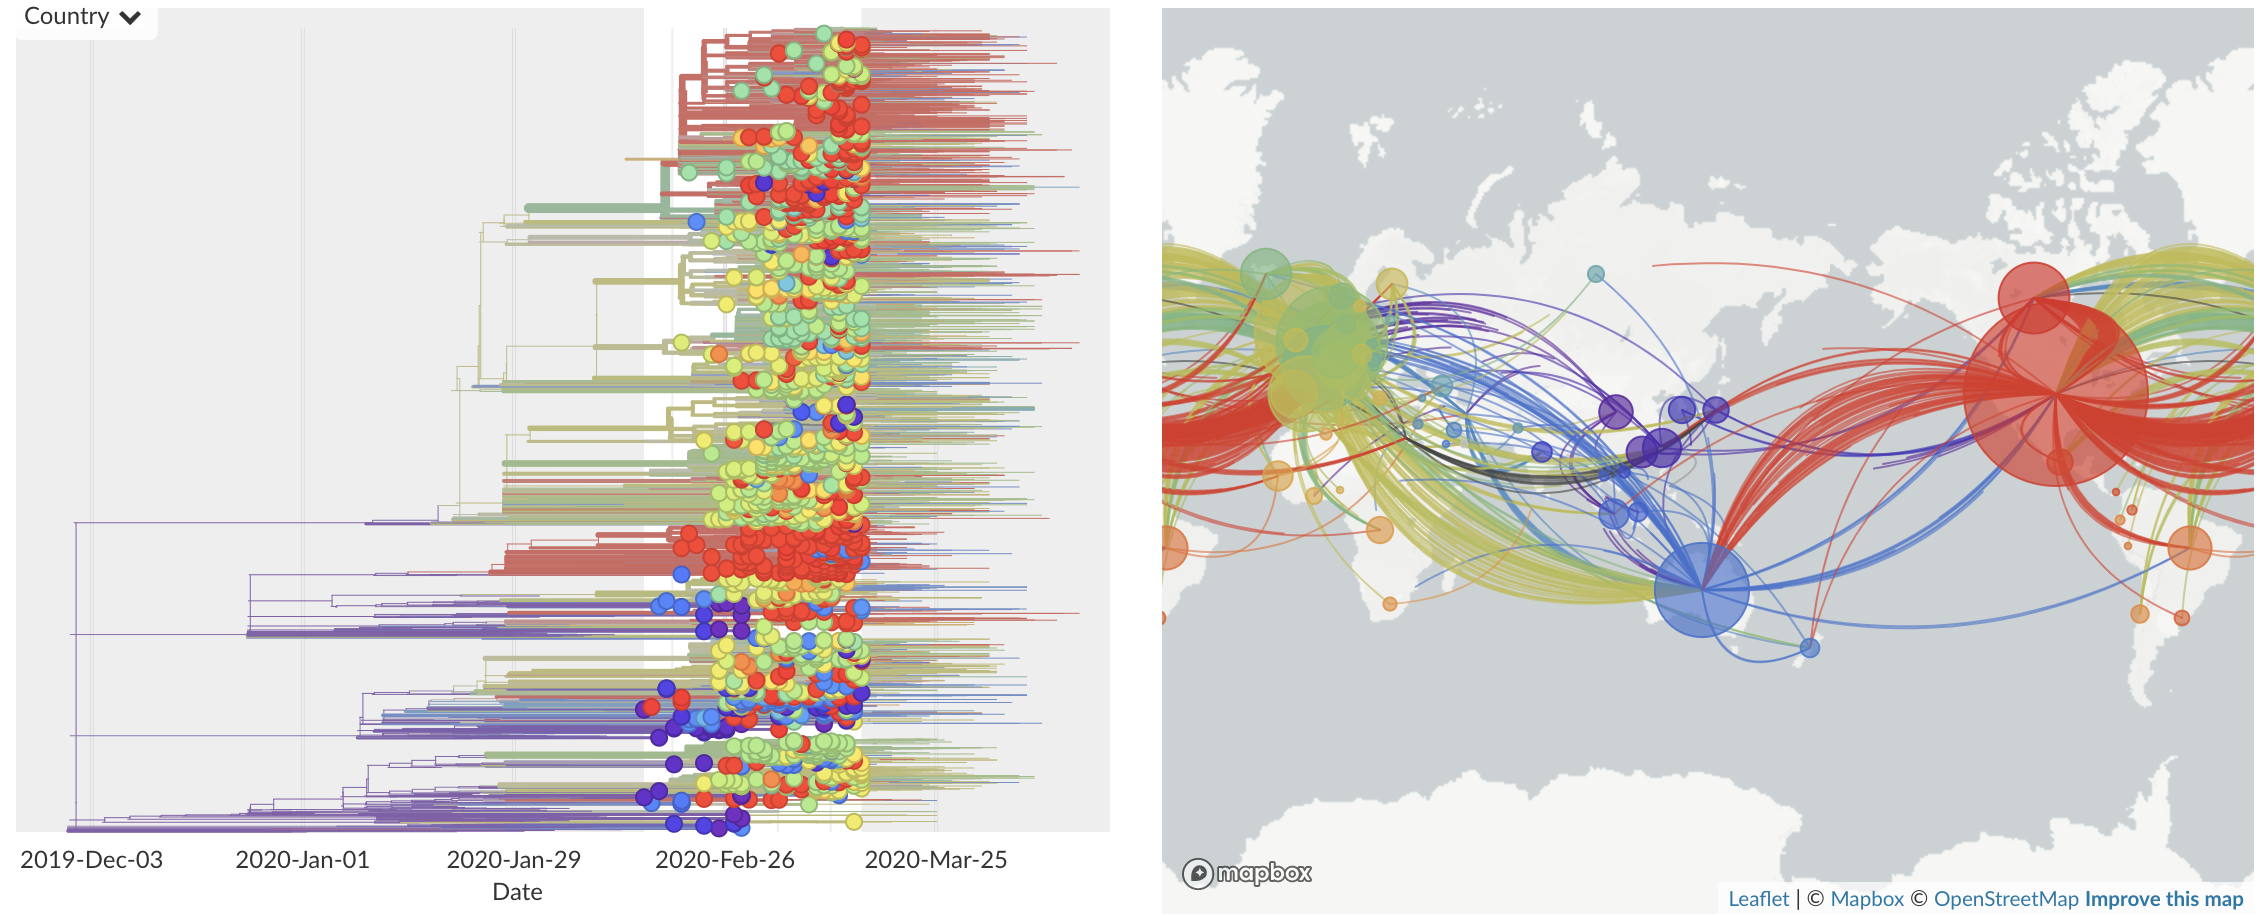
Mar/Apr: Decreasing transmission with social distancing
Epidemic in the USA was introduced from China in late Jan and from Europe during Feb
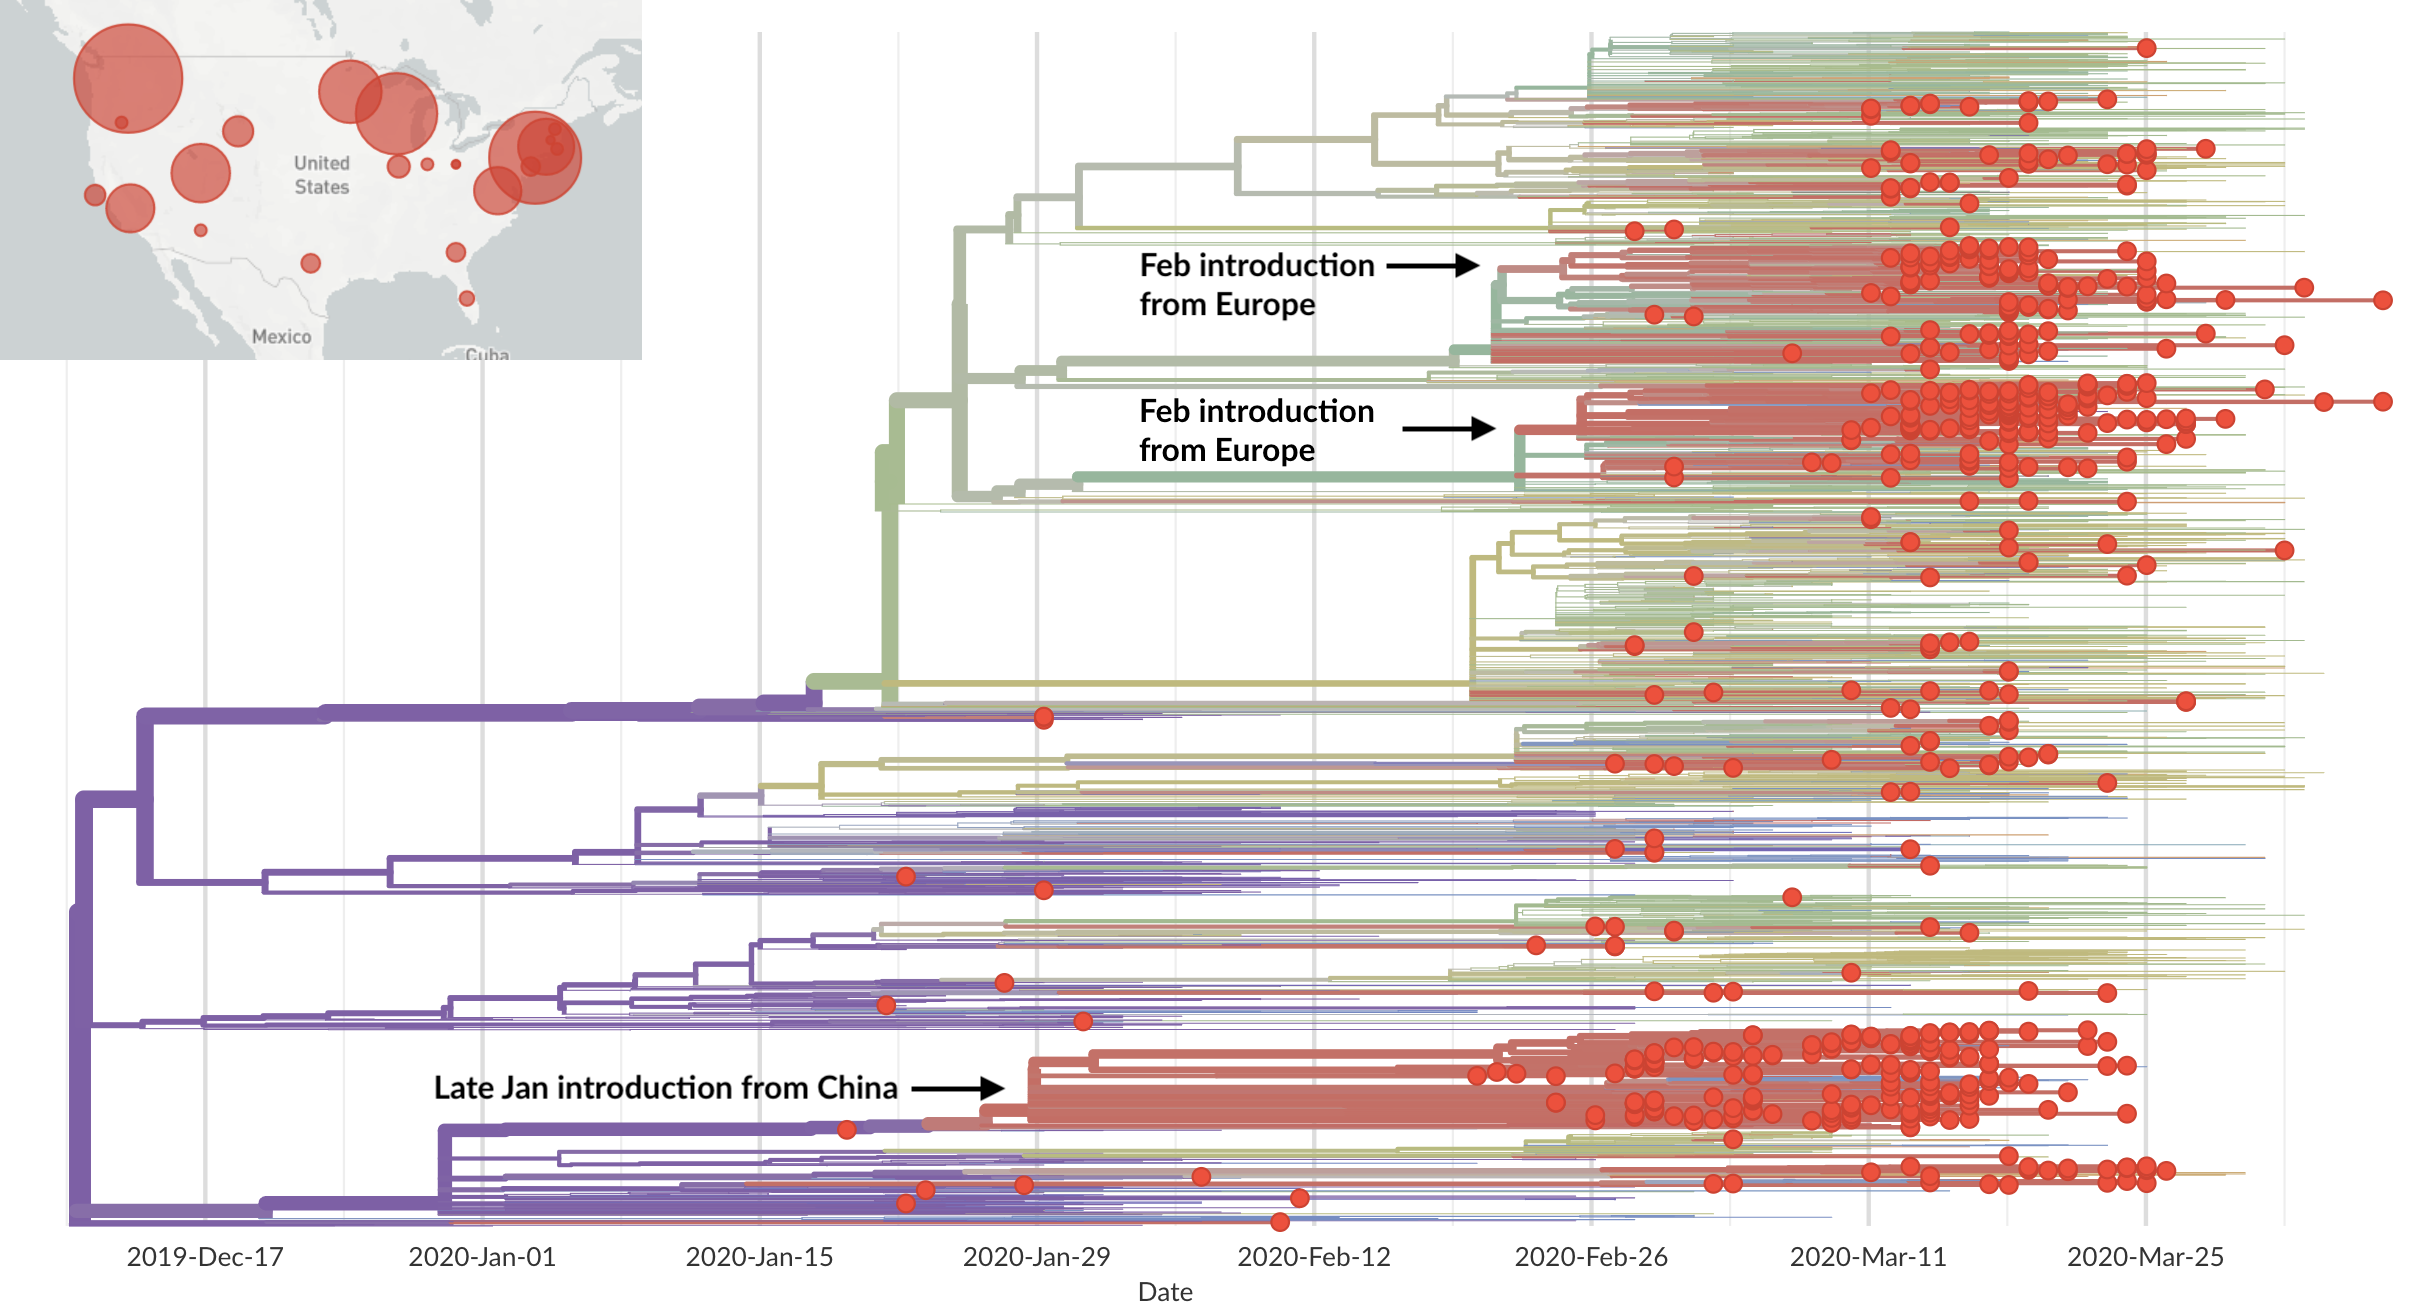
Once in the US, virus spread rapidly
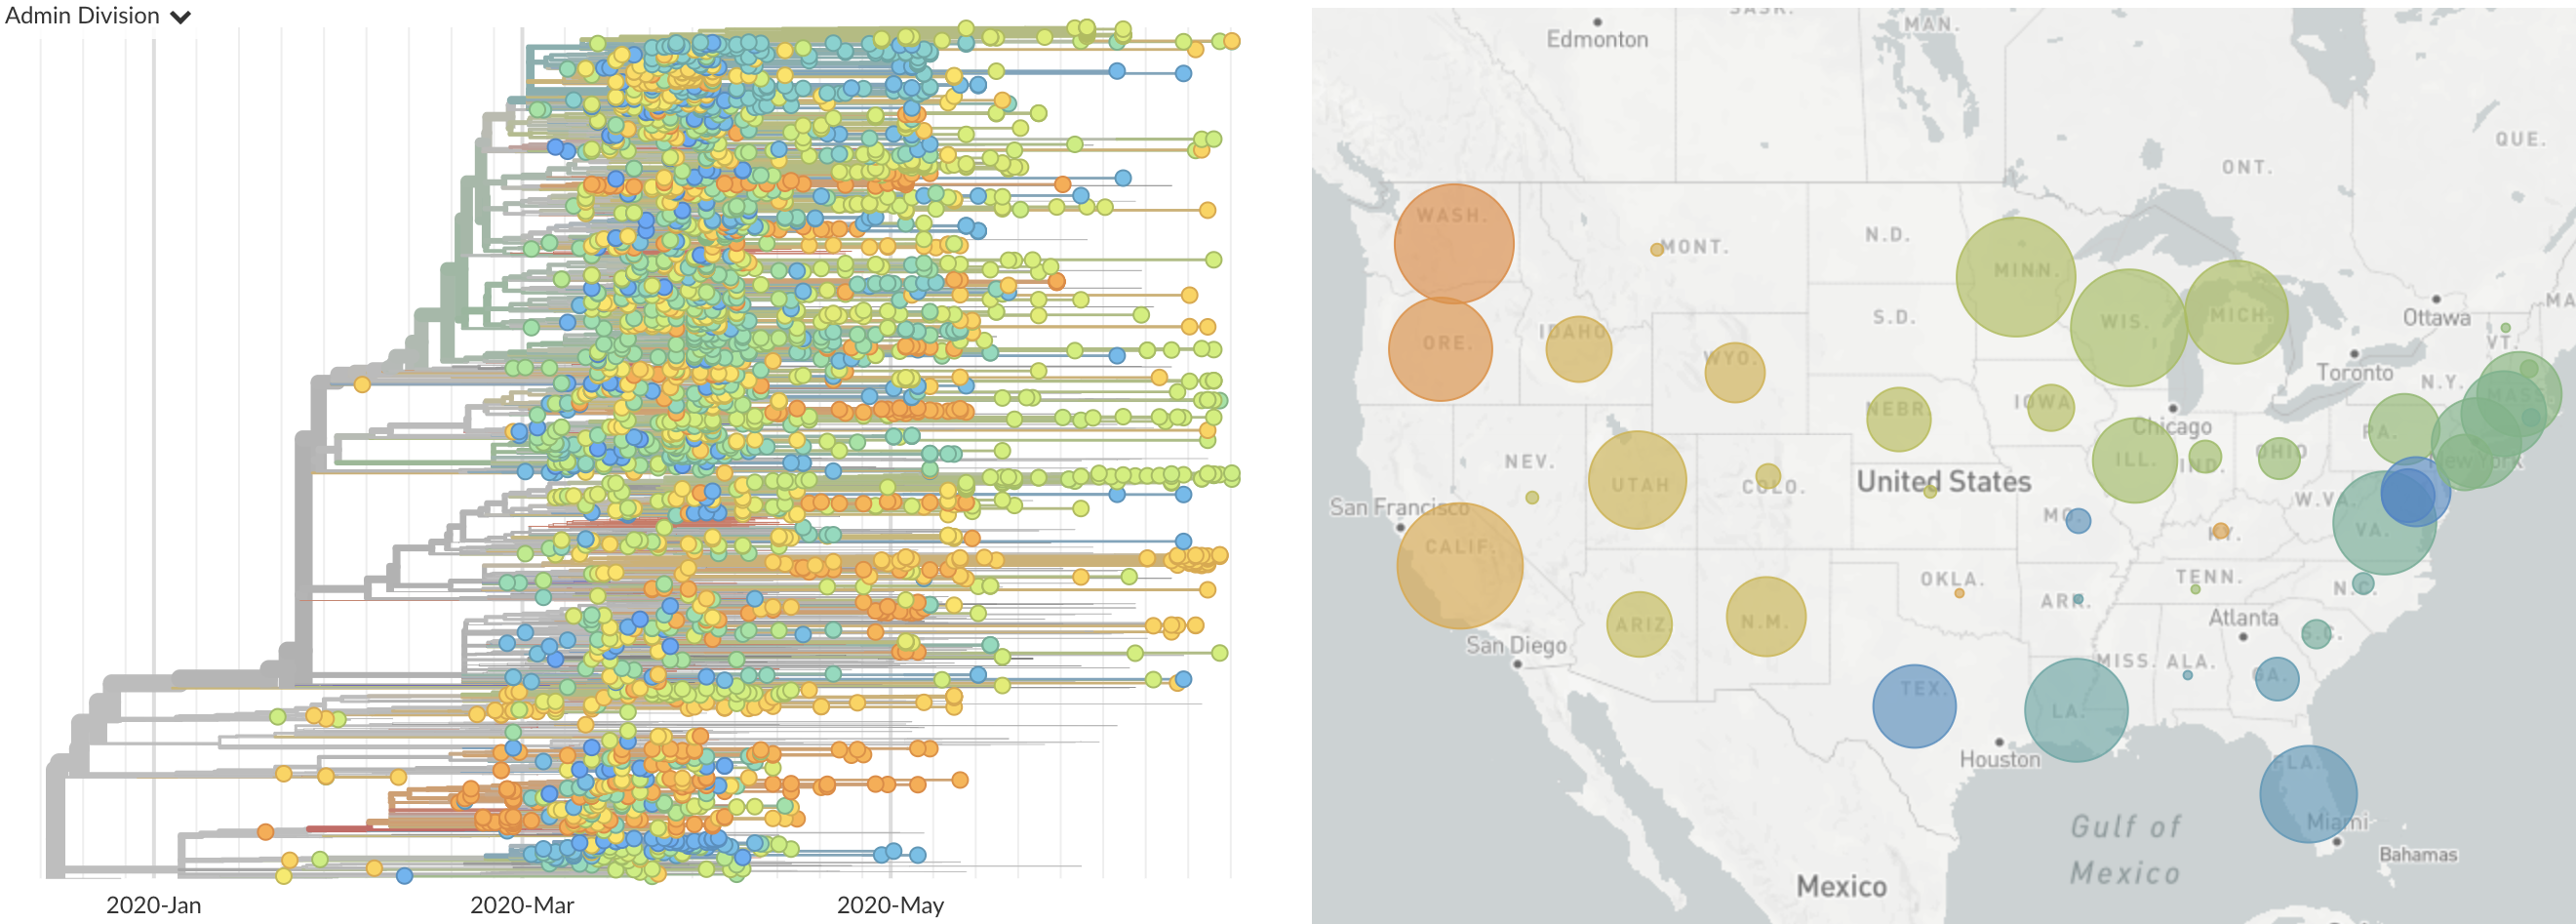
Single introduction at the beginning of Feb quickly shows up throughout the country
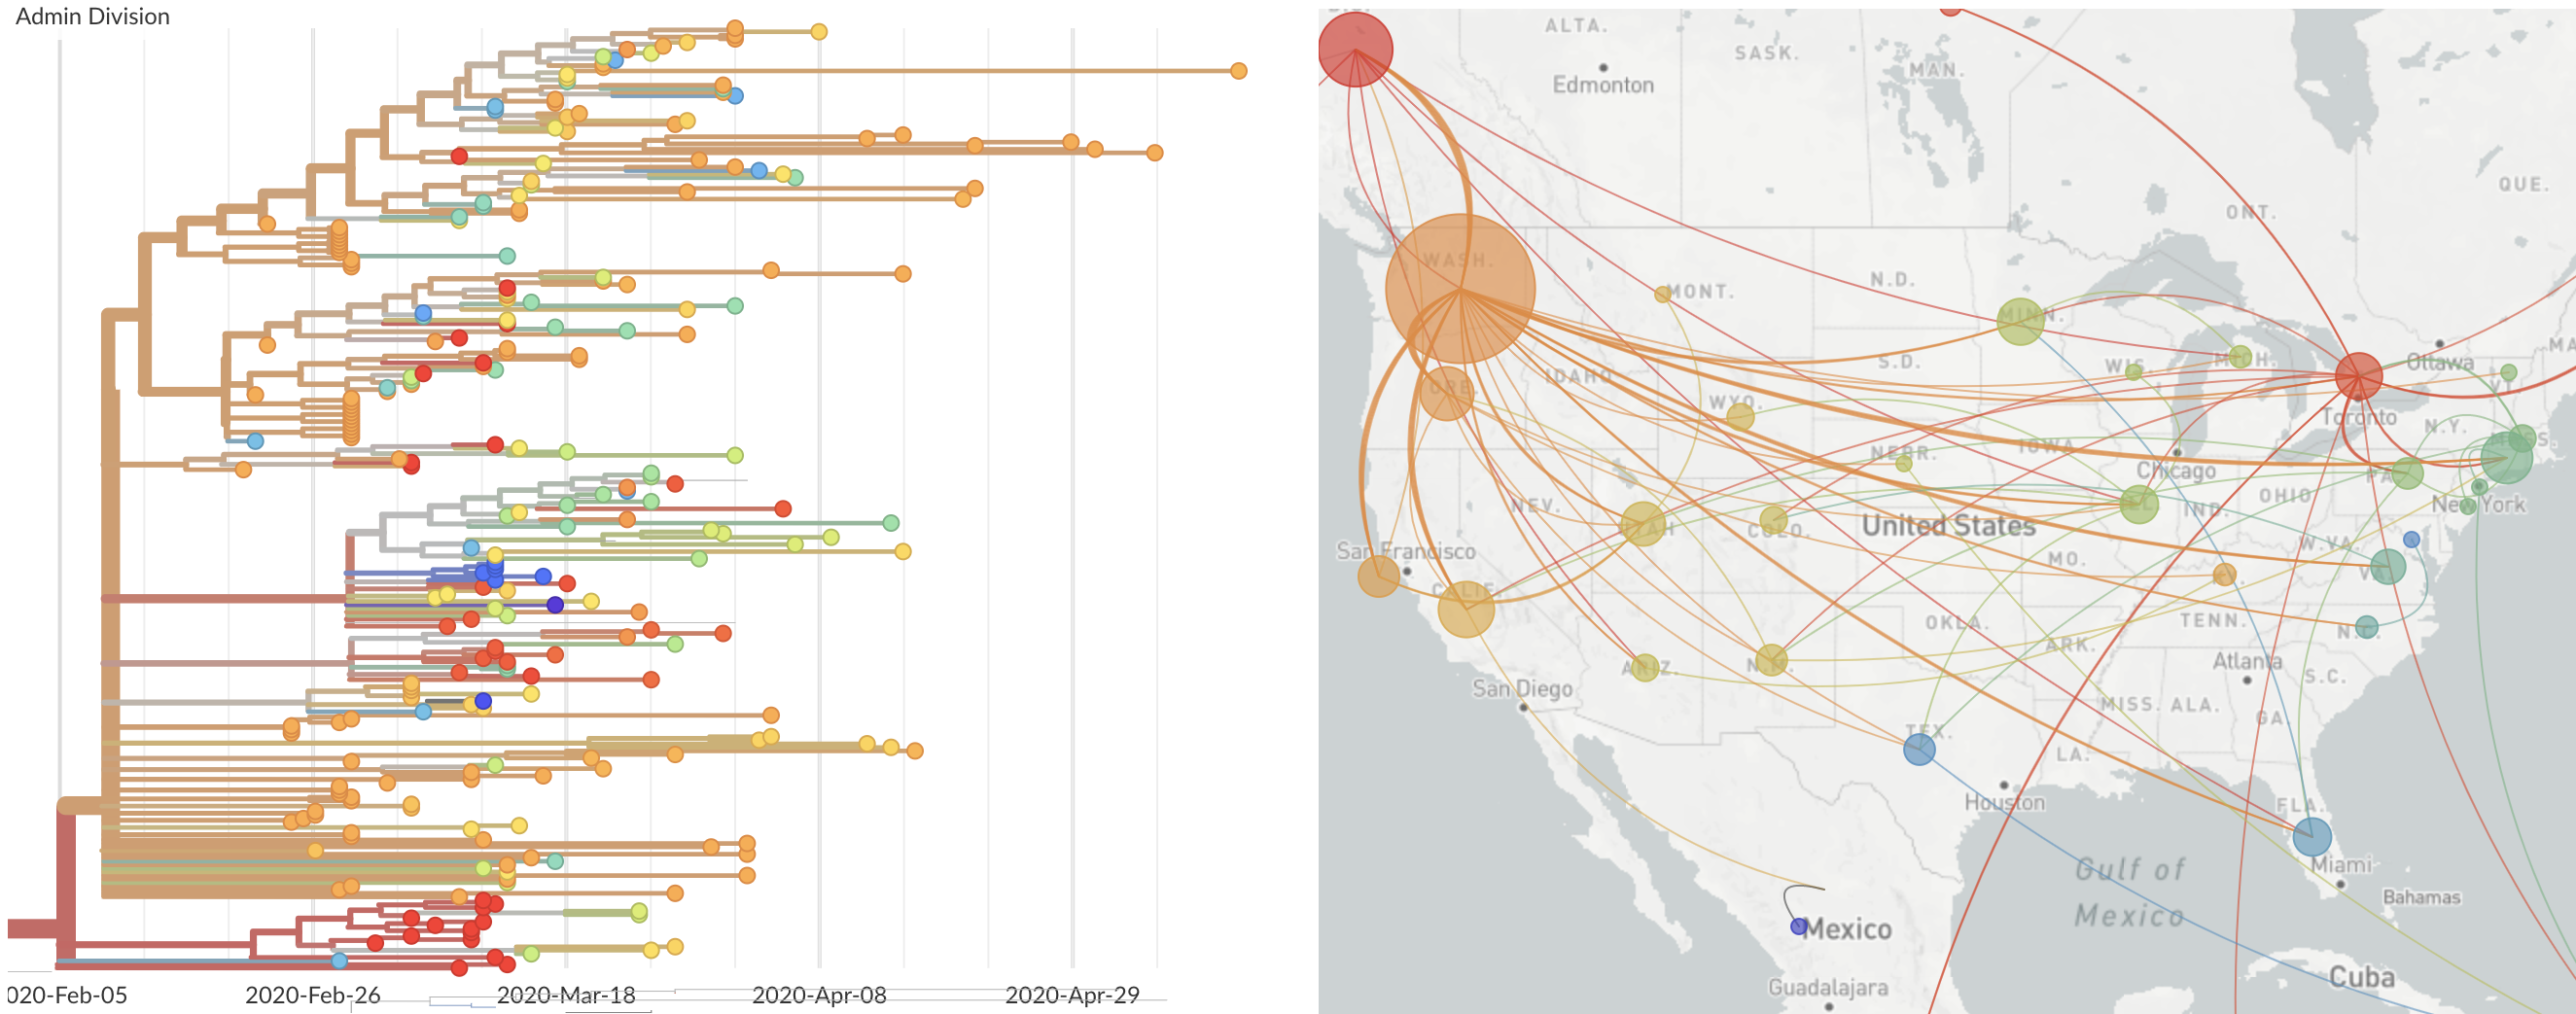
and decreased international travel,
regional clades have emerged
and decreased international travel,
regional clades have emerged
Sequencing immediately useful for epidemiological understanding, but selection and functional impacts should also be studied
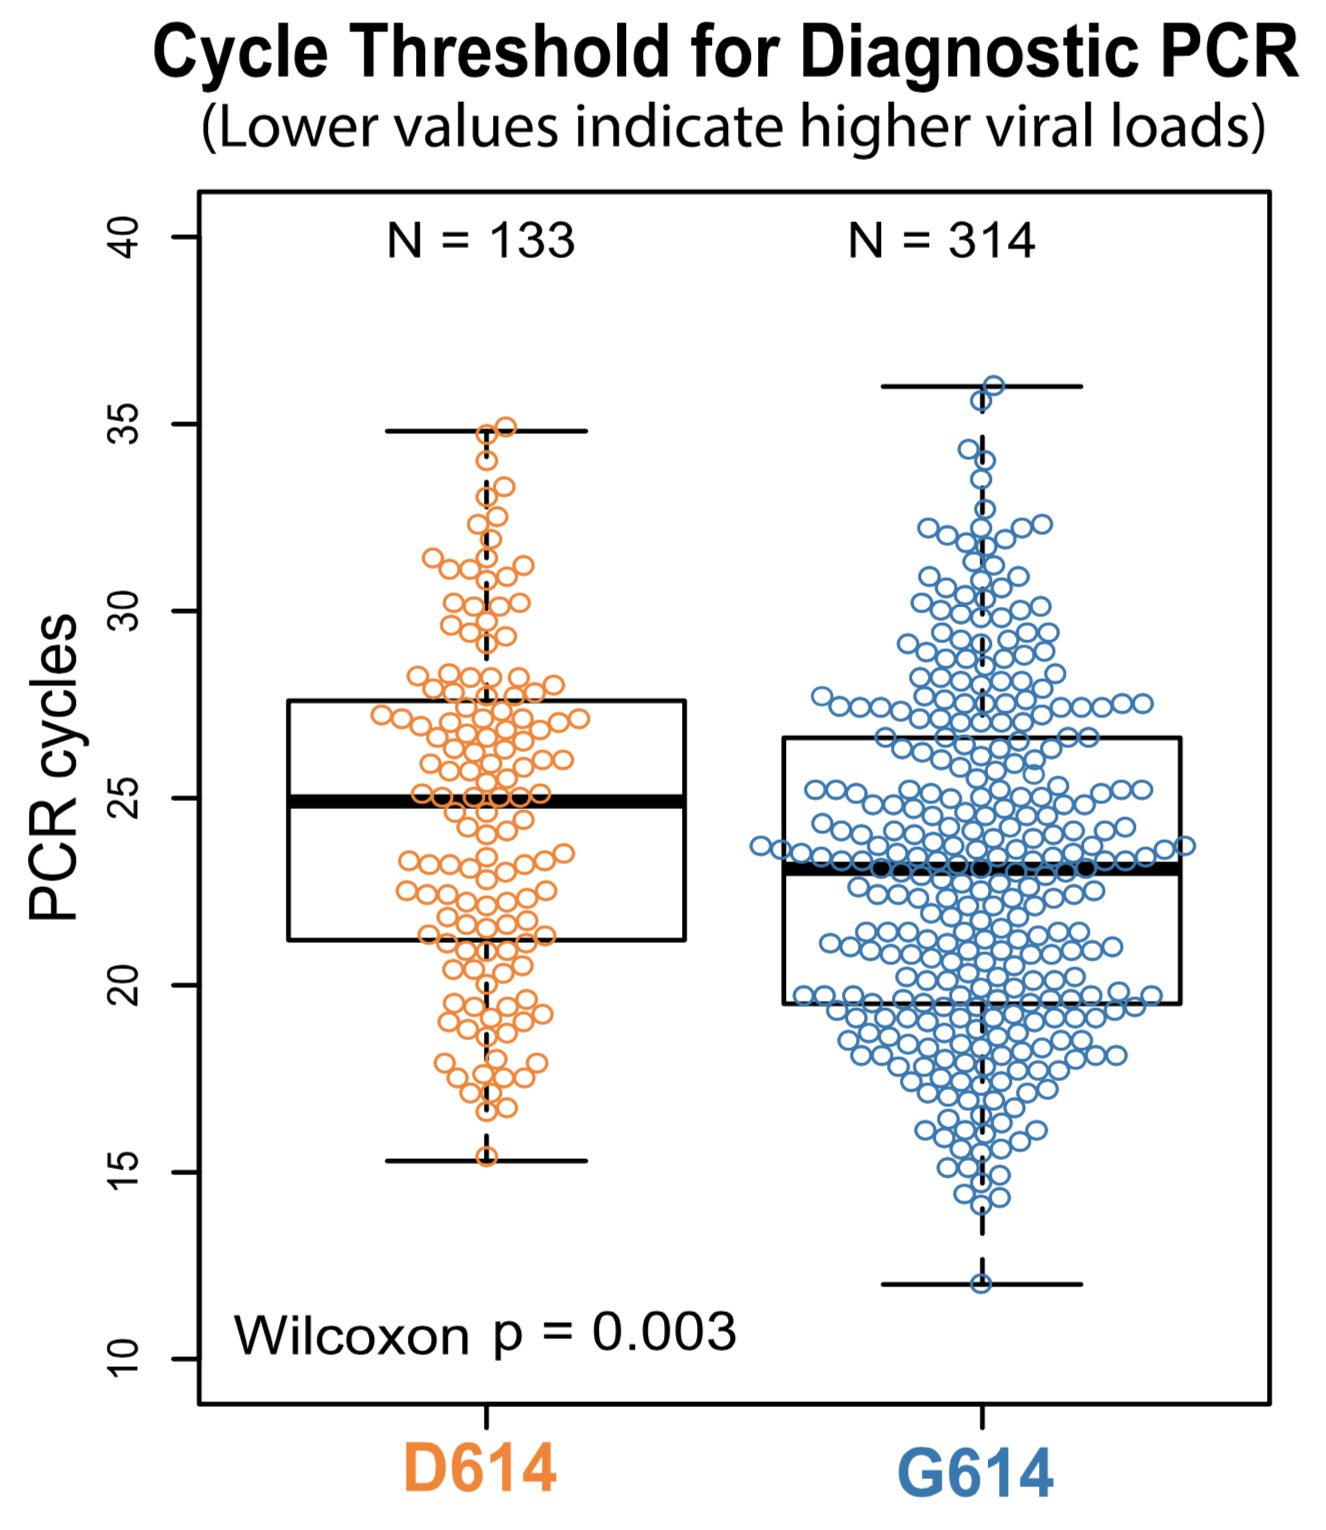
Significant interest in spike mutation D614G
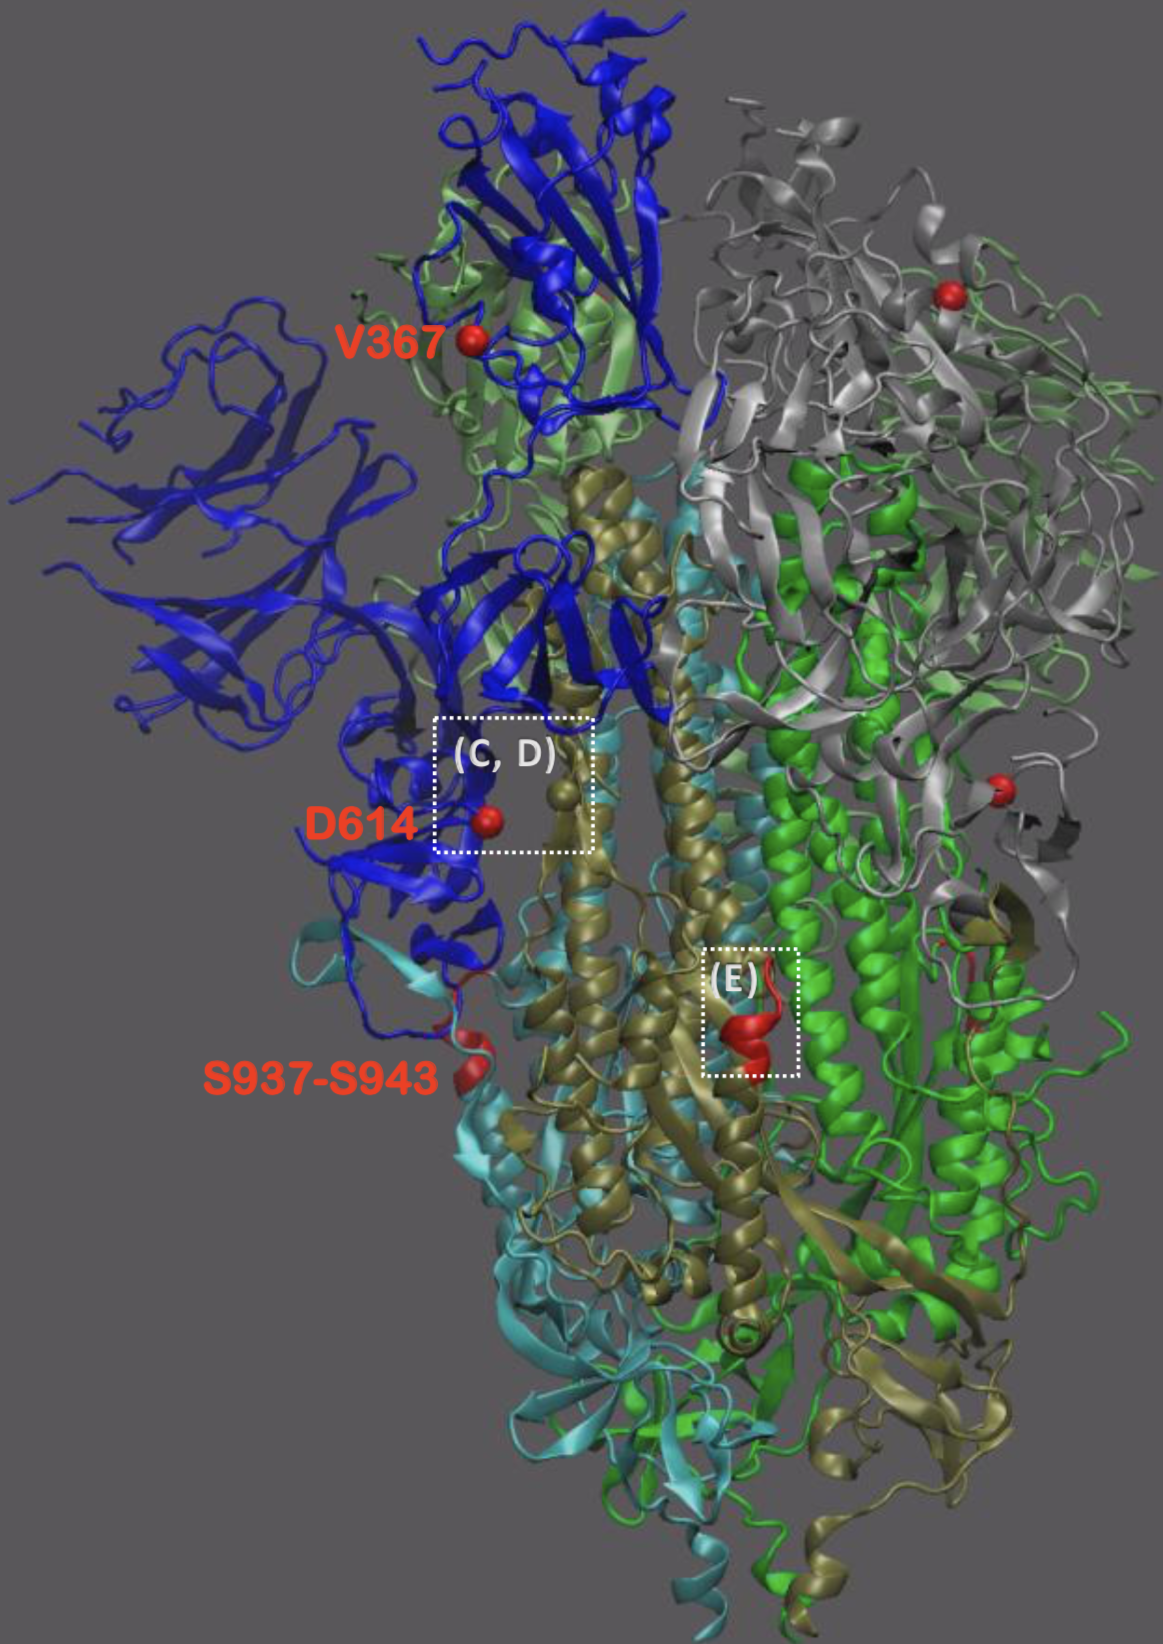
This mutation occurred in the initial European introduction
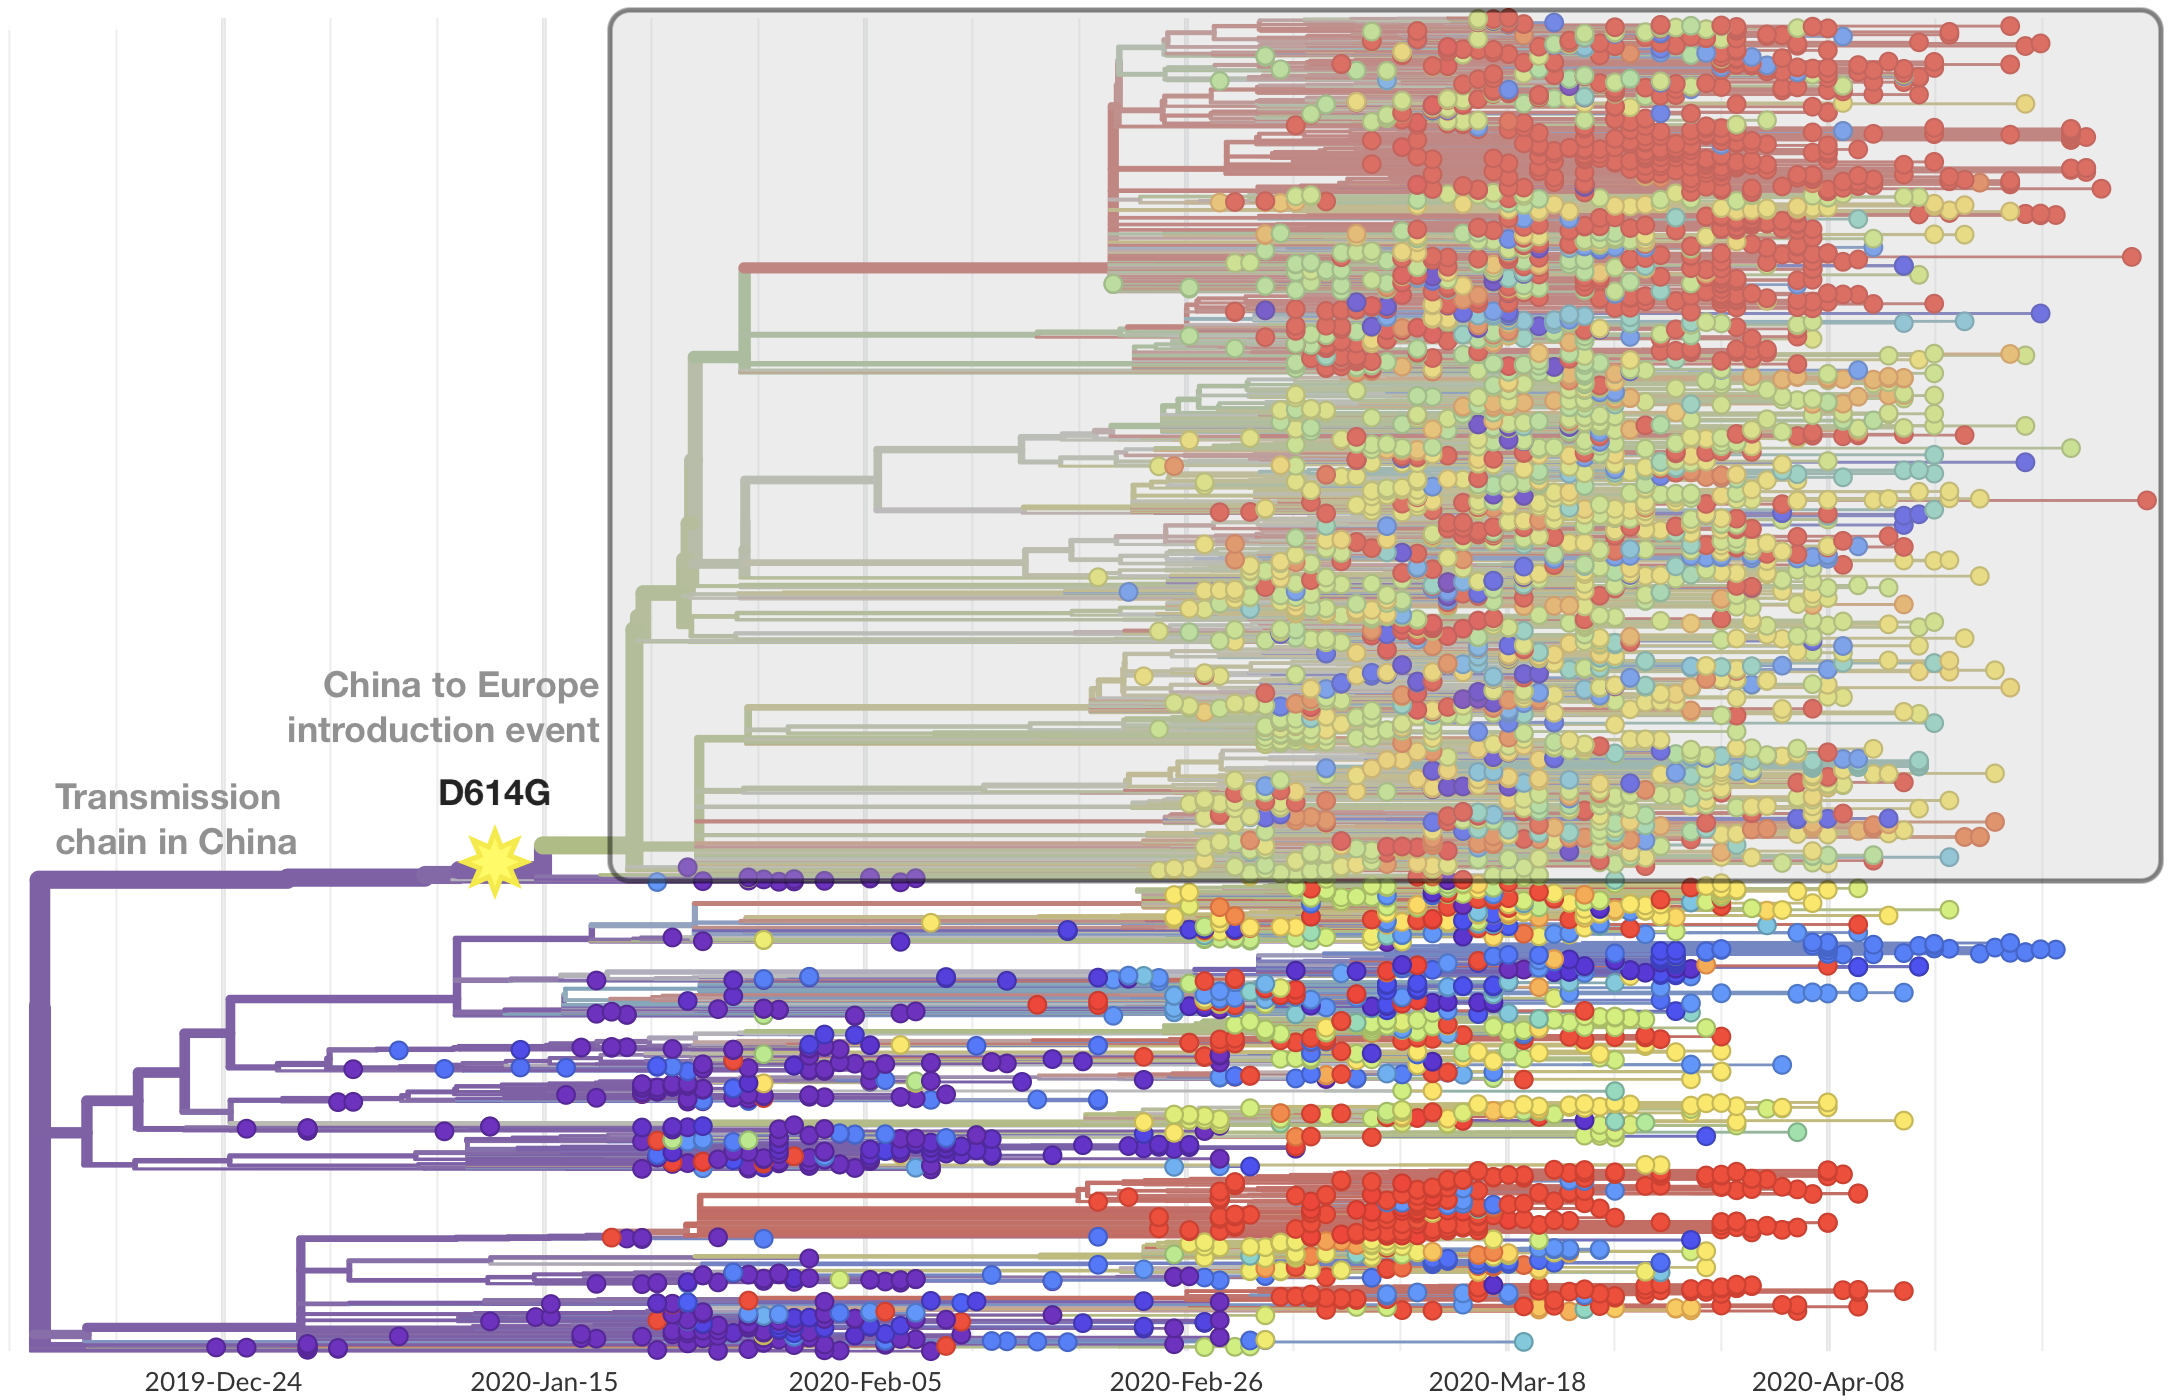
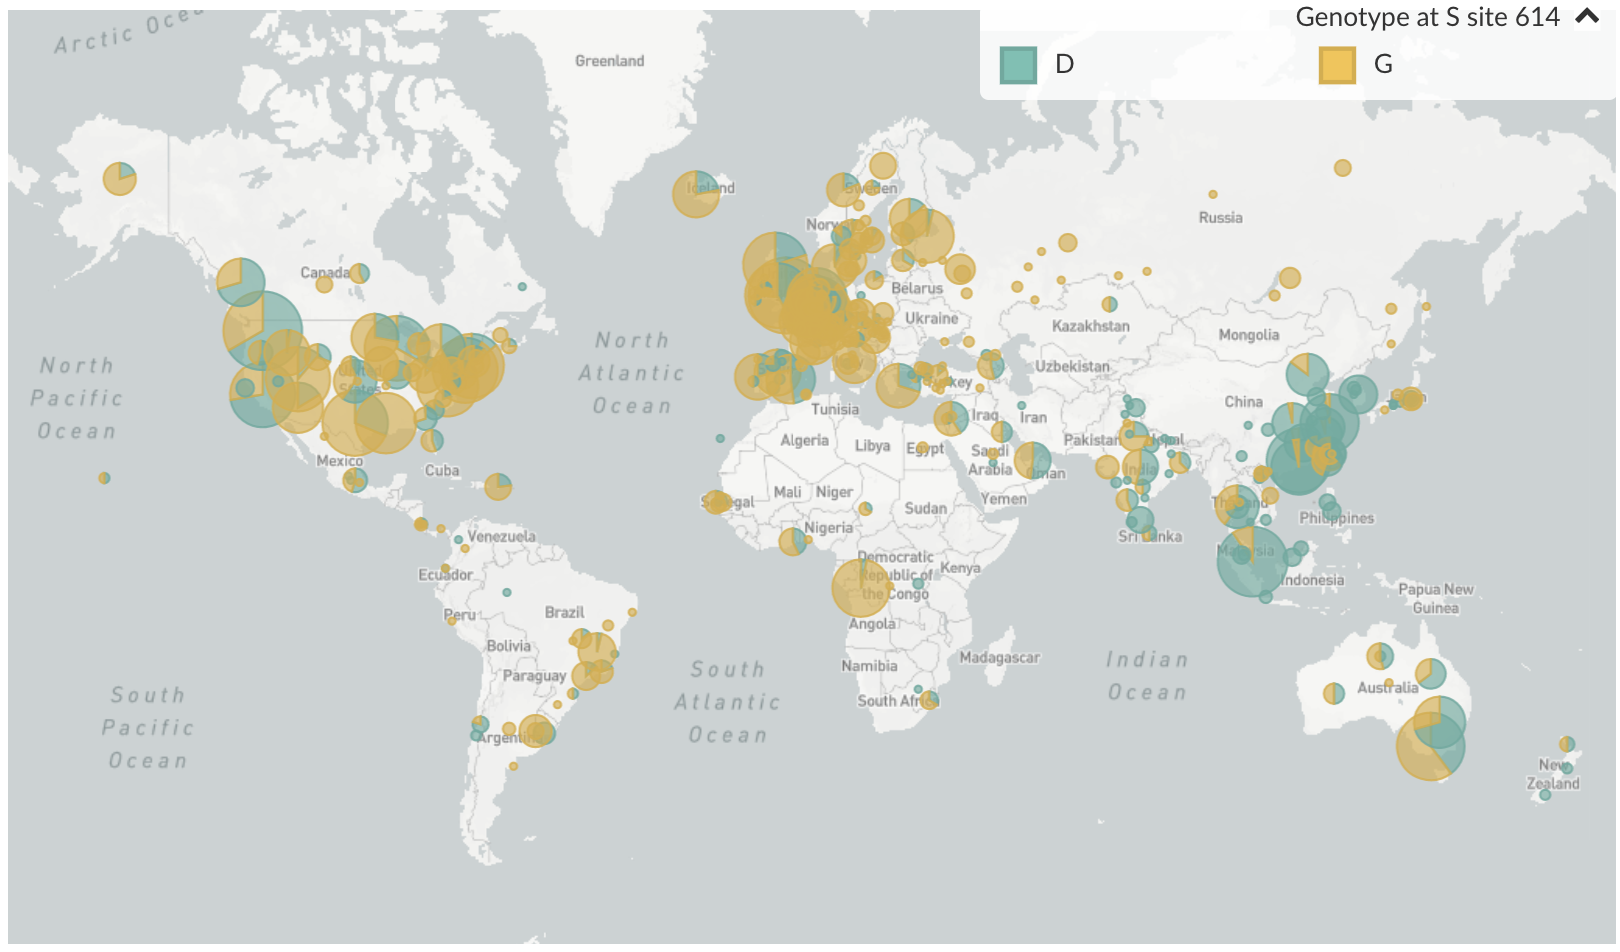
D614G is prevalent throughout Europe and mixed in US and Australia
D614G is increasing in frequency across states in US and Australia
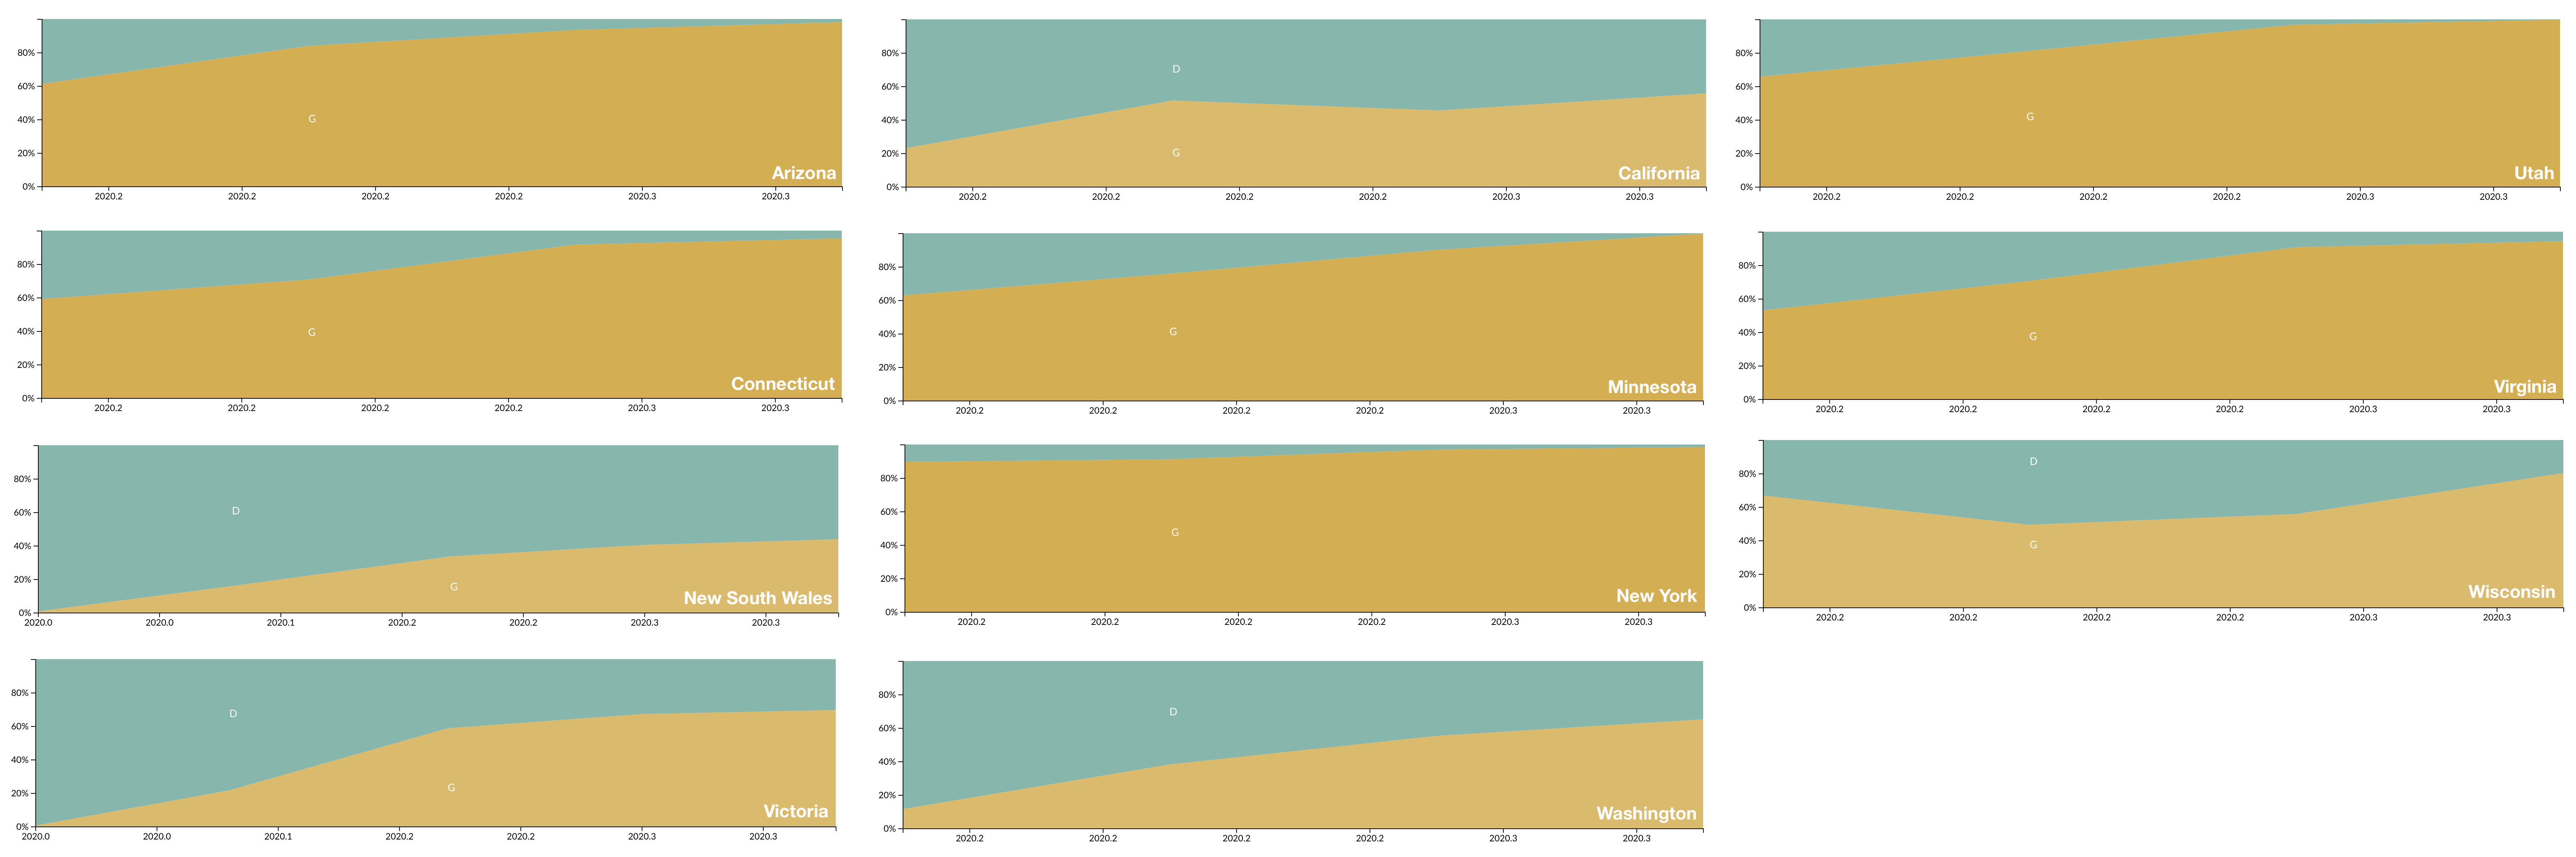
D614G is increasing in frequency across states in US and Australia
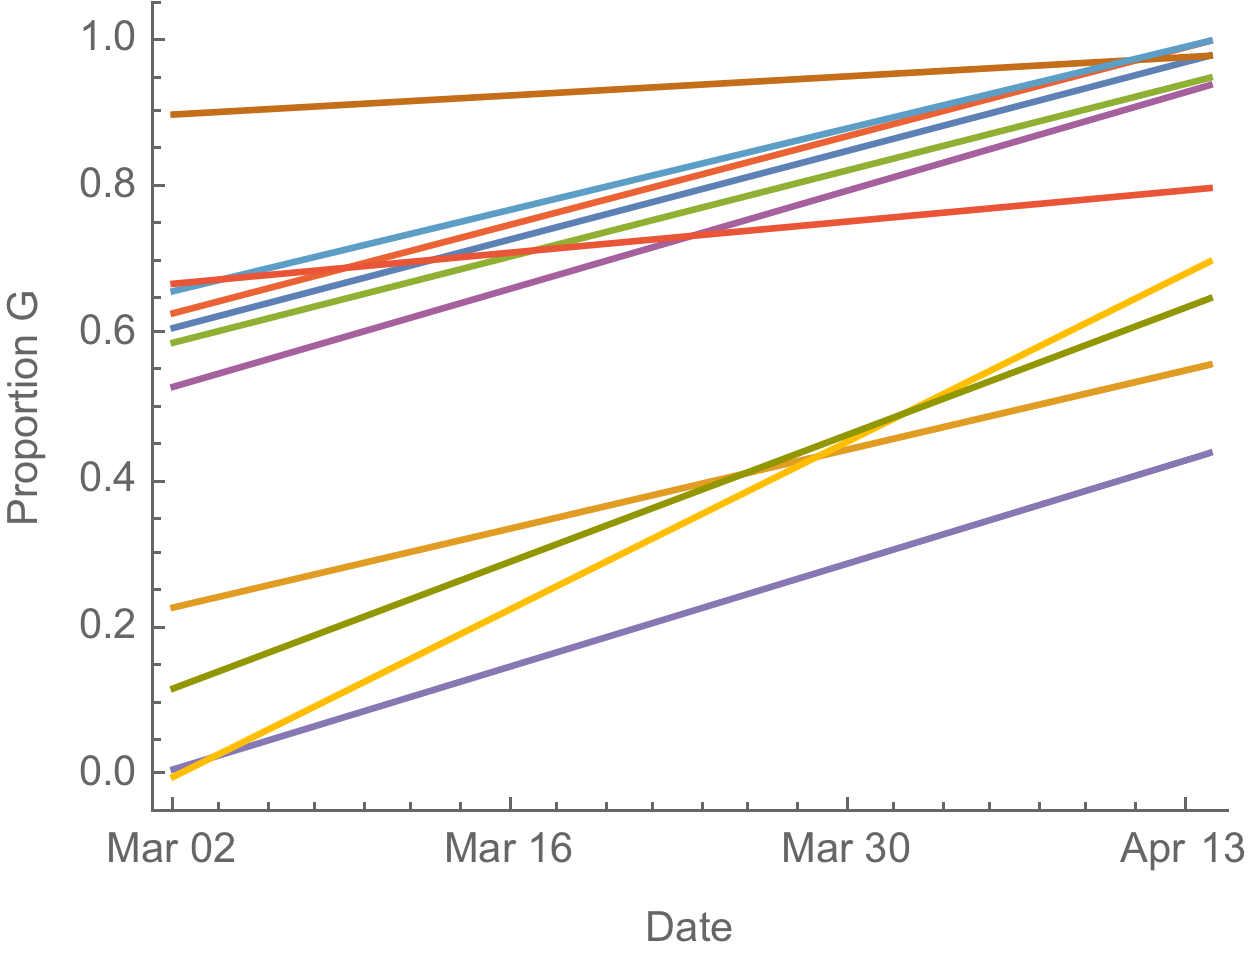
The success of D614G can be explained by either:
- D614G is more transmissible and has higher $R_0$
- founder effects and epidemiological confounding
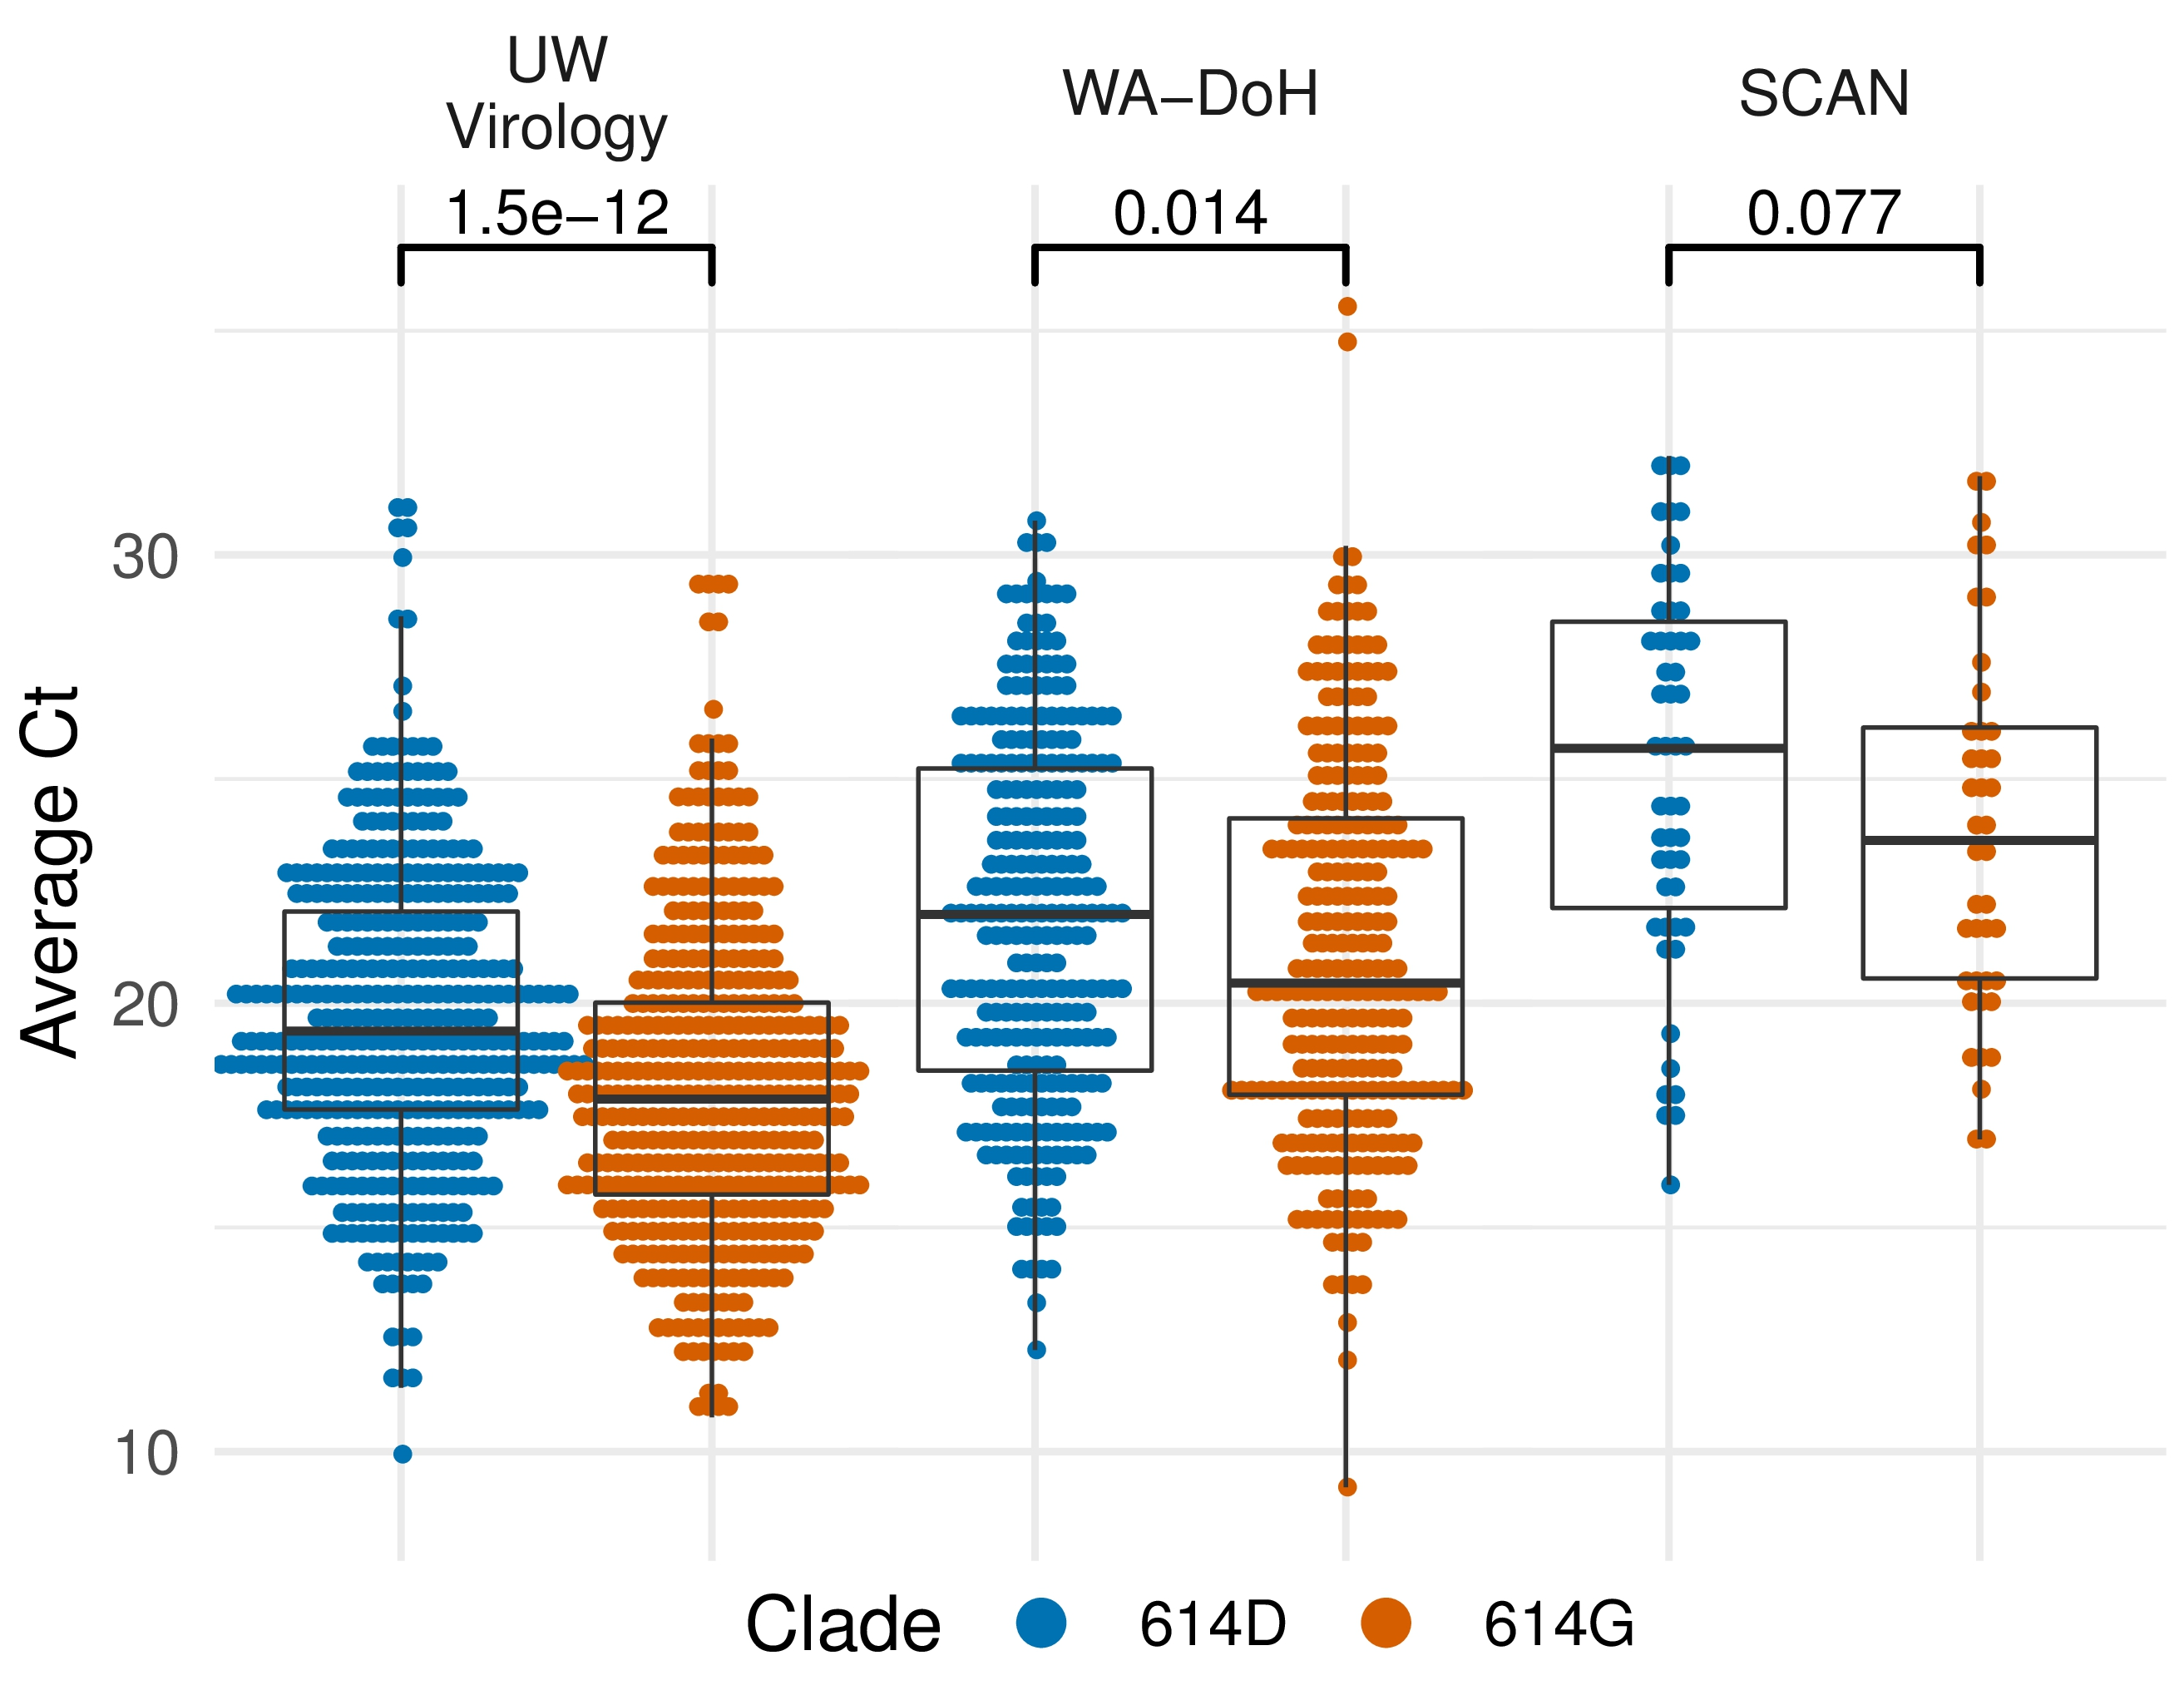
Additional evidence from Ct values of clinical specimens
Sheffield, UK Seattle, USA
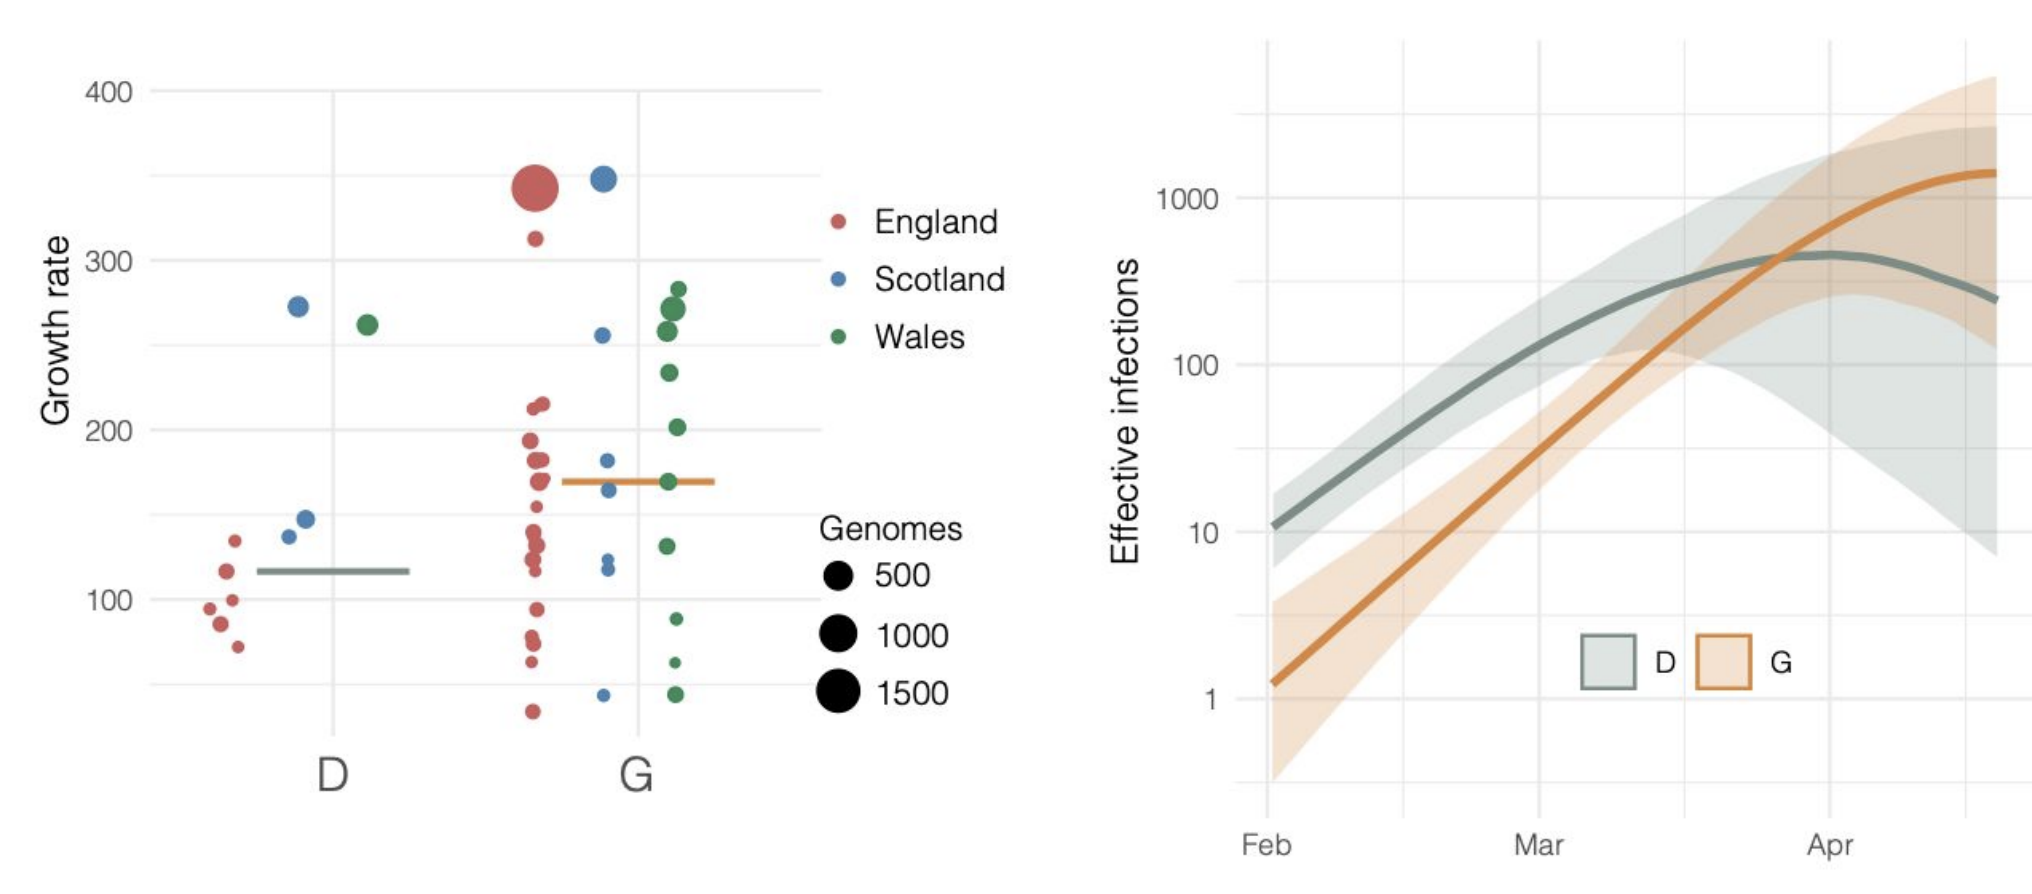
Repeated introductions to the UK suggest transmission advantage of D614G
Advancing genomic epidemiology
- Better methods for large datasets
- Distinguishing endogenous spread from importations
- Tying genomic epidemiology together with richer epi data to better understand local transmission
- Incorporating within-host variation to improve phylogenetic resolution
- Integrating clinical data to look for mutations that impact clinical outcomes
Using Nextstrain with your own data
Running analyses with Nextstrain
- Start with the public "ncov" repo on GitHub using this guide: nextstrain.github.io/ncov
- This is designed to run locally or on a cluster and combines data from GISAID with local data
- This produces an "Auspice JSON" like
ncov.jsonwhich can be viewed locally or on auspice.us
Sharing results with Nextstrain
- Auspice JSONs can be placed on GitHub (ala github.com/grubaughlab/CT-SARS-CoV-2) and will then be available through "Nextstrain Community" URLS (ala nextstrain.org/community/grubaughlab/CT-SARS-CoV-2)
- Auspice JSONs can be shared through Nextstrain Groups (ala nextstrain.org/groups/spheres), which also allows log ins and private datasets
- Alternatively, you can run your own Auspice server (ala auspice.broadinstitute.org), which gives full control of authentication (but requires more of an IT lift)
- Sensitive metadata can be dragged on in the browser (nothing is transmitted over the wire)
A few example "builds" at nextstrain.org/sars-cov-2
Nextstrain Narratives
- Narratives are Markdown posts that allow you to pair narrative text to visualization state
- Made possible through an early decision to embed visualization state in URL
- Example narrative for SARS-CoV-2 here: nextstrain.org/narratives/ncov/sit-rep/2020-04-24
All this relies on rapid and open sharing of pathogen genomic data
All Nextstrain code is entirely open source and intended to be used by the community. We've been working hard on improving documentation at nextstrain.org/docs. We've also opened a discussion board for questions at discussion.nextstrain.org.
Acknowledgements
Genomic epi: Data producers from all over the world, GISAID and the Nextstrain team
Bedford Lab:
![]() Alli Black,
Alli Black,
![]() John Huddleston,
John Huddleston,
![]() James Hadfield,
James Hadfield,
![]() Katie Kistler,
Katie Kistler,
![]() Louise Moncla,
Louise Moncla,
![]() Maya Lewinsohn,
Maya Lewinsohn,
![]() Thomas Sibley,
Thomas Sibley,
![]() Jover Lee,
Jover Lee,
![]() Kairsten Fay,
Kairsten Fay,
![]() Misja Ilcisin,
Misja Ilcisin,
![]() Cassia Wagner,
Cassia Wagner,
![]() Miguel Paredes,
Miguel Paredes,
![]() Nicola Müller,
Nicola Müller,
![]() Marlin Figgins,
Marlin Figgins,
![]() Eli Harkins
Eli Harkins