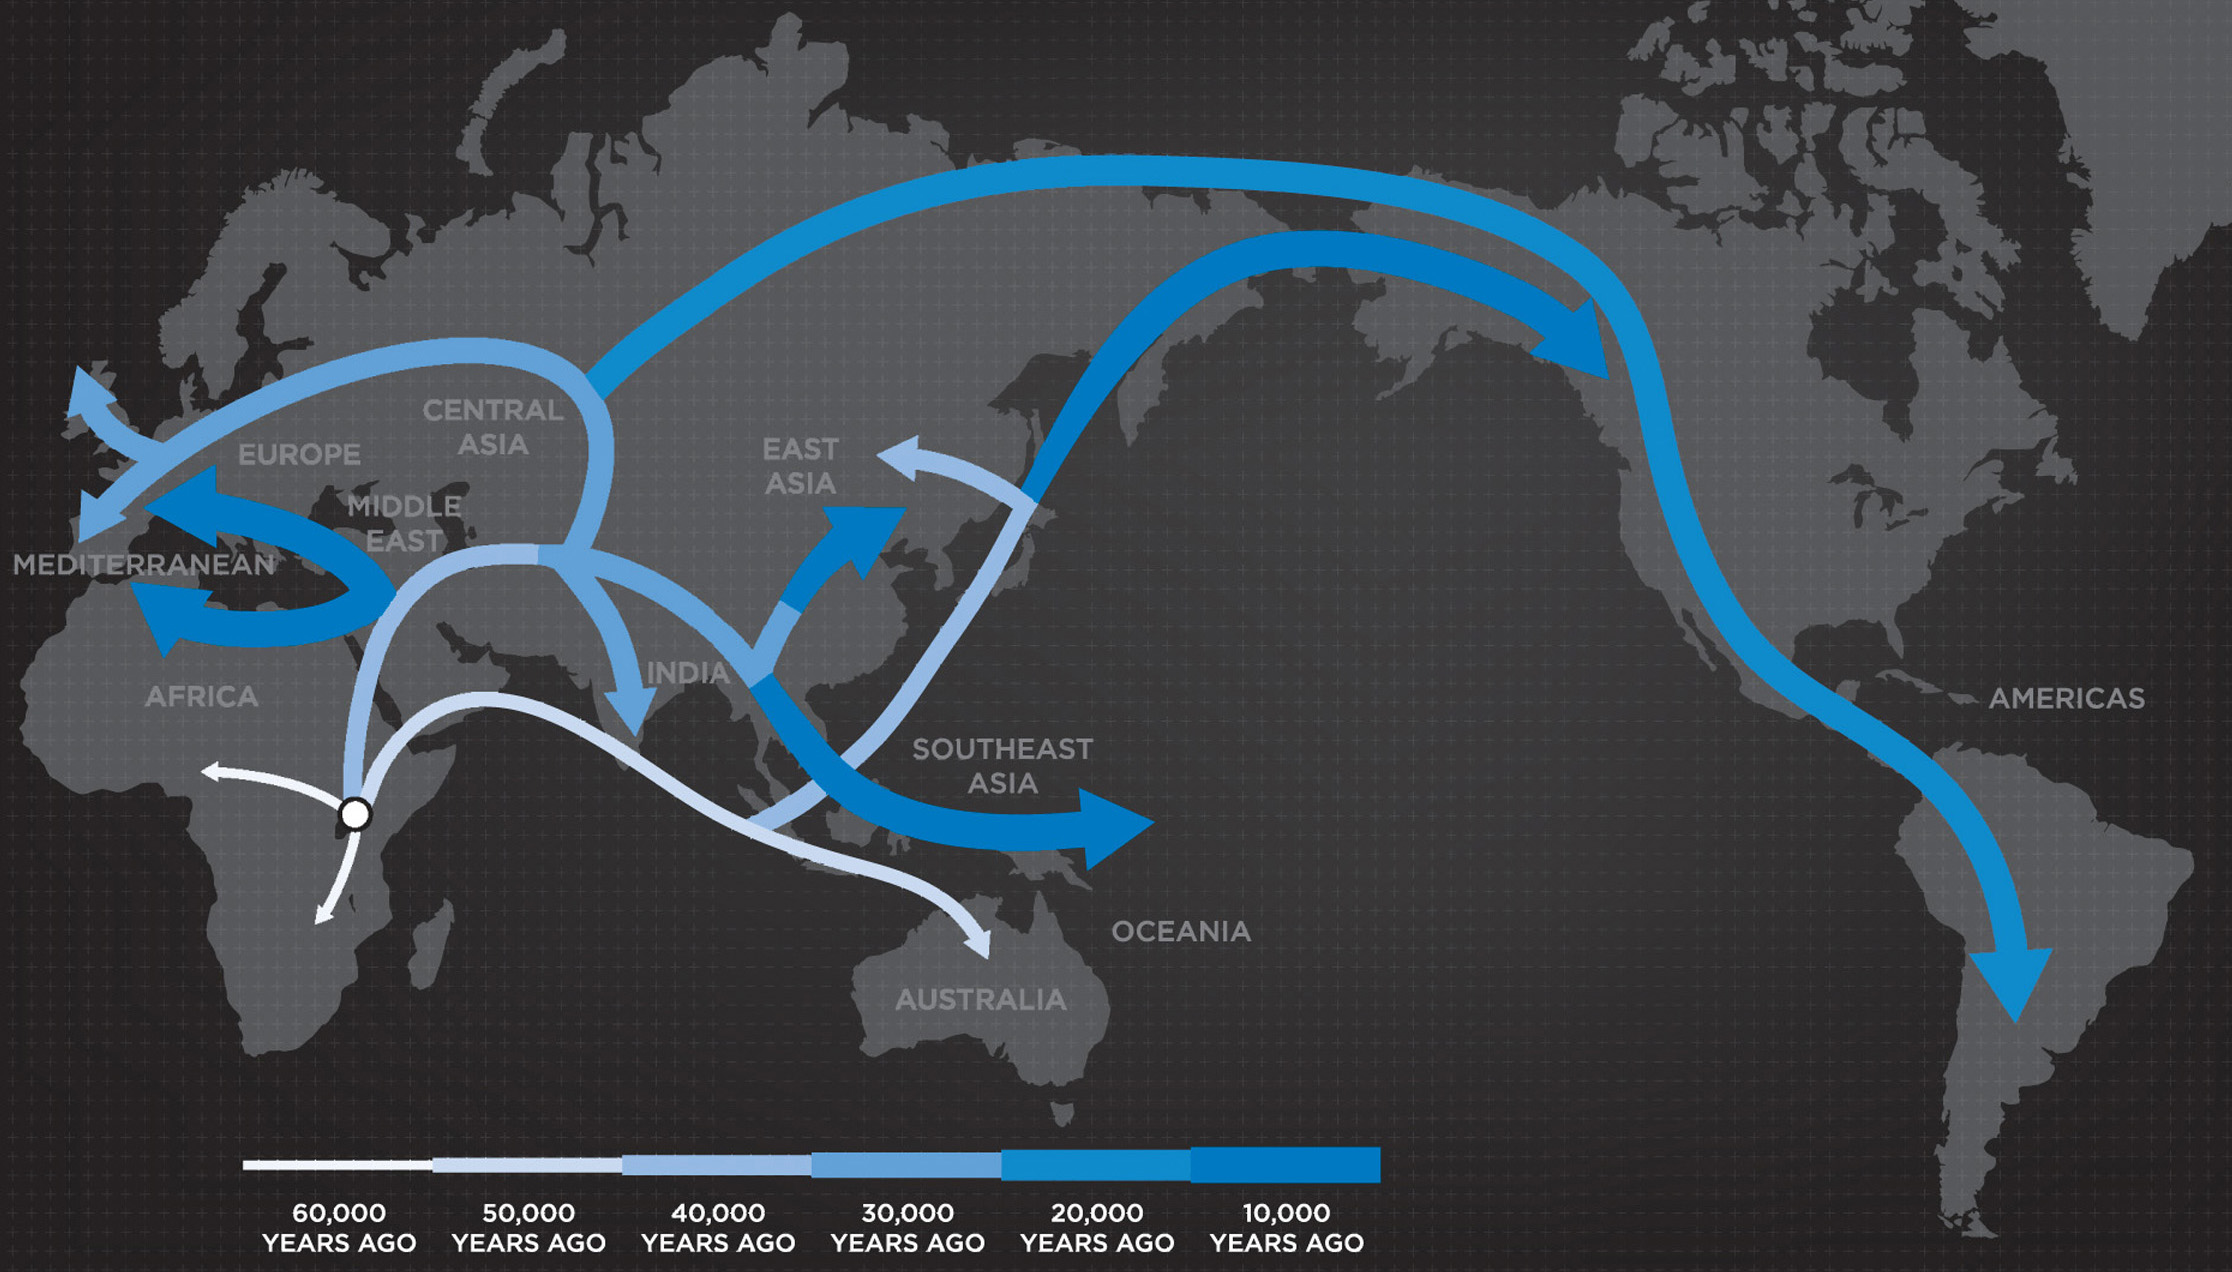
Big data
July 1, 2016
Medium data
July 1, 2016
http://bedford.io/projects/medium-data/
Data tells a story
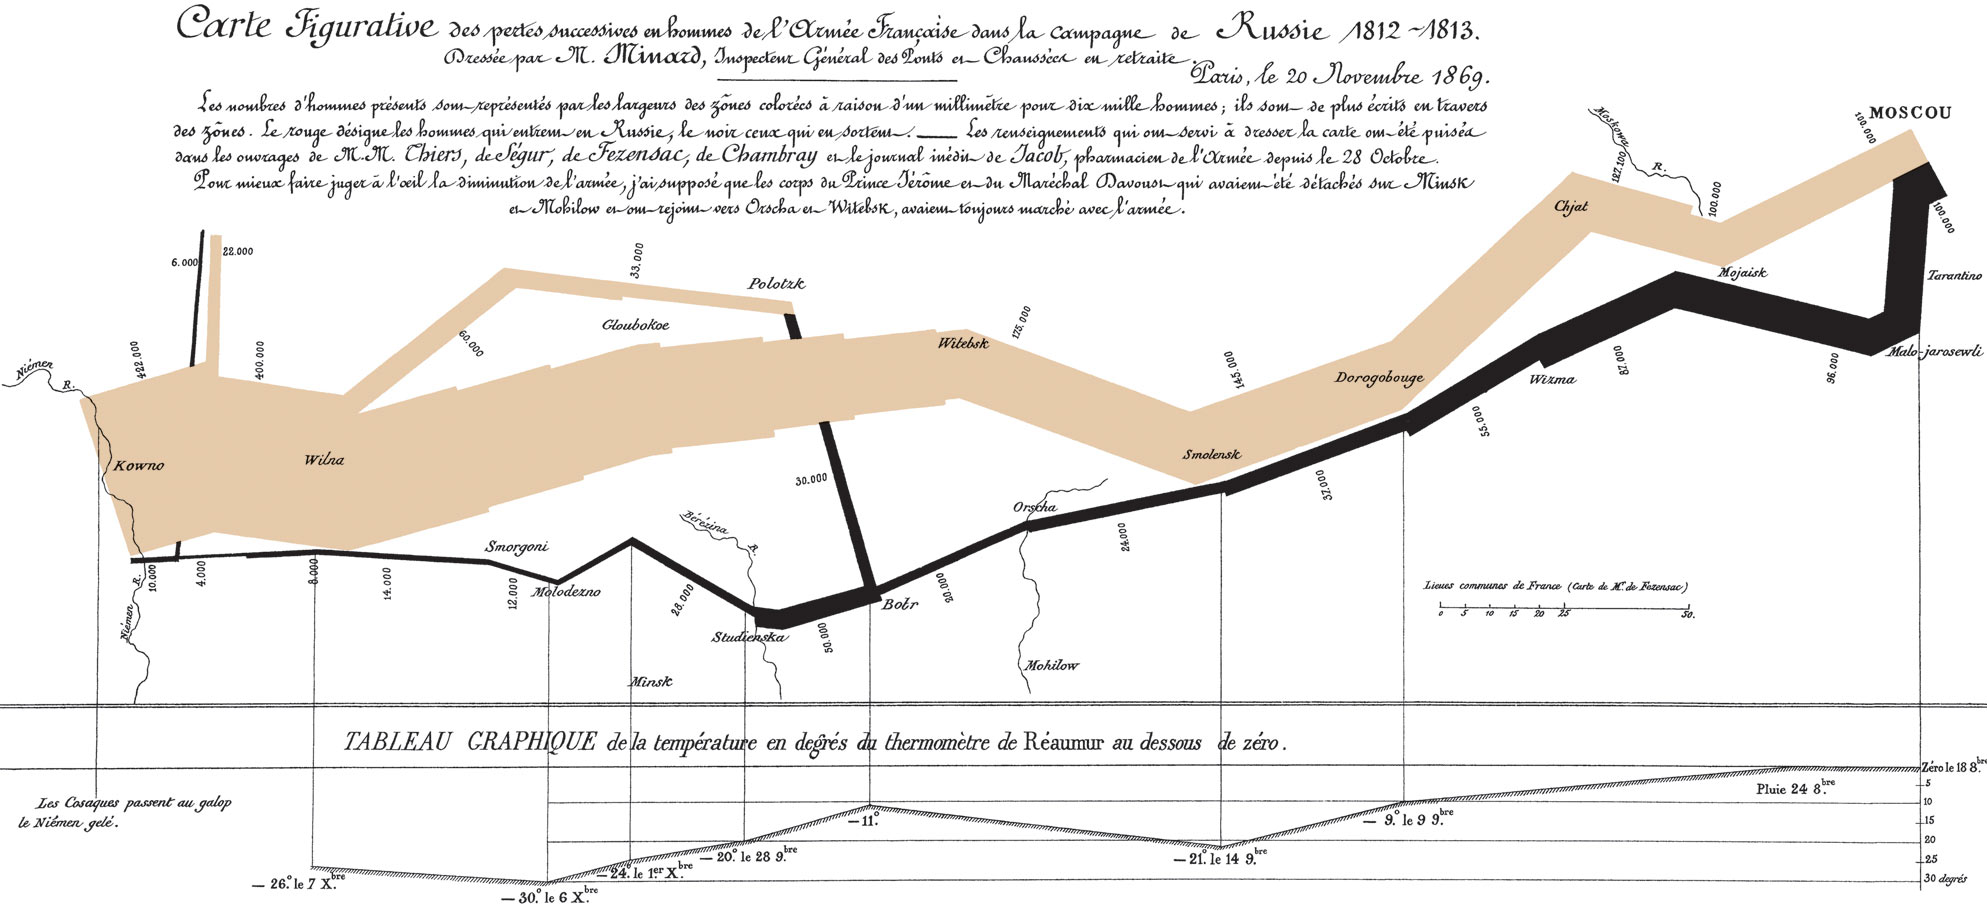
Charles Minard and Napoleon's 1812 campaign
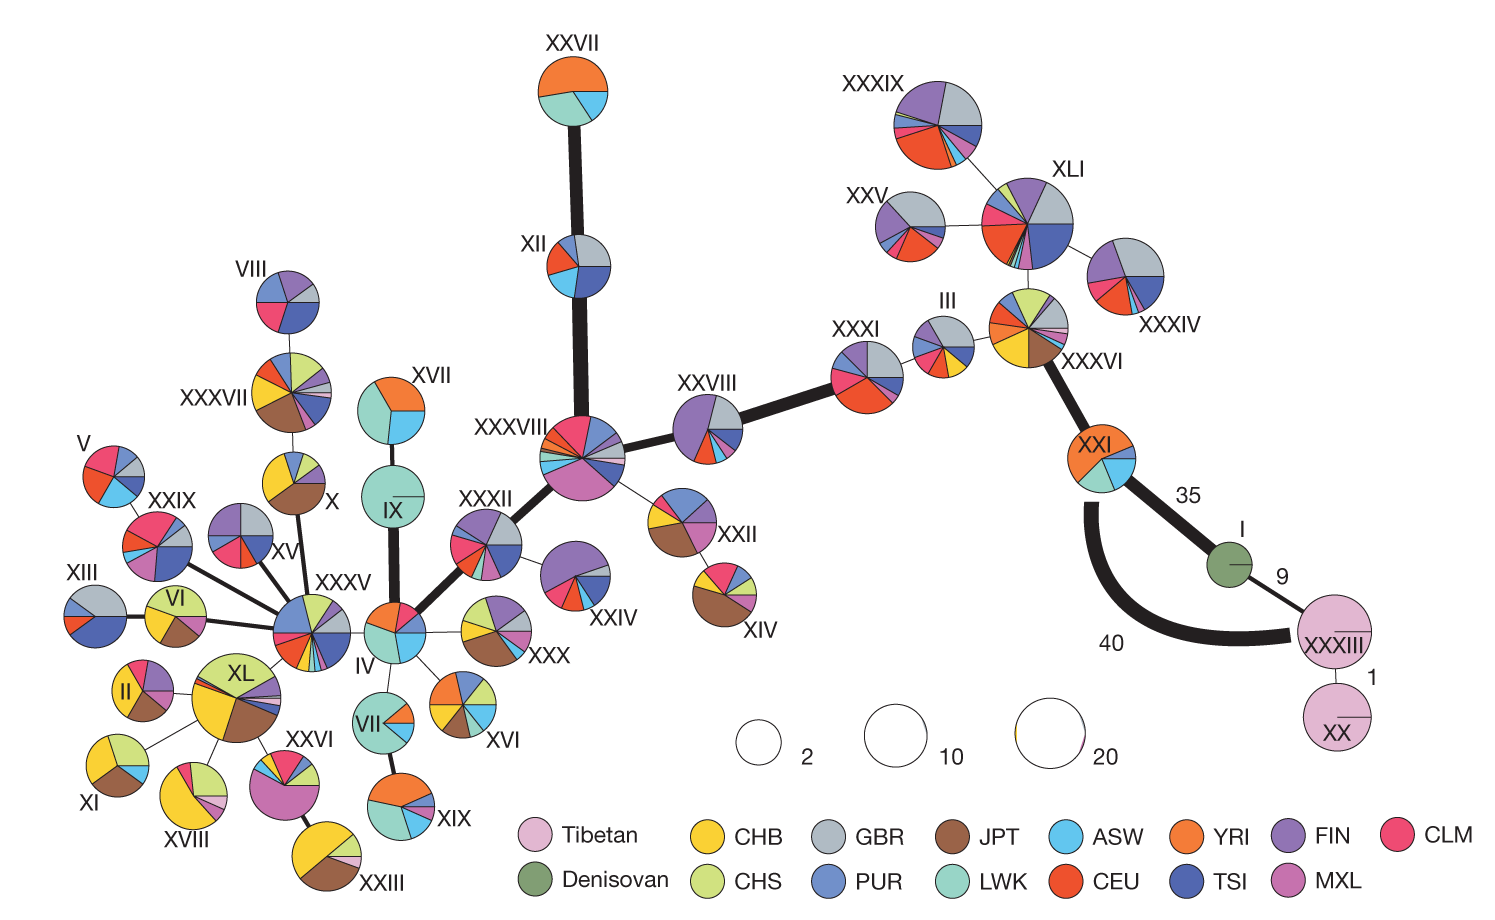
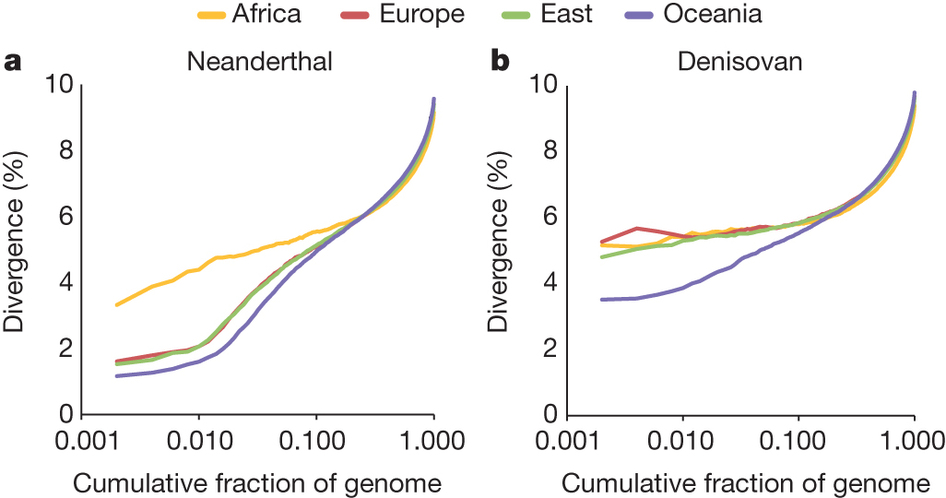
The EPAS1 gene and high-altitude adaptation in Tibetans
Tibet is high
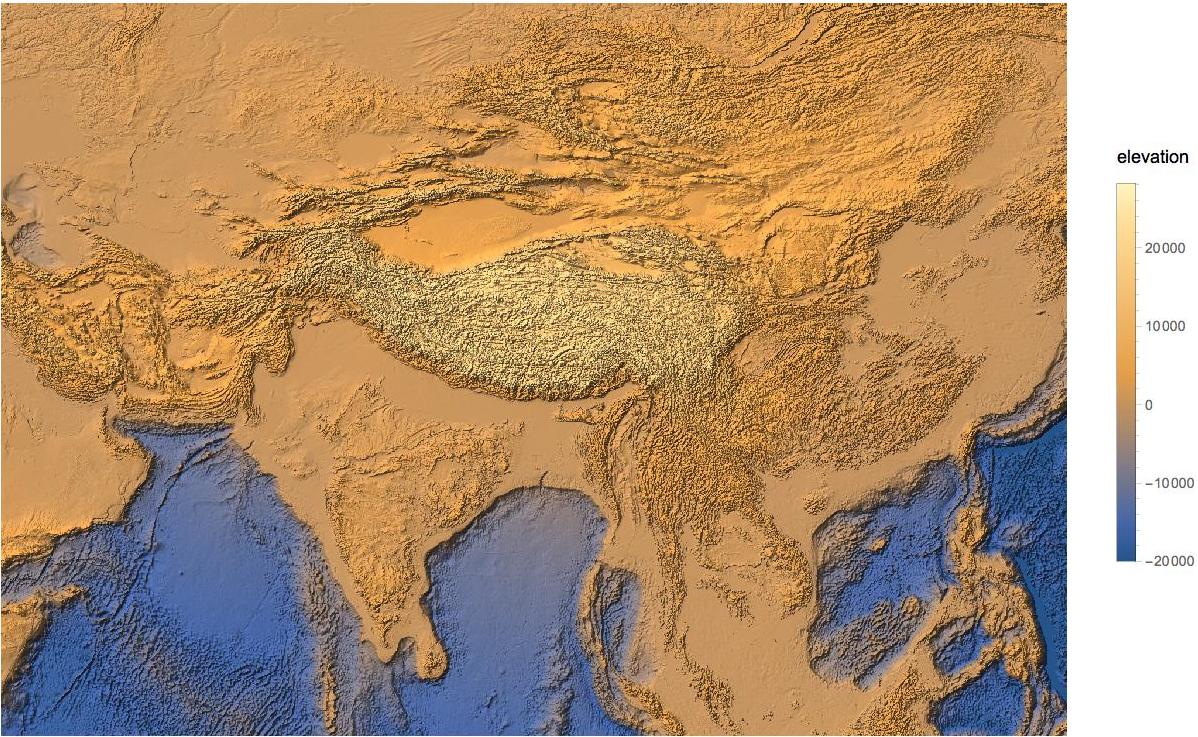
Tibetans are adapted to high altitudes
- ~600,000 people live at 14,800+ ft in elevation, where oxygen is only 60% of sea level
- Among other traits, Tibetans are protected from chronic mountain sickness, exhibiting little increase in hemoglobin concentration at high altitudes
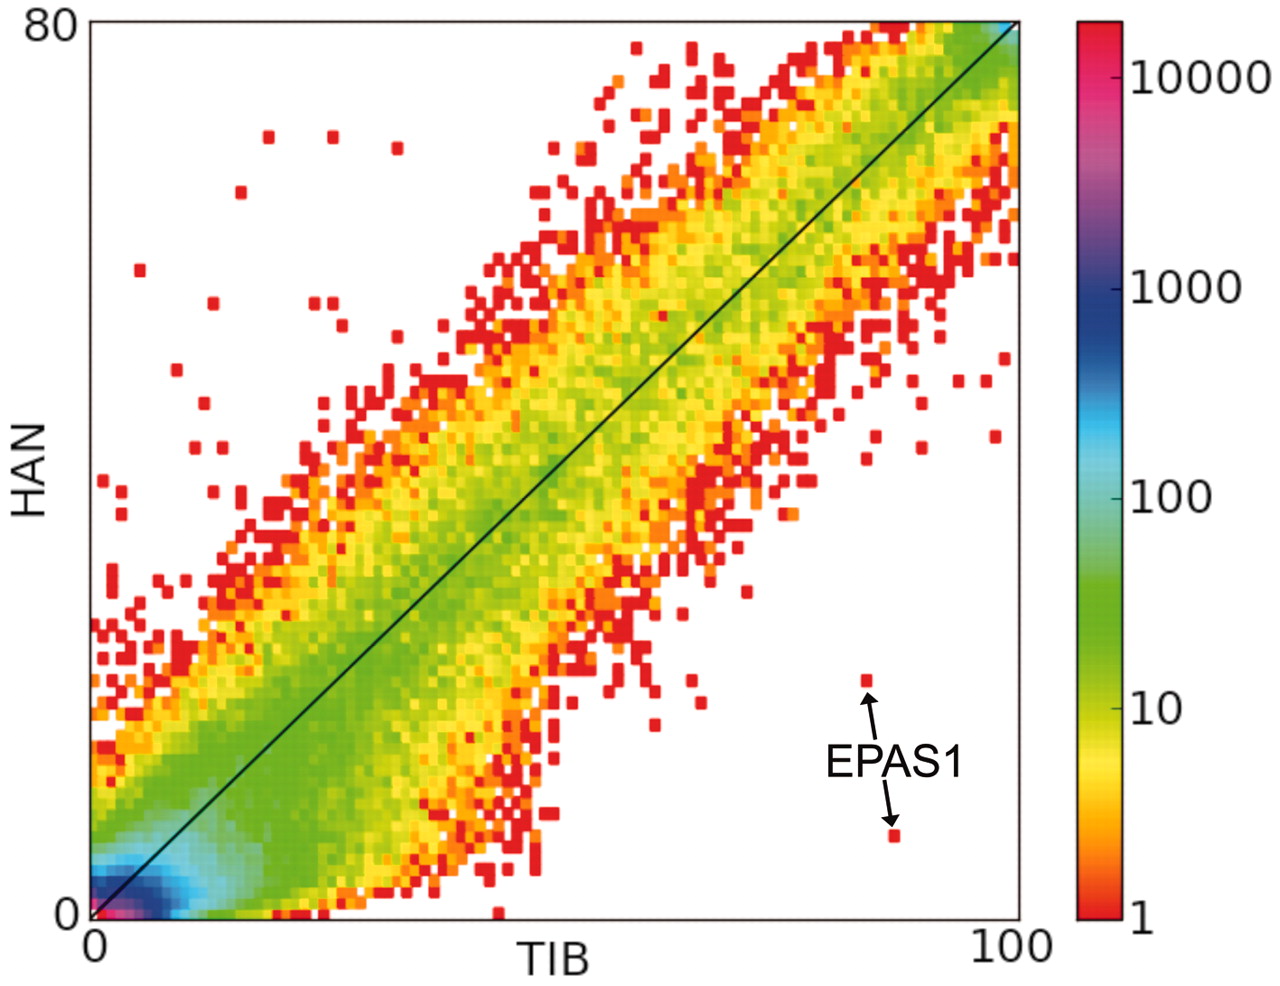
Tibetan EPAS1 is diverged from other populations
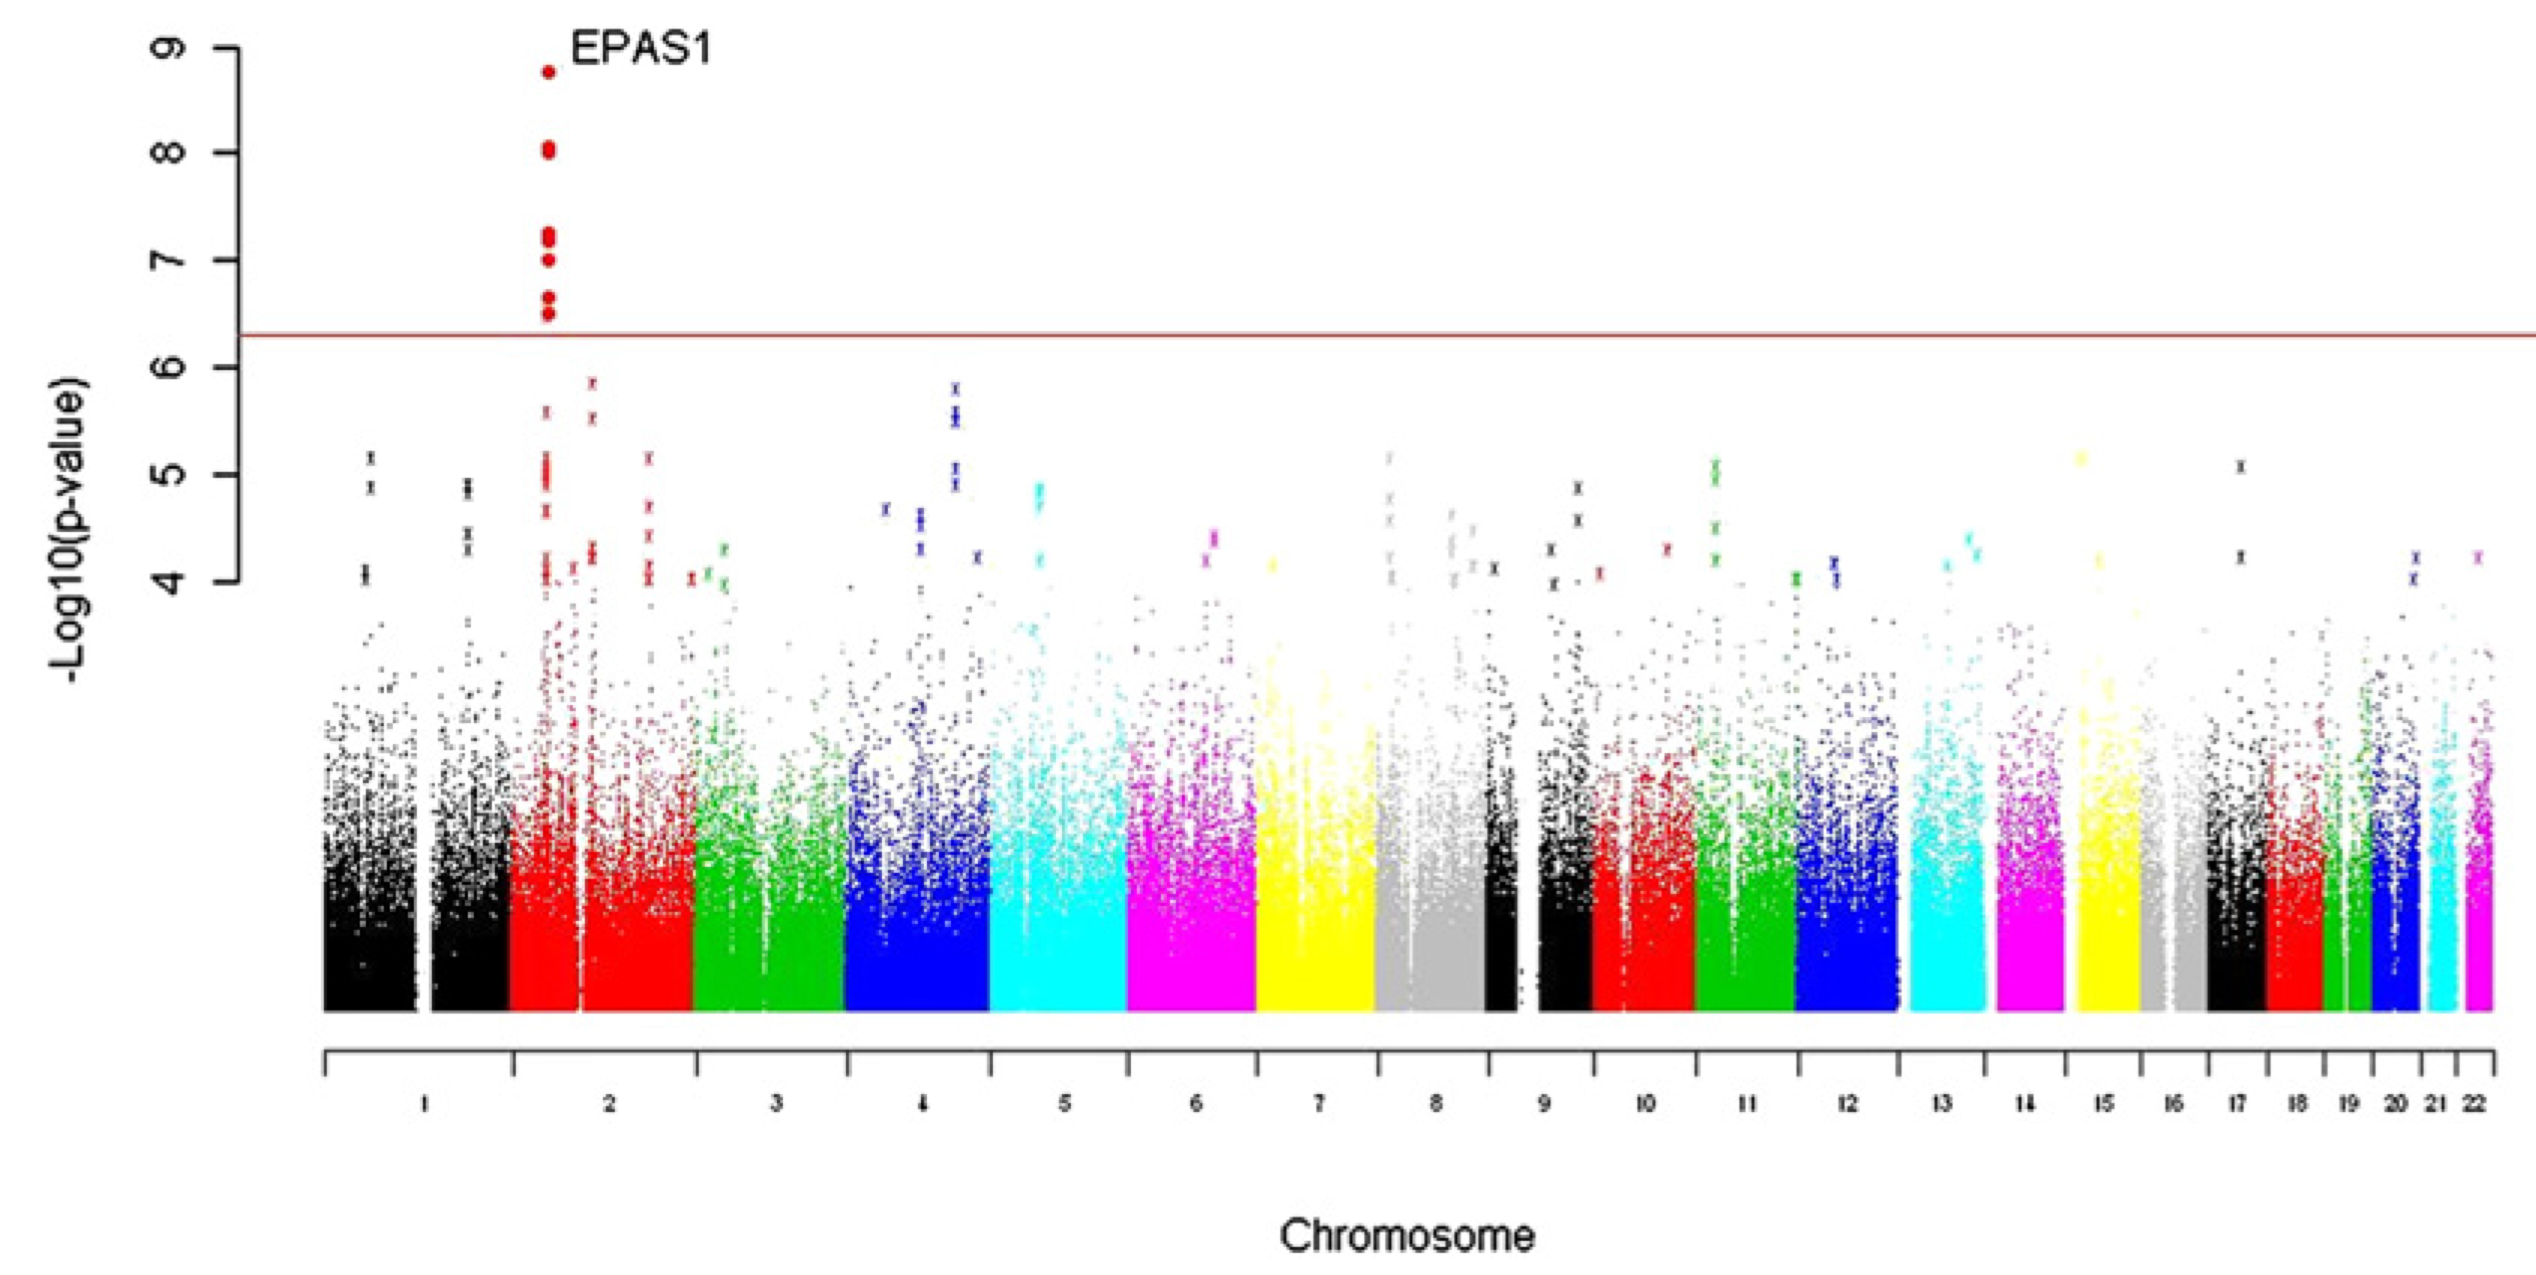
Tibetan EPAS1 is diverged from other populations
EPAS1 is a transcription factor involved in the body's response to oxygen level
Story was in situ adaptation in Tibetans to high altitude
Tibetan EPAS1 derives from Denisovan DNA
Denisovans?
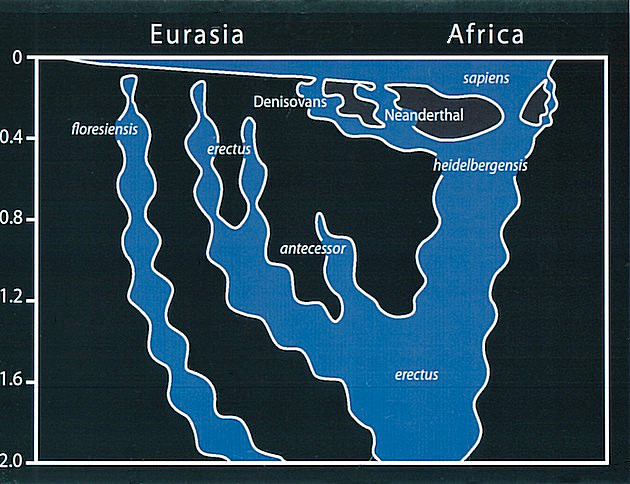
Evolutionary relationships between human species
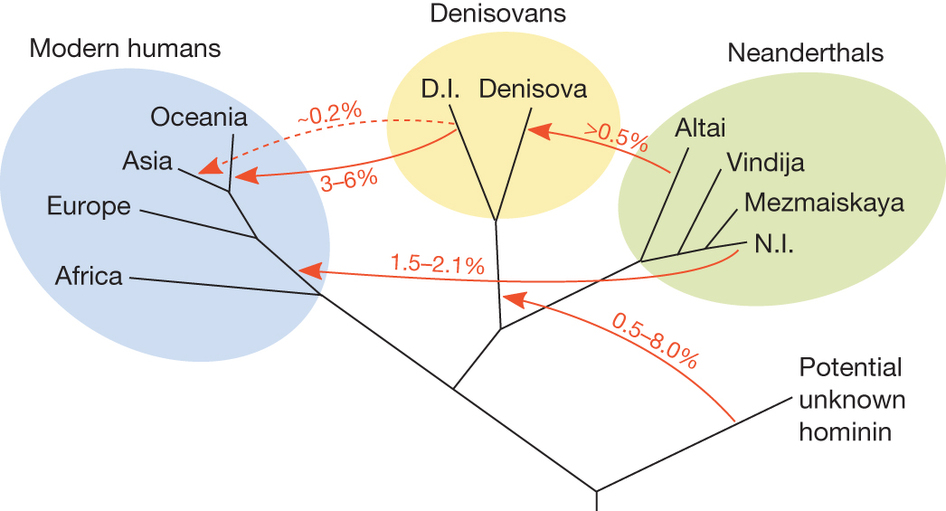
Extinction of Neanderthals and Denisovans
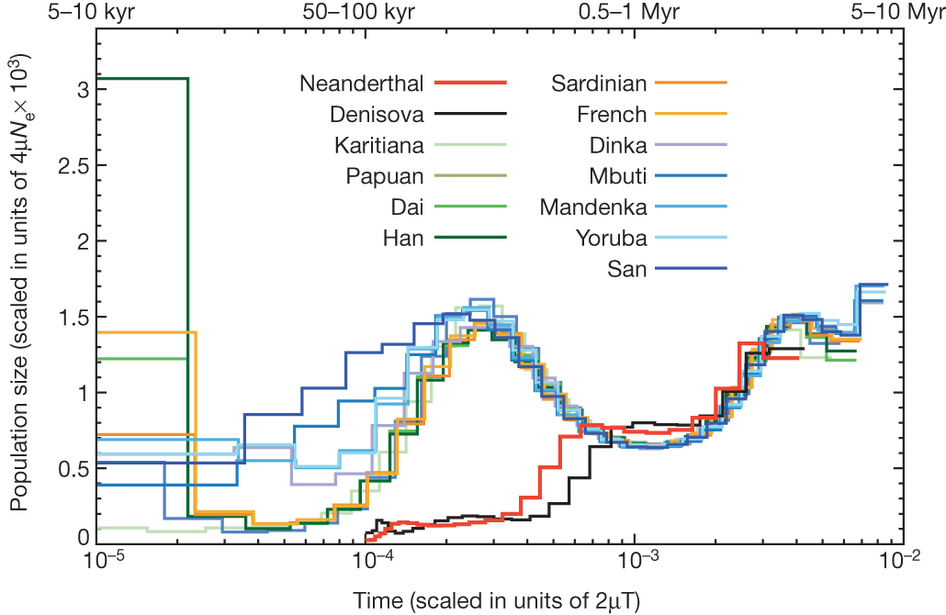
Relatedness between modern and archaic populations
Working with data
Step 1. Download data from public repository
For example, fludb.orgStep 2. Clean up data and get it into a proper format
strain	date	date_decimal	date_precision	region	country	general_location	specific_location	source	accession	sequence
A/Alabama/WRAIR1242P/2009	2009-02-01	2009.085	day	USACanada	USA	Alabama	Alabama	IRD	CY093263	AACGCTGTGCCTTGGGCACCATGCAGTACCAAACGGAACGATAGTGAAAACAATCACGAATGACCAAATTGAAGTTACTA
A/Alexandroupolis/99/2007	2007-02-15	2007.123	day	Europe	Greece	Greece	Alexandroupolis	IRD	EU716078	AACGCTGTGCCTTGGGCACCATGCAGTACCAAACGGAACGATAGTGAAAACAATCACGAATGACCAAATTGAAGTTACTA
A/Ashburton/280/2004	2004-10-12	2004.781	day	Oceania	NewZealand	NewZealand	Ashburton	IRD	CY002954	AACGCTGTGCCTTGGGCACCATGCAGTACCAAACGGAACGATAGTGAAAACAATCACGAATGACCAAATTGAAGTTACTA
A/Auckland/599/2000	2000-09-22	2000.726	day	Oceania	NewZealand	NewZealand	Auckland	IRD	CY023034	AACGCTGTGCCTGGGGCACCATGCAGTGCCAAACGGAACGCTAGTGAAAACAATCACGAATGACCAAATTGAAGTGACTA
A/Australia/34/2009	2009-07-24	2009.559	day	Oceania	Australia	Australia	Australia	IRD	CY080555	AACGCTGTGCCTTGGGCACCATGCAGTACCAAACGGAACGATAGTGAAAACAATCACGAATGACCAAATTGAAGTTACTA
A/Austria/211557/2005	2005-03-01	2005.162	day	Europe	Austria	Austria	Austria	IRD	EU106666	AACGCTGTGCCTTGGGCACCATGCAGTACCAAACGGAACGATAGTGAAAACAATCACGAATGACCAAATTGAAGTTACTA
A/Bahia/100/2011	2011-03-24	2011.225	day	SouthAmerica	Brazil	Brazil	Bahia	IRD	CY099978	AACGCTGTGCCTTGGGCACCATGCAGTGCCAAACGGAACGATAGTGAAAACAATCACGAATGACCAAATTGAAGTTACTA
A/Bangladesh/C5_12/2003	2003-XX-XX	2003.0	year	India	Bangladesh	Bangladesh	Bangladesh	IRD	DQ179512	AACGCTGTGCCTTGGGCACCATGCAGTACCAAACGGAACGATAGTGAAAACAATCACGAATGACCAAATTGAAGTTACTA
A/Beijing/12611/2010	2010-11-01	2010.833	day	NorthChina	China	Beijing	Beijing	Russell	NA	AACGCTGTGCCTTGGGCACCATGCAGTACCAAACGGAACGATAGTGAAAACAATCACGAATGACCAAATTGAAGTTACTA
...
Step 3. ?????
Step 3. Stastistically process data to generate inferences
Use phylogenetics to infer evolutionary relationships.
7 2664 2668 2669 2685 2747 2752 2753 2755 2756 2744 2745 2741 2739 2727 2634 180 77 78 254 303 2621 2606 2617 320 343 356 373
0 8 9 10 244 304 305 306 315 357 390 400 419 457 458 504 535 573 593 607 623 645 868 869 871 872 873 874 878 934 935 936 937
3->0 7->3 8->0 2642->8 2643->2642 2644->2643 2656->2644 2657->2656 2662->2657 2664->2662 2666->2656 2667->2666 2668->2667 266
0->India 3->Europe 7->SoutheastAsia 8->USACanada 2642->Europe 2643->USACanada 2644->Europe 2656->USACanada 2657->Europe 2662
0->{1997.685450,5.683161} 3->{1999.233555,0.000000} 7->{2000.085000,0.000000} 8->{1998.544642,11.366322} 2642->{1999.114123,
7->A/BANGKOK/62/2000 2664->A/BANGKOK/86/2001 2668->A/BANGKOK/178/2000 2669->A/BANGKOK/202/2000 2685->A/SINGAPORE/2/2000 2747
0->{0.000000,0.000000} 3->{0.000000,0.000000} 7->{0.000000,0.000000} 8->{0.000000,0.000000} 2642->{0.000000,0.000000} 2643->
Step 4. PROFIT!!!
Step 4. Make cool figures
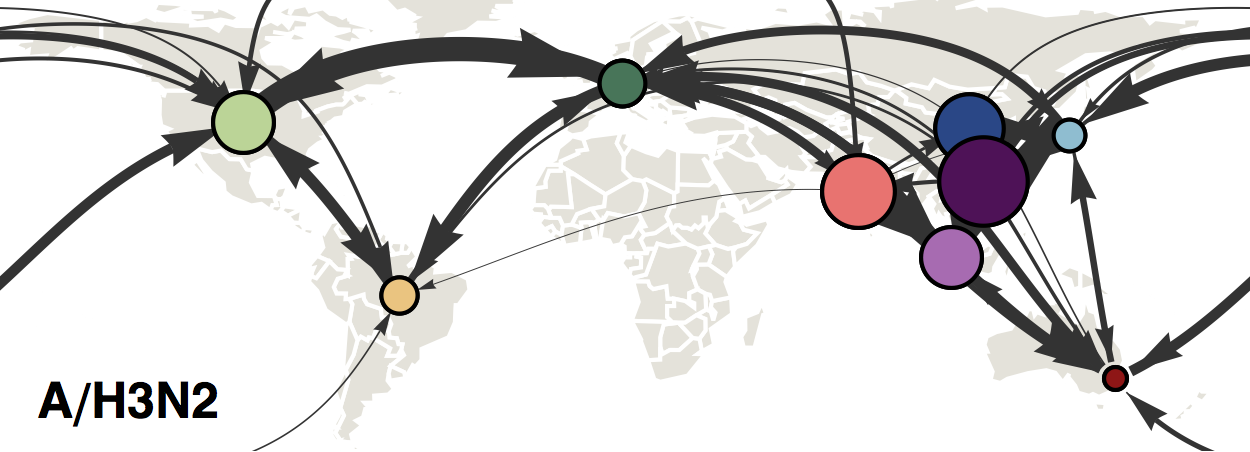
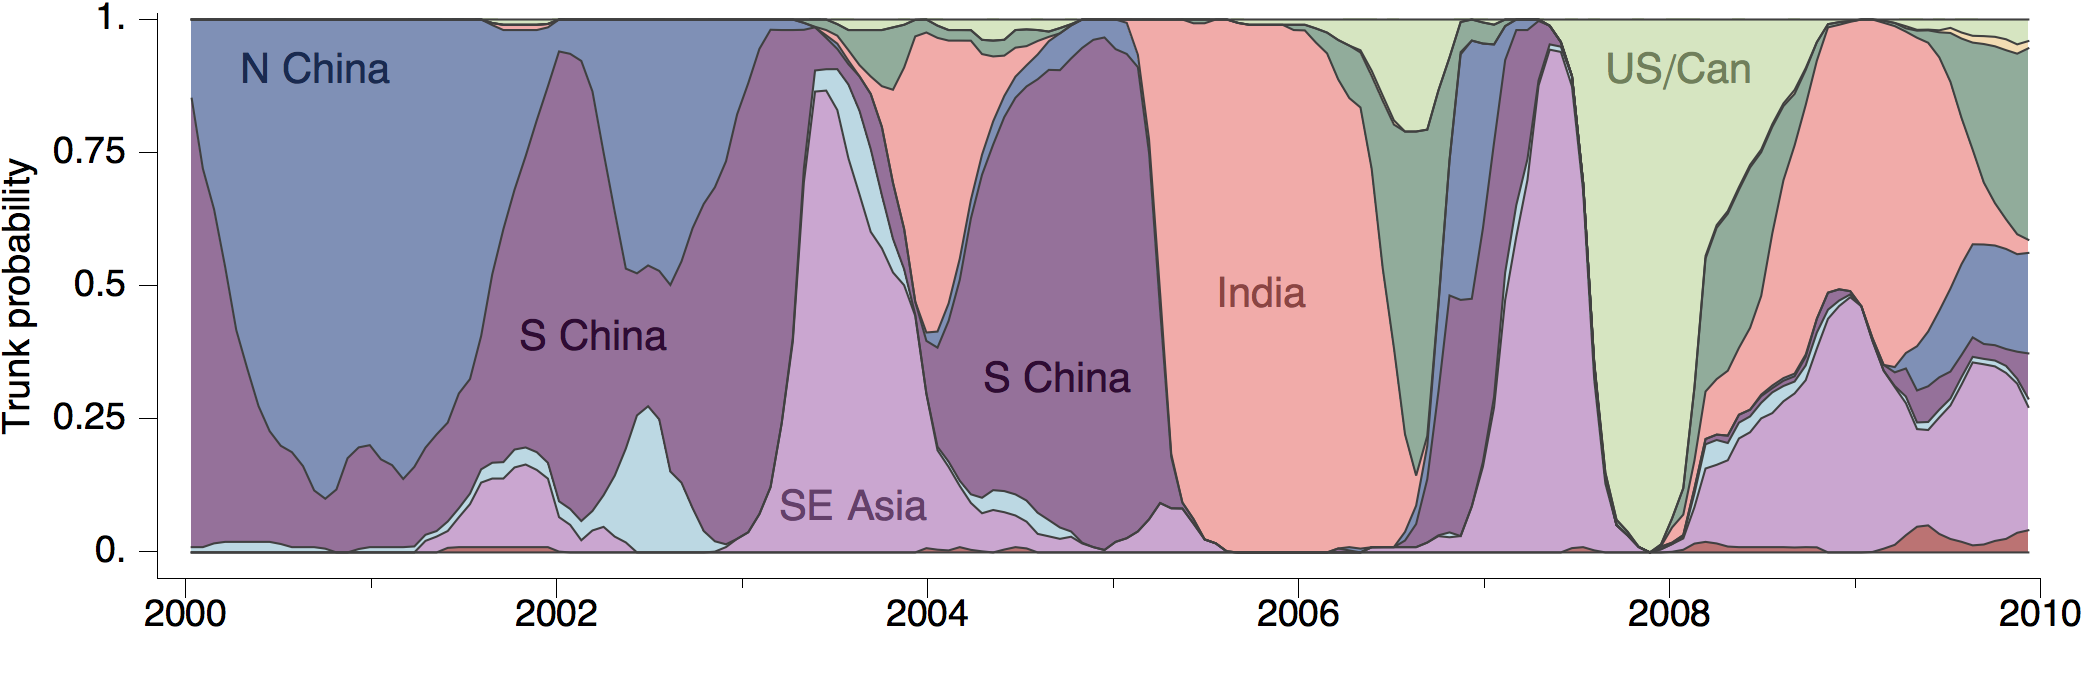
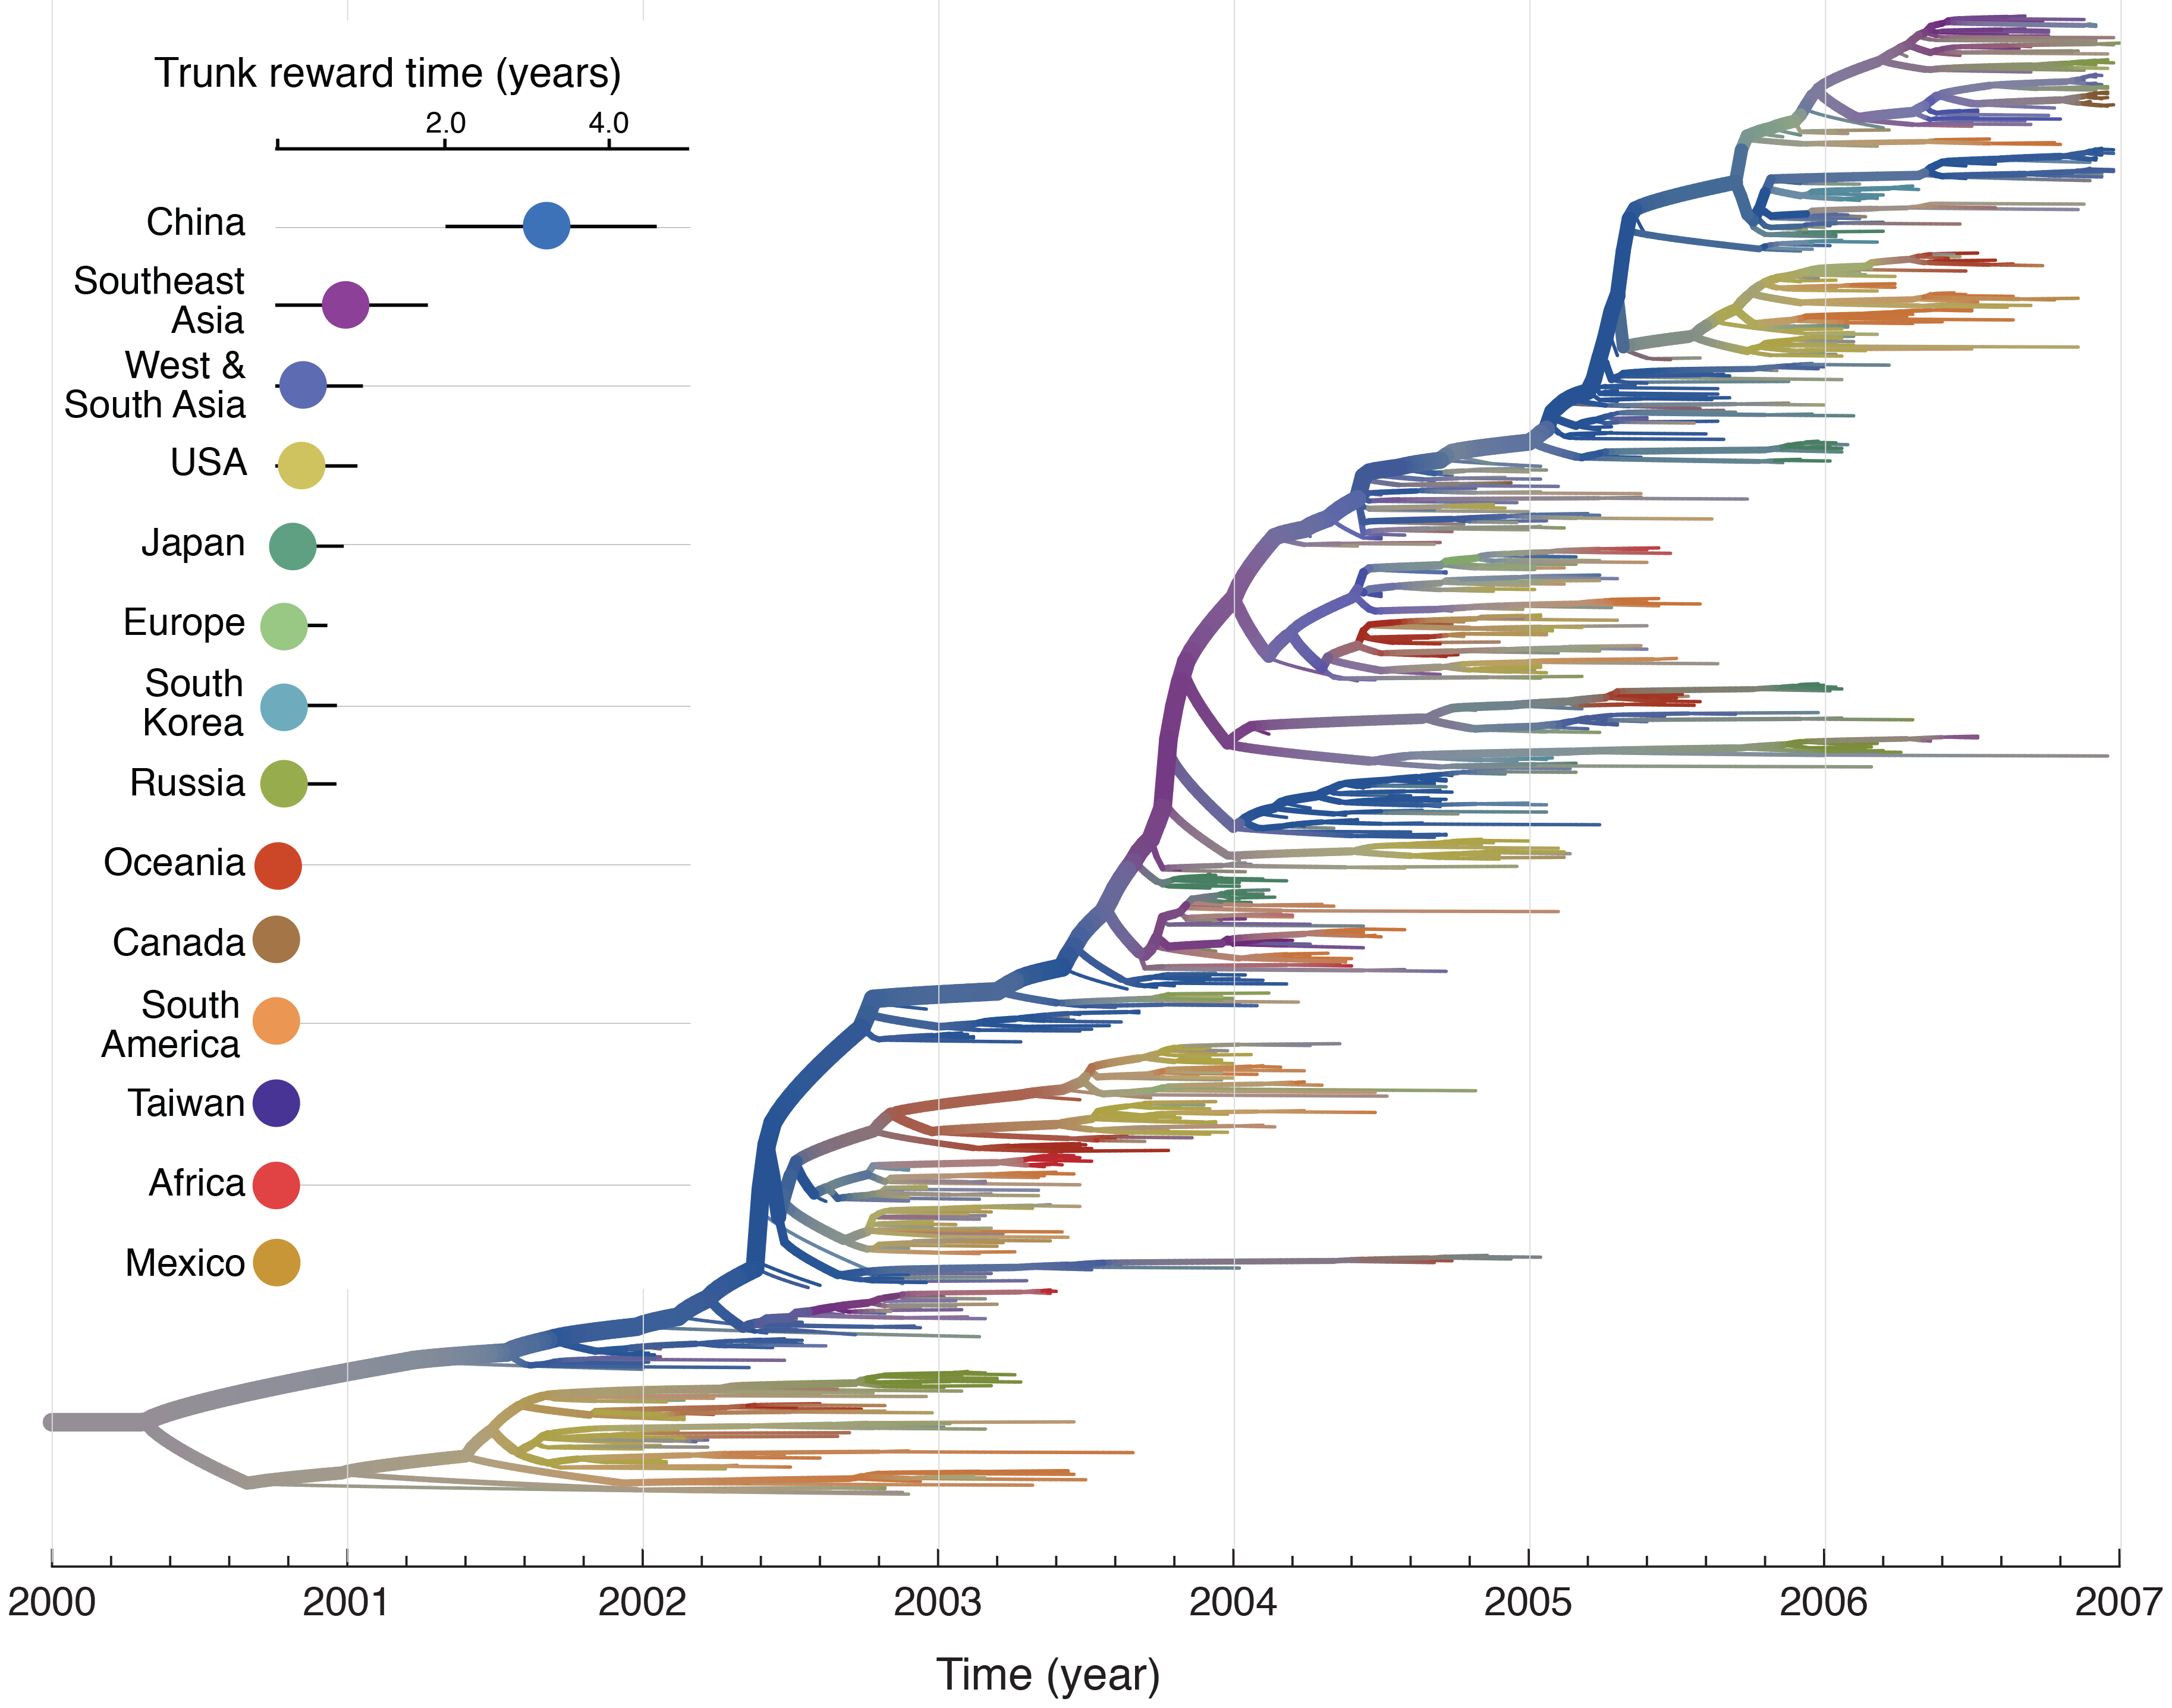
Flu phylogeny shows how viruses are related to one another
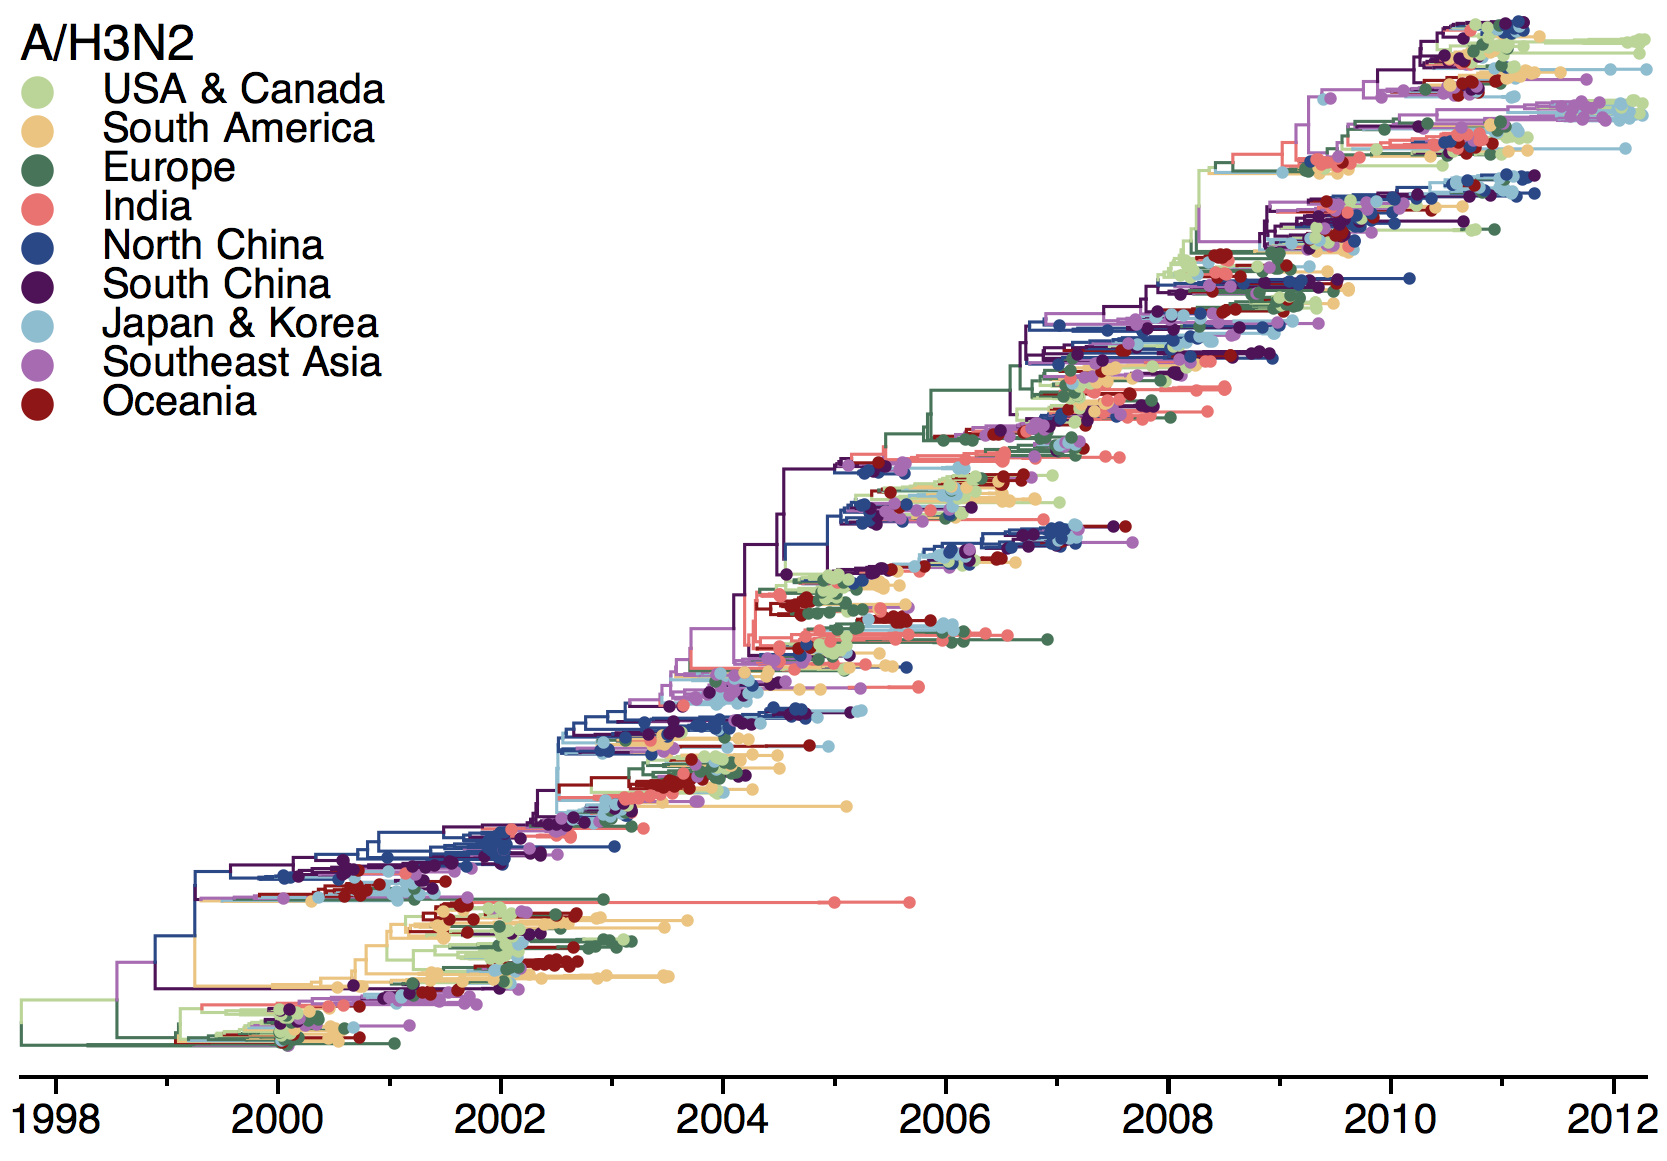
USA viruses tend to be evolutionary dead-ends
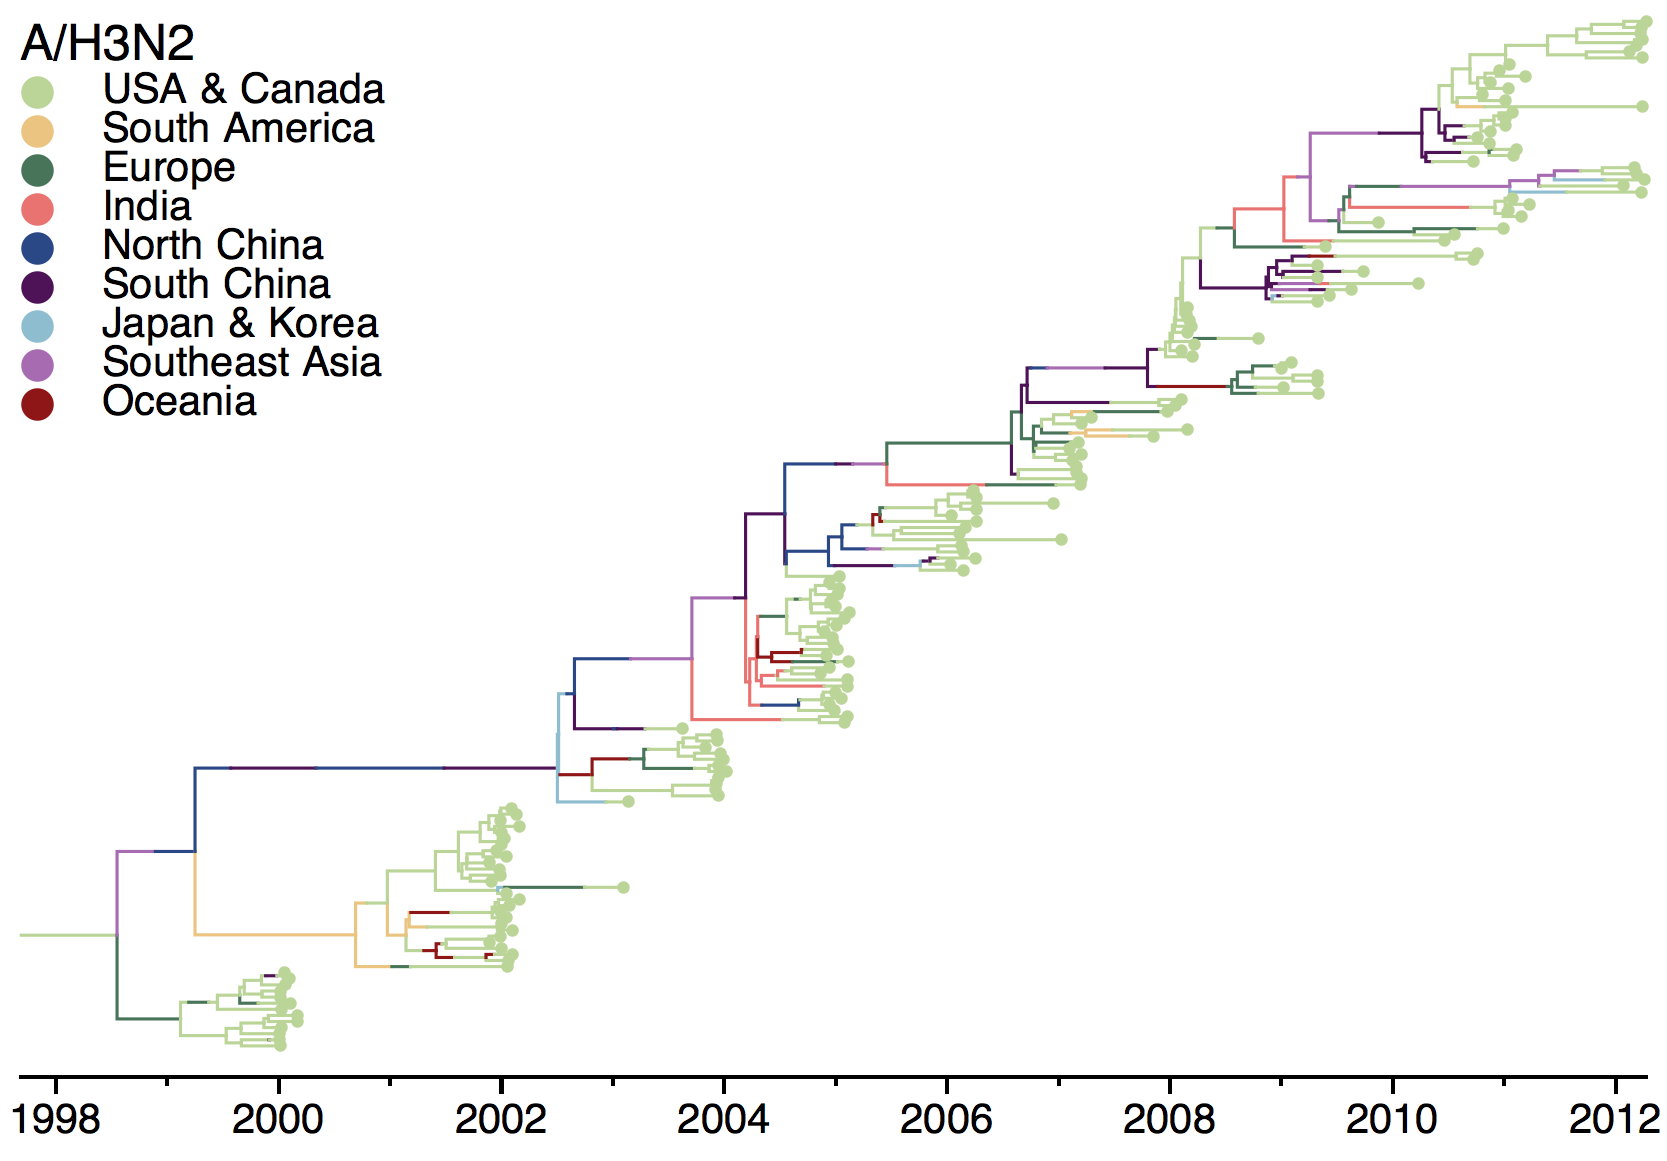
Chinese viruses tend to be evolutionary starting points
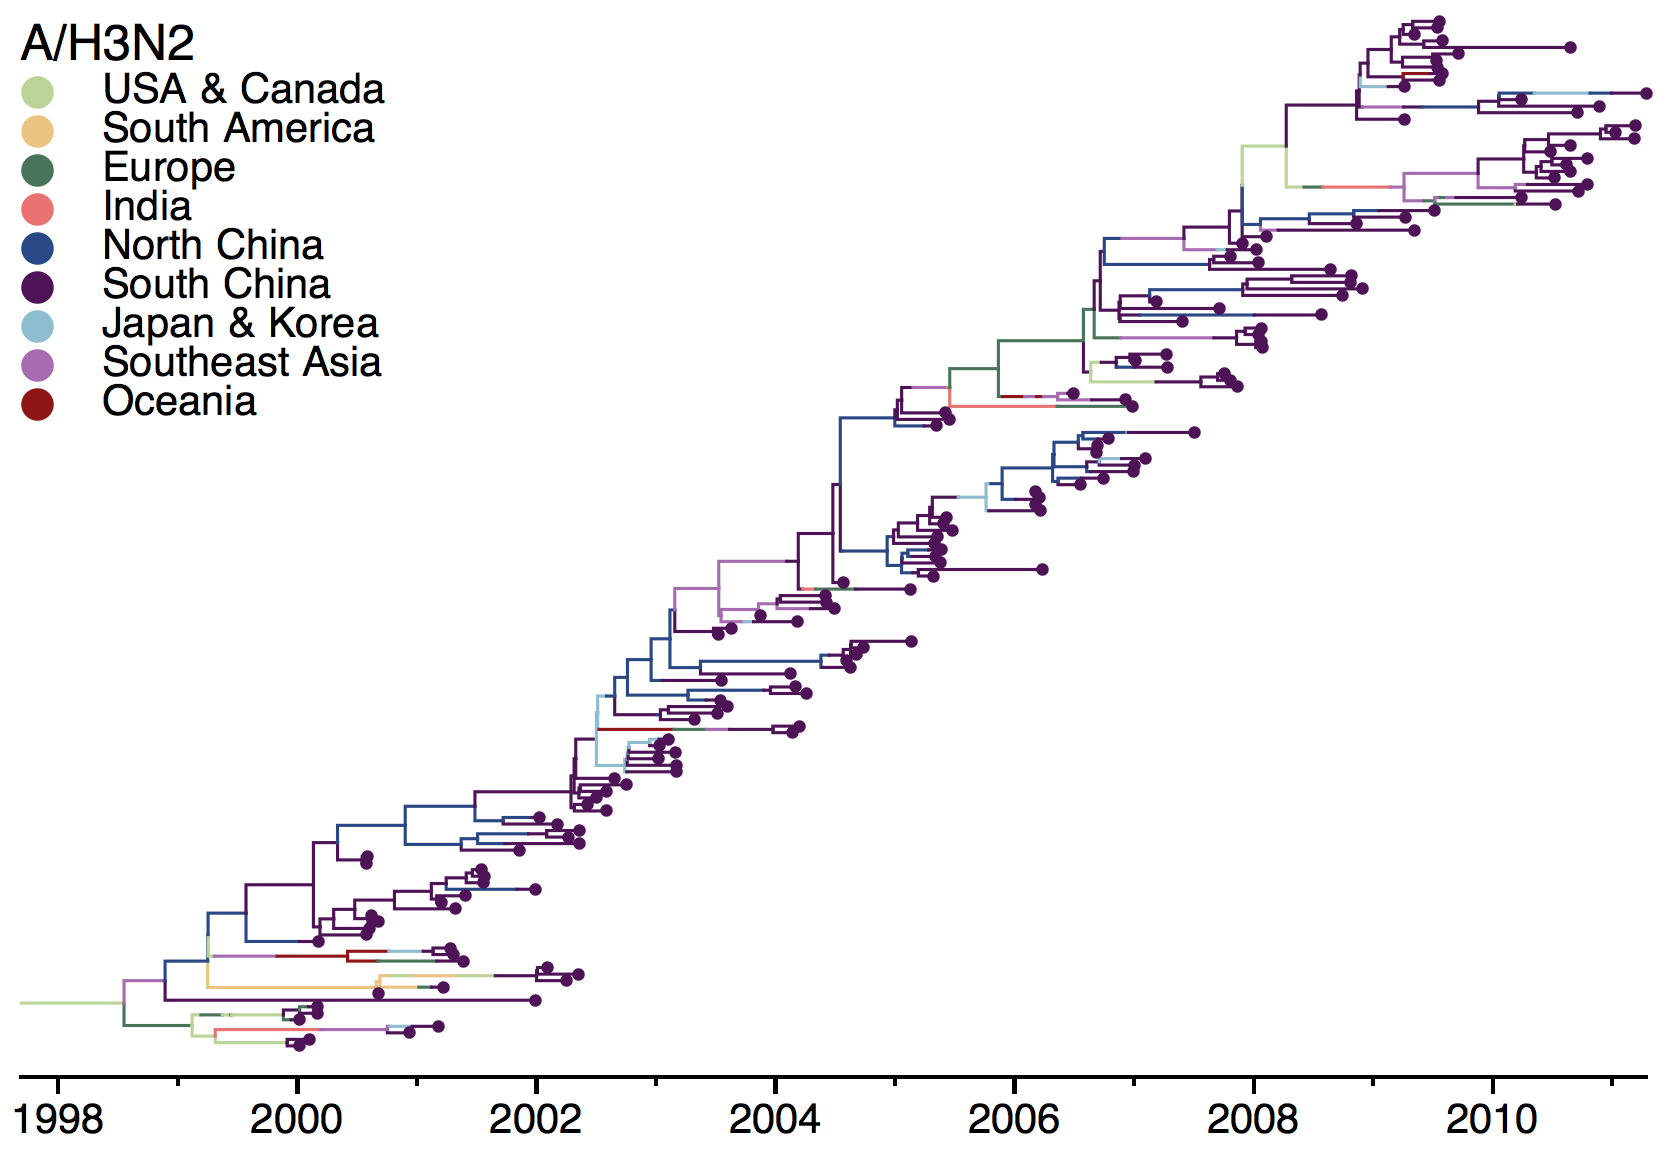
Viruses trace their origins primary to China, India and Southeast Asia
If data is looked at in the right way, answers become immediately clear
Edward Tufte
Above all, show the data
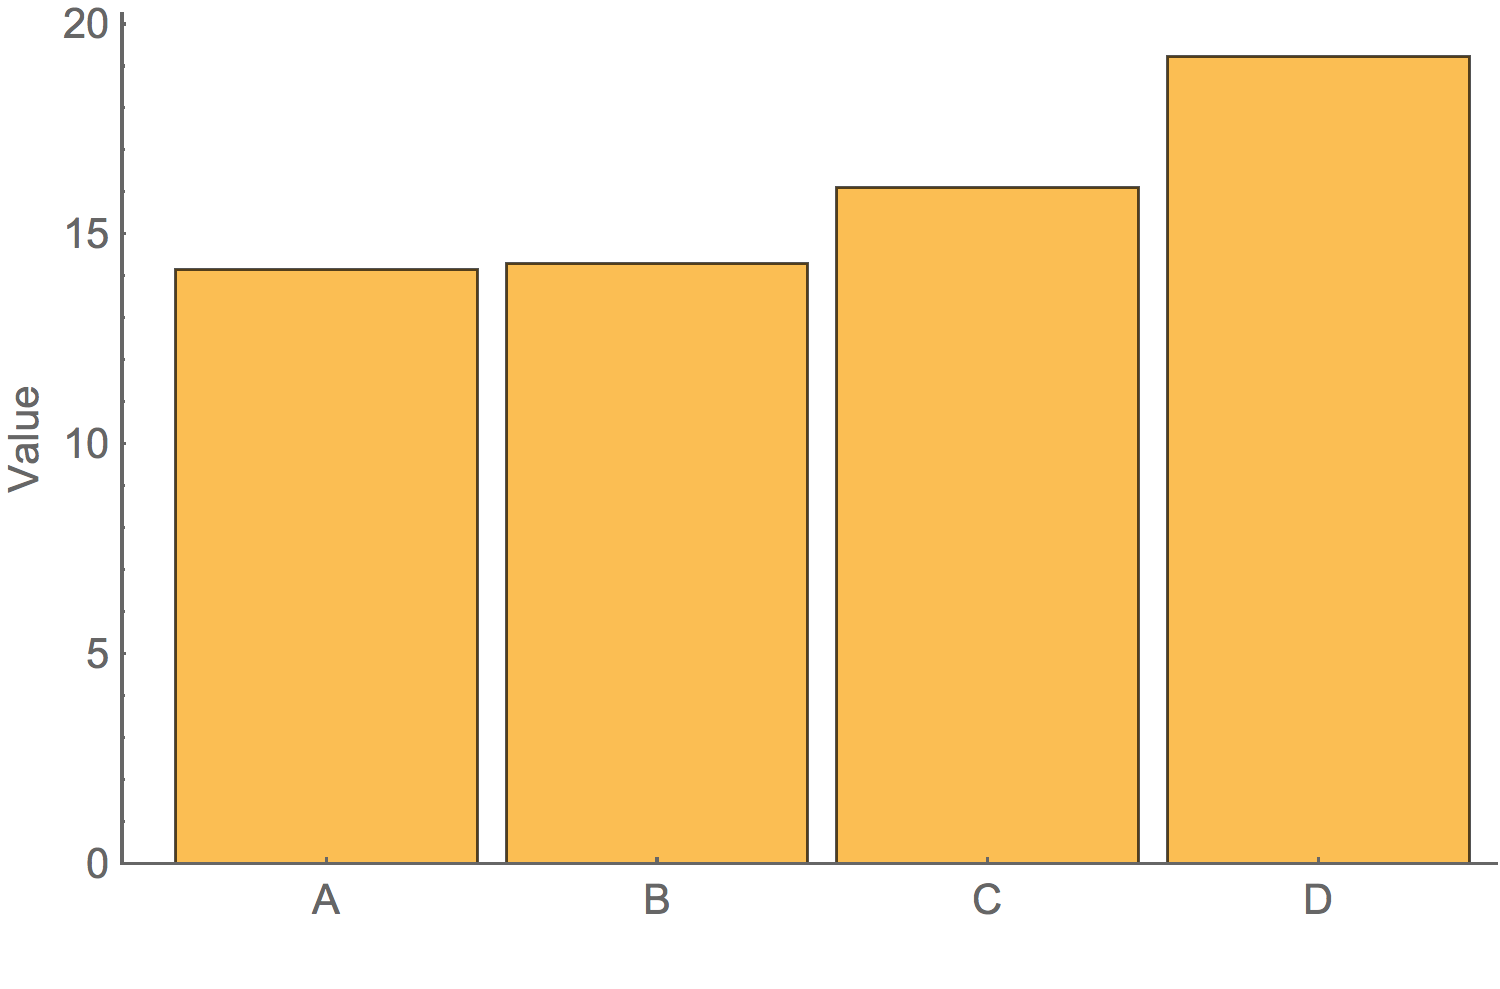
A good graphic is honestBarchart of average value
Box-and-whisker plot showing variation
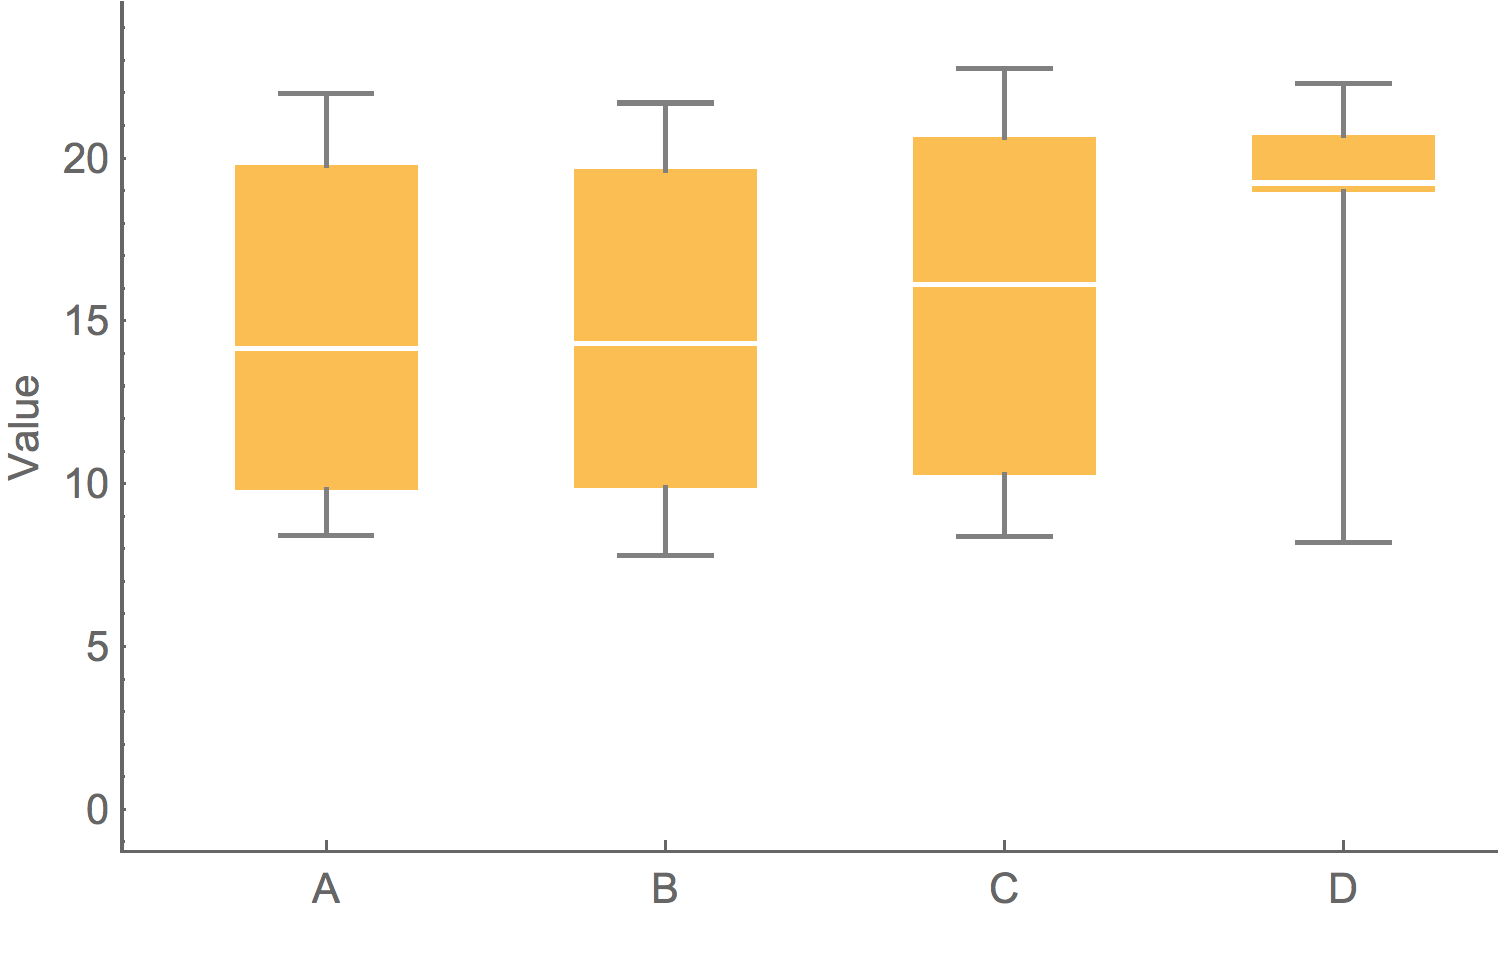
Showing the data
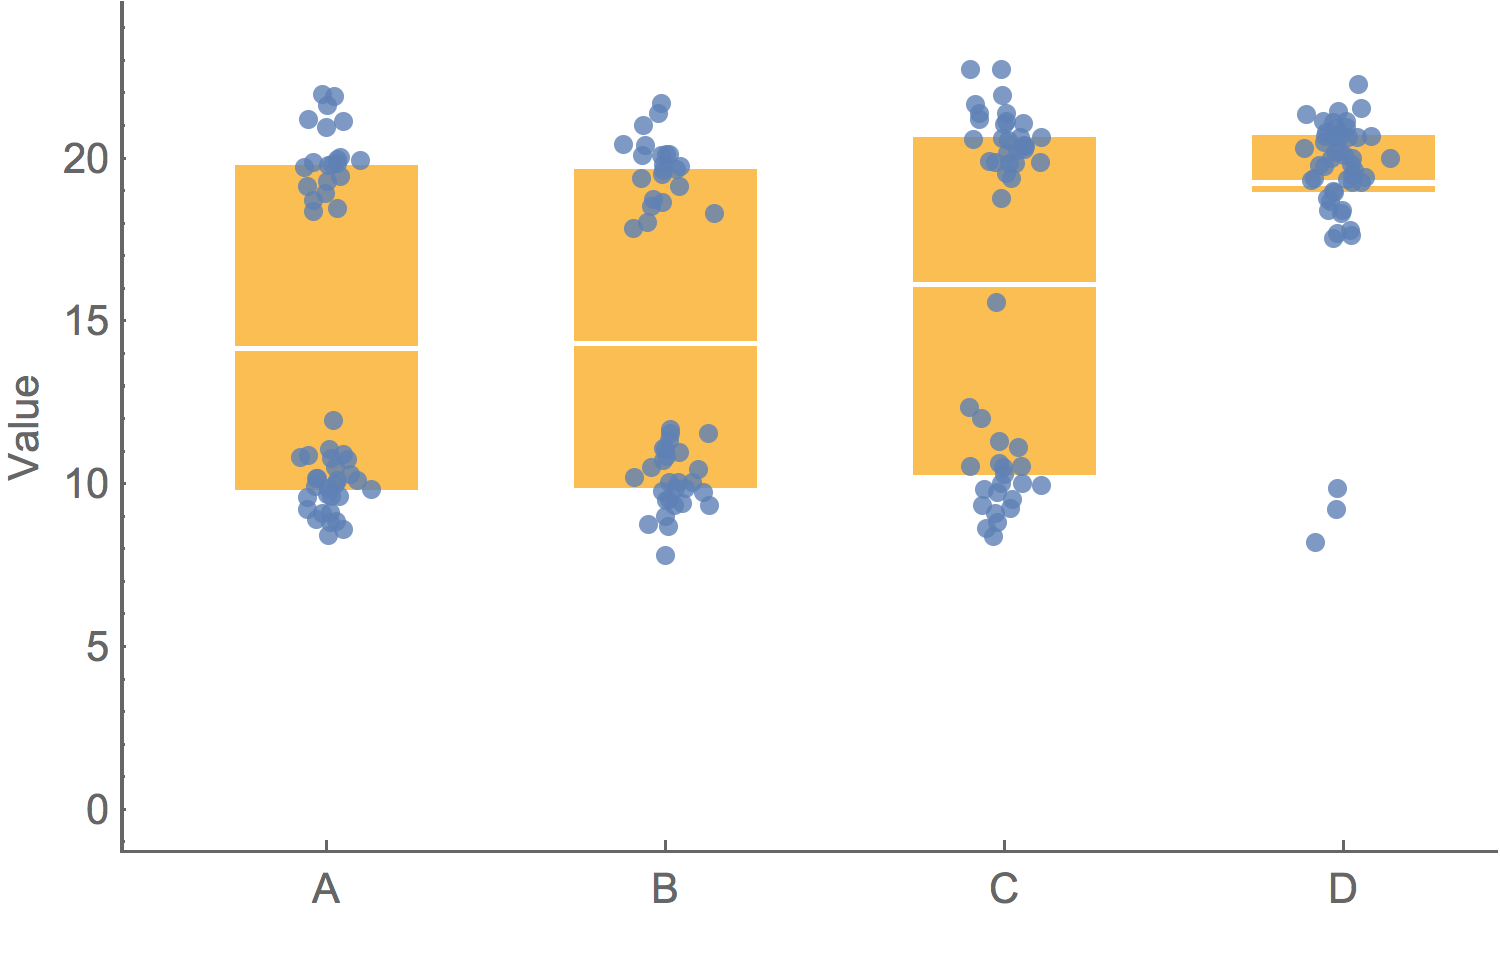
To clarify add detail
"To clarify, add detail... Clutter and overload are not attributes of information, they are failures of design. If the information is in chaos, don’t start throwing out information, instead fix the design."– Tufte
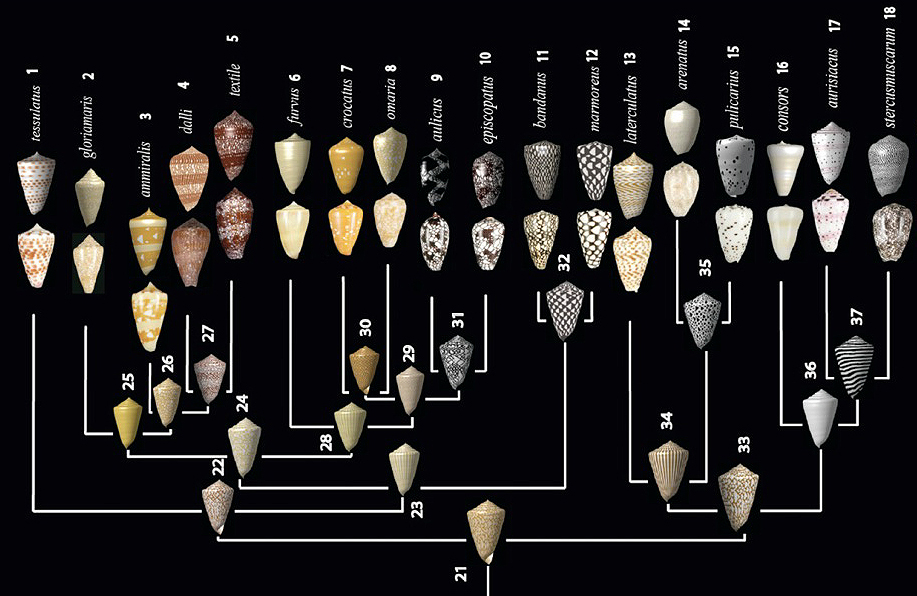
Evolution of Conus shells
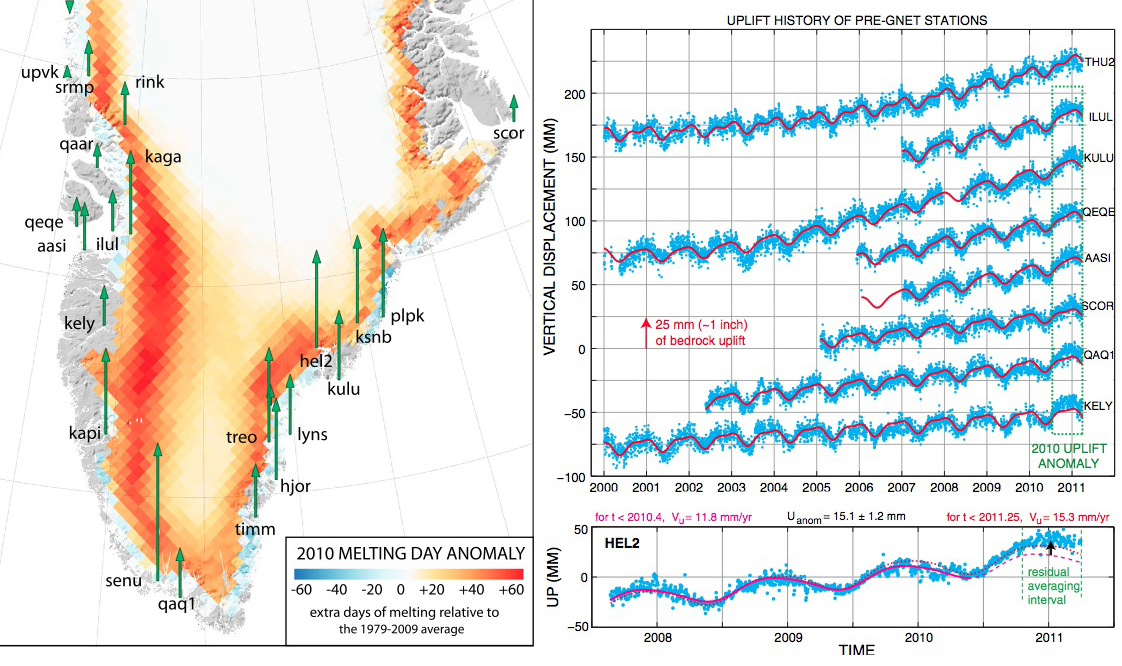
Greenland rising
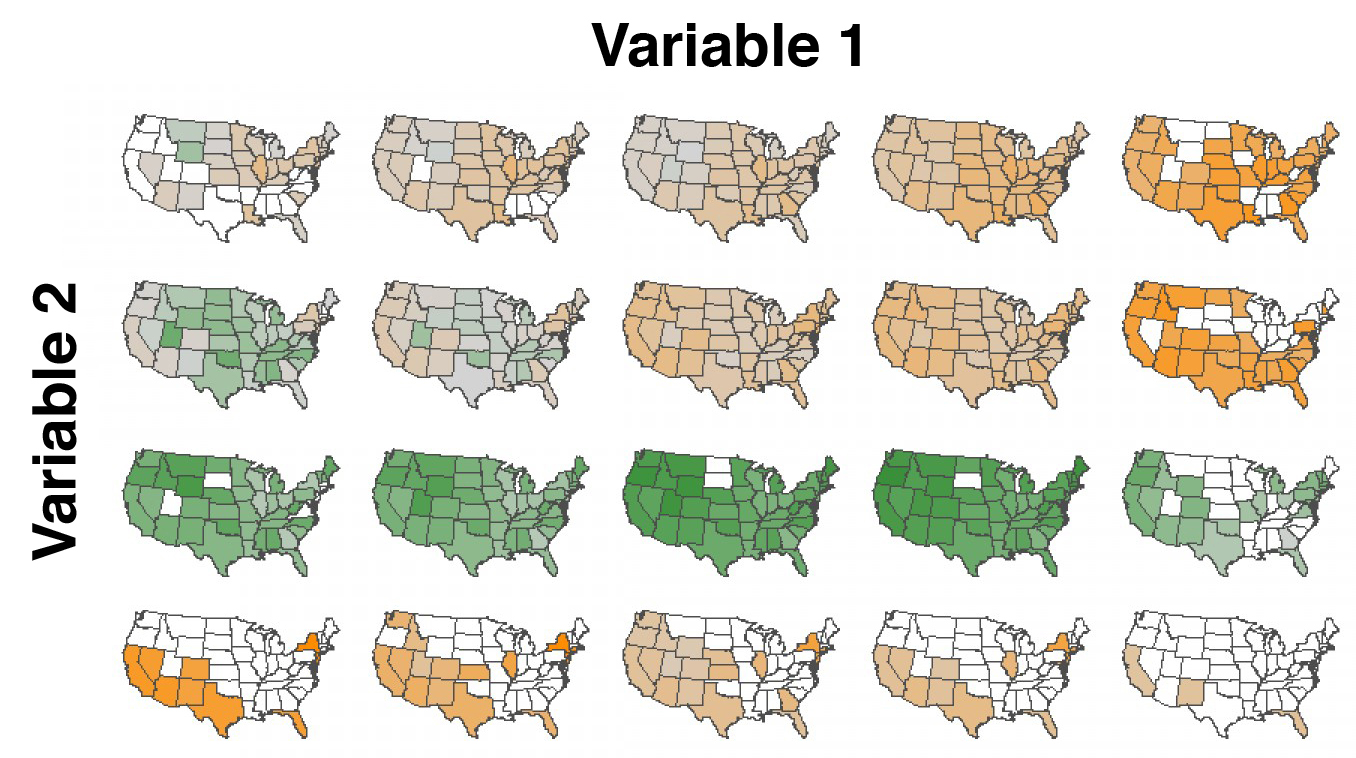
Small multiples and dimensionality
Mapping infection spread
John Snow and the founding of epidemiologyGlobal pandemic spread
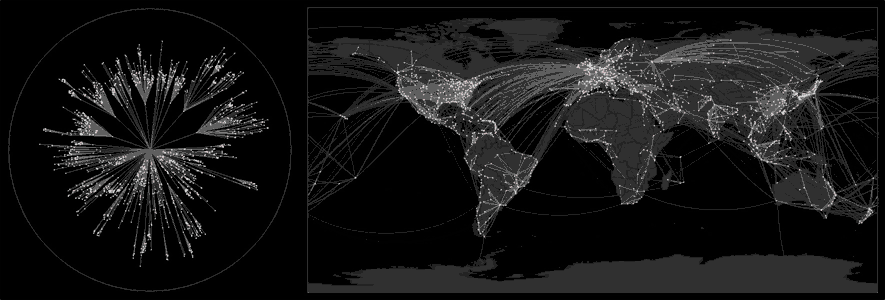
Geographic distance does not describe pandemic spread
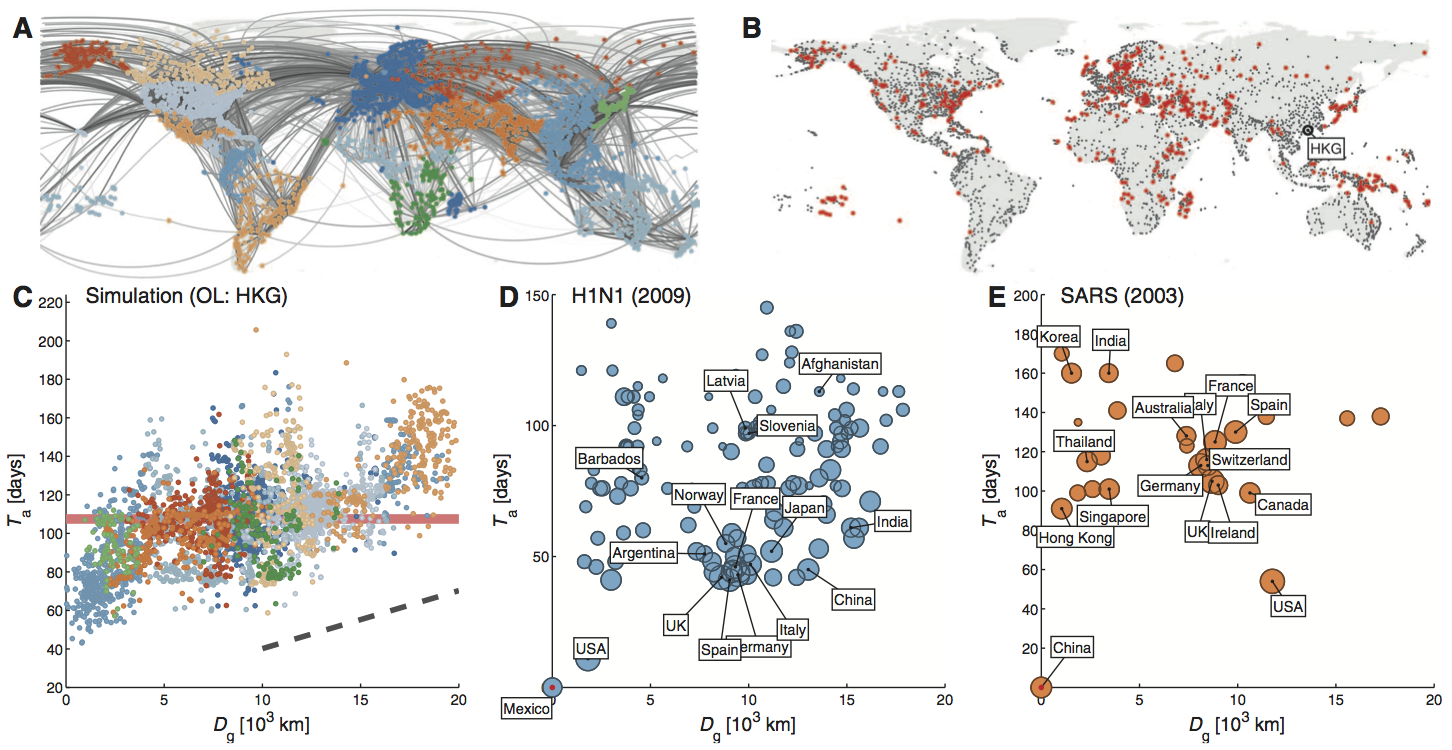
Shortest network path captures pandemic spread
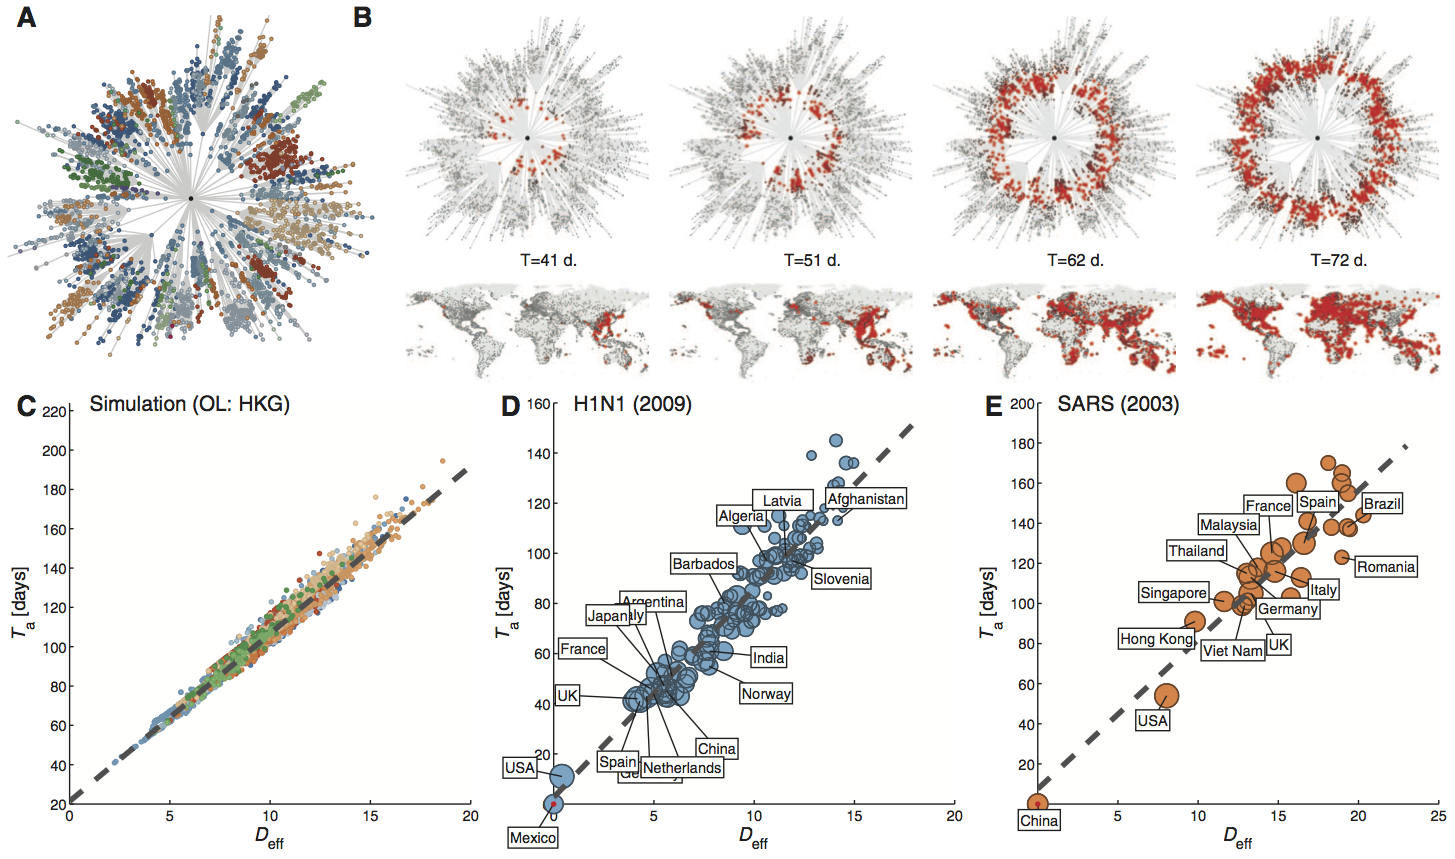
Predict almost exactly when zombie invasion will arrive
(except zombies don't get on planes. Nvm...)
Animating evolution of trees
Animating evolution of haplotypes