Phylodynamics introduction
Trevor Bedford (@trvrb)
May 26, 2020
GS541 Introduction to Computational Molecular Biology
SARS-CoV-2
Significant fog of war. Genomic approaches offer orthogonal data source to understand the pandemic.
Epidemic process
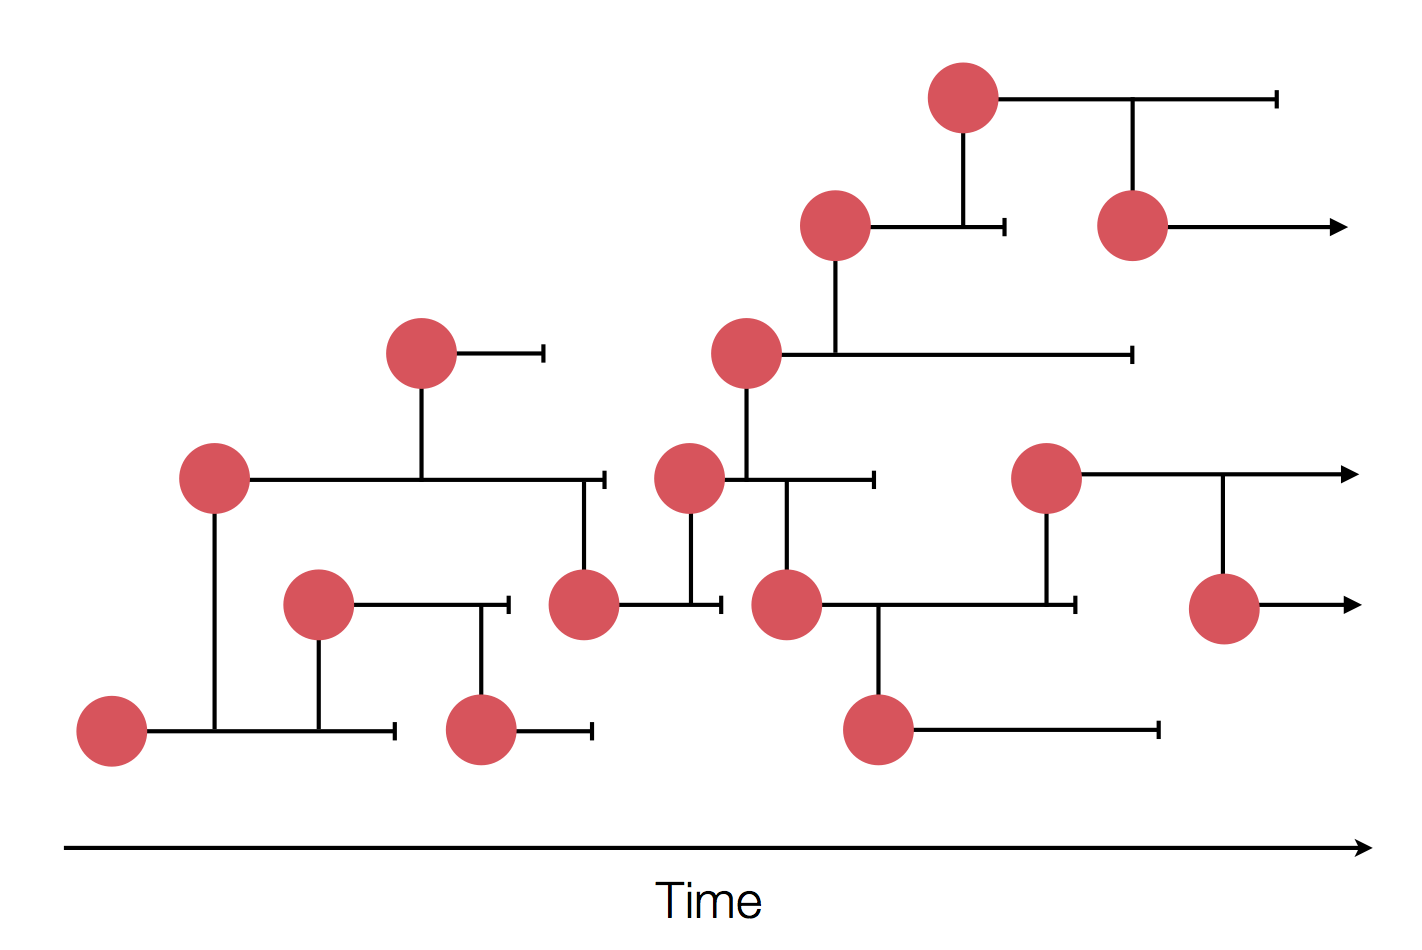
Sample some individuals
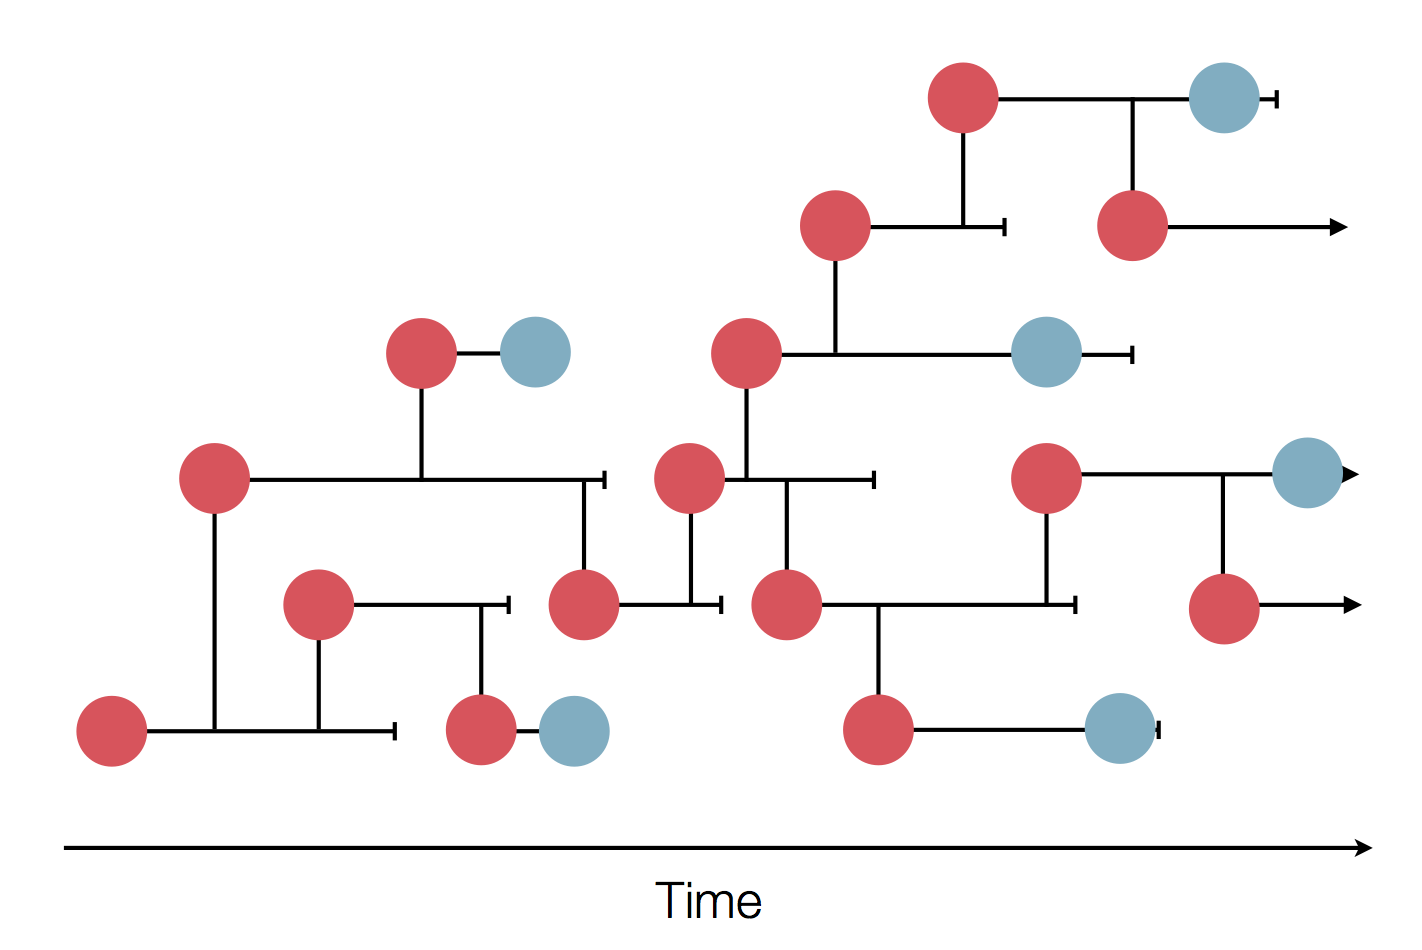
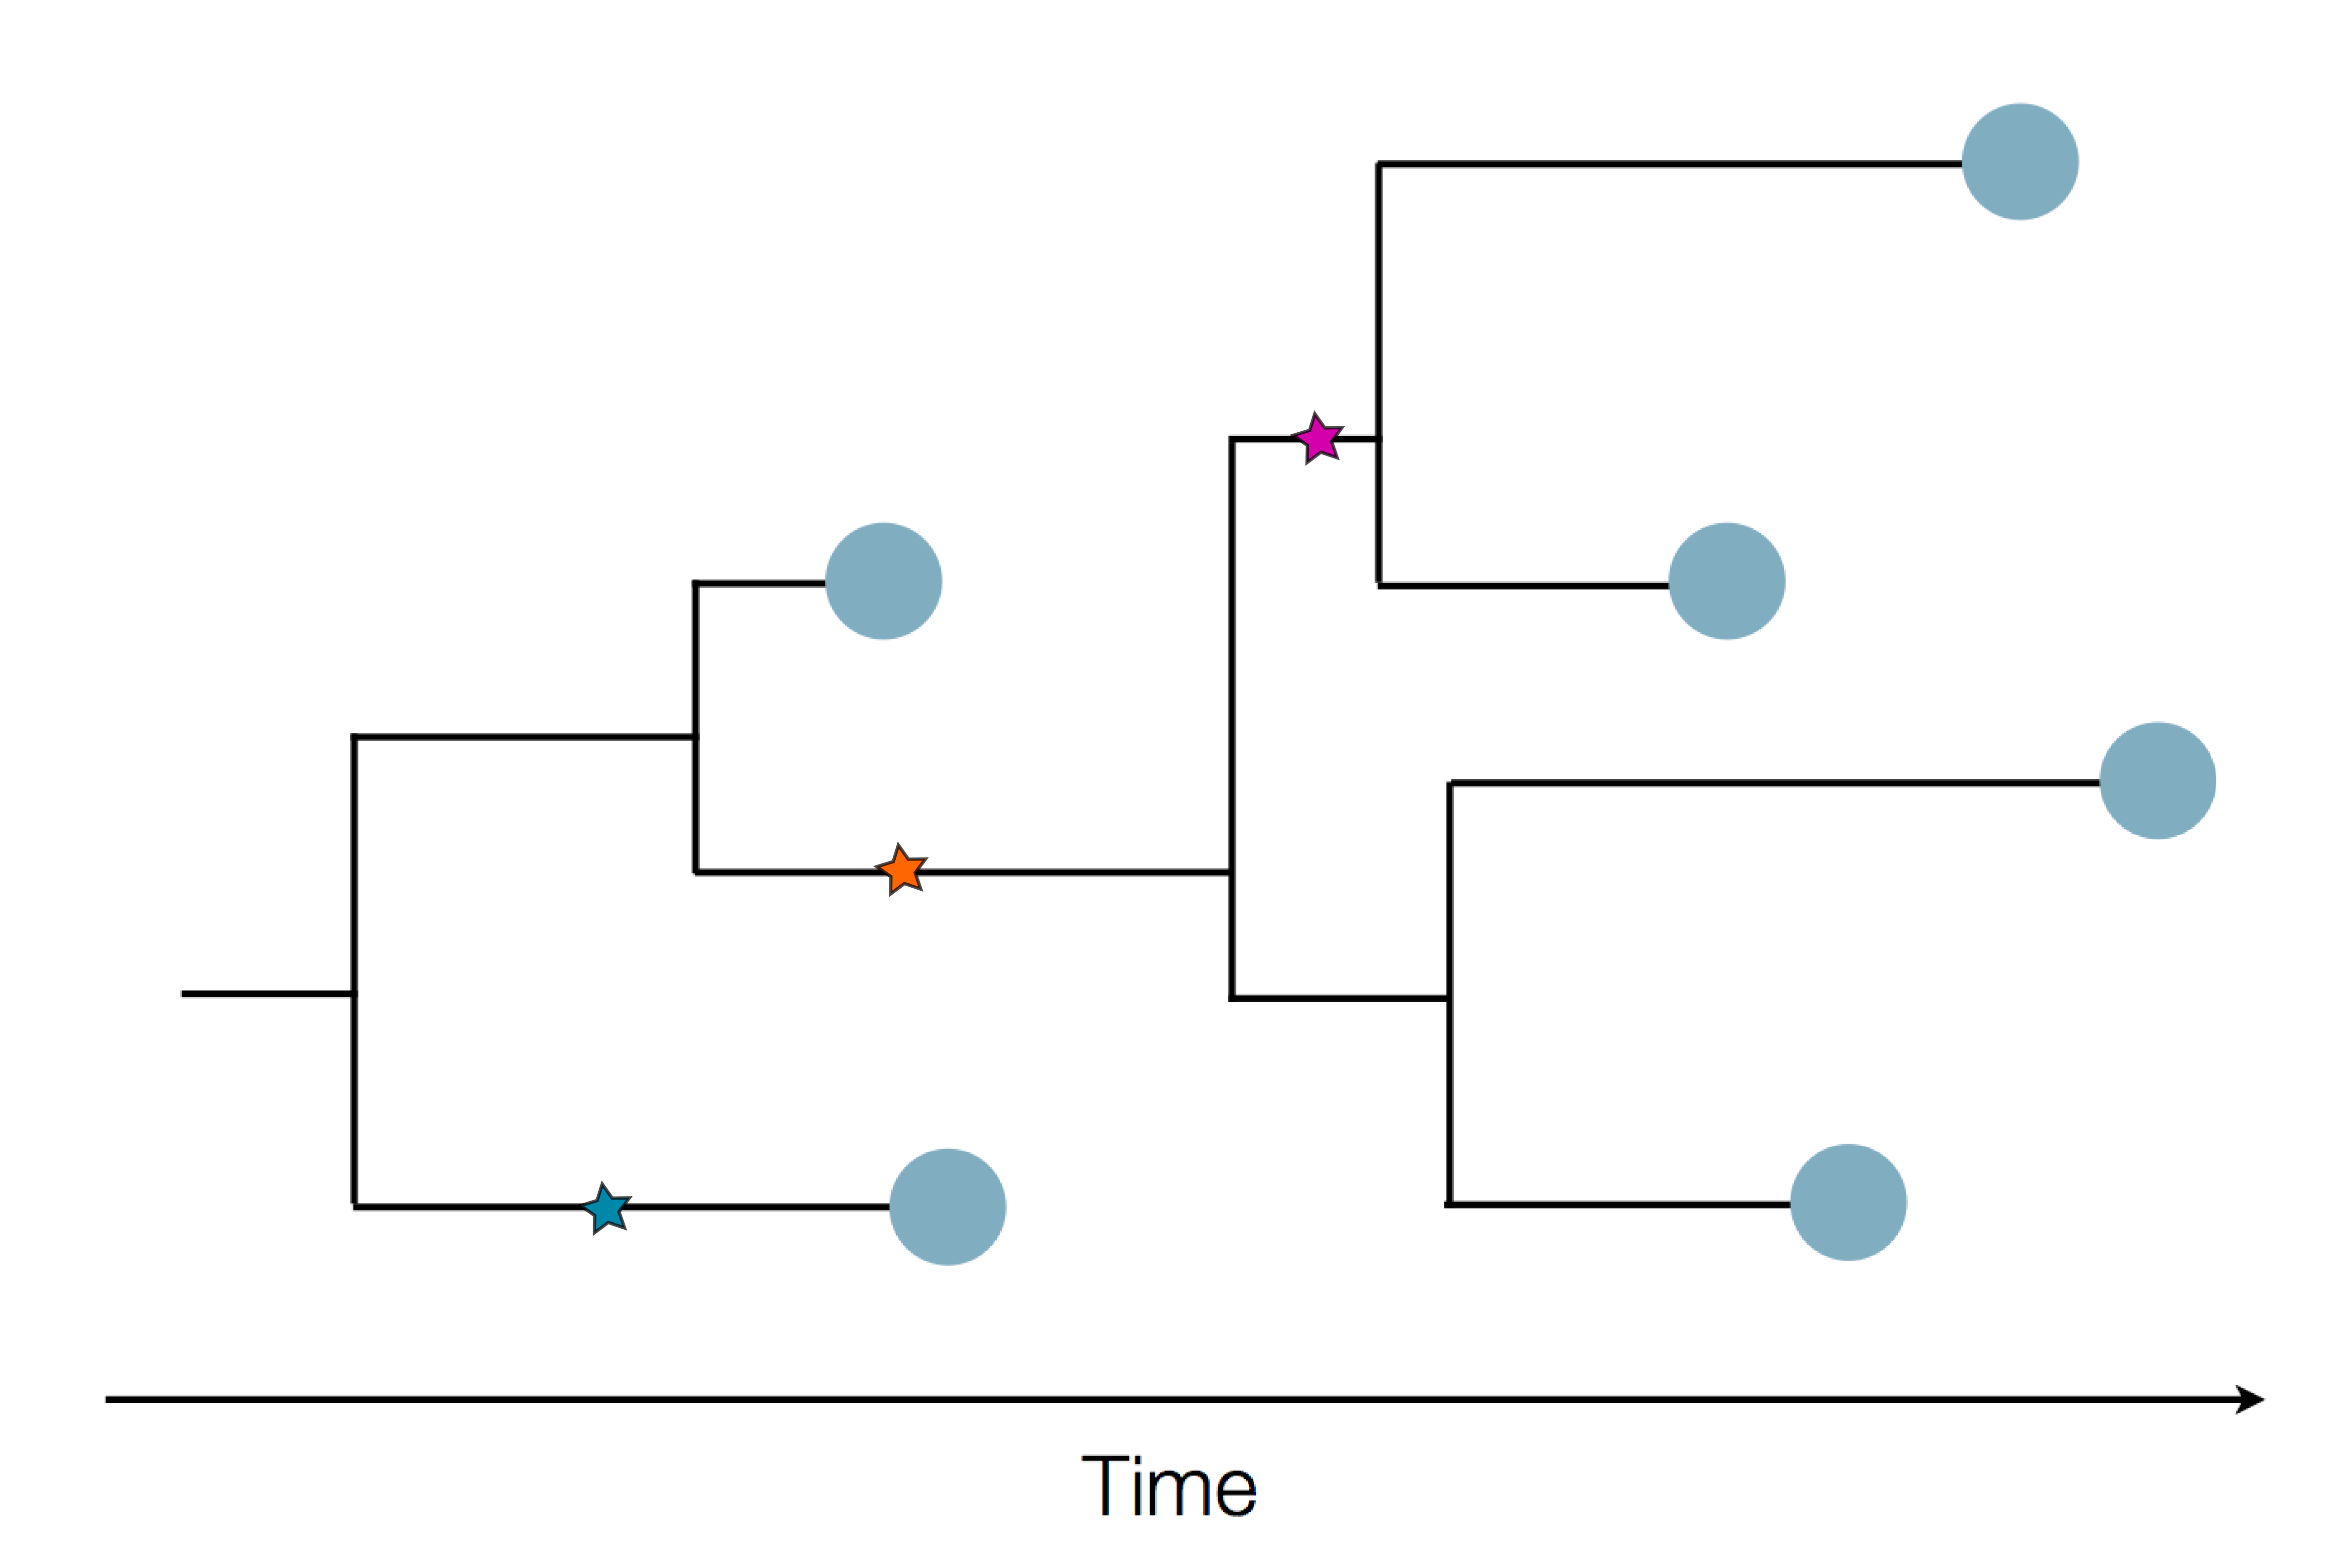
Sequence and determine phylogeny
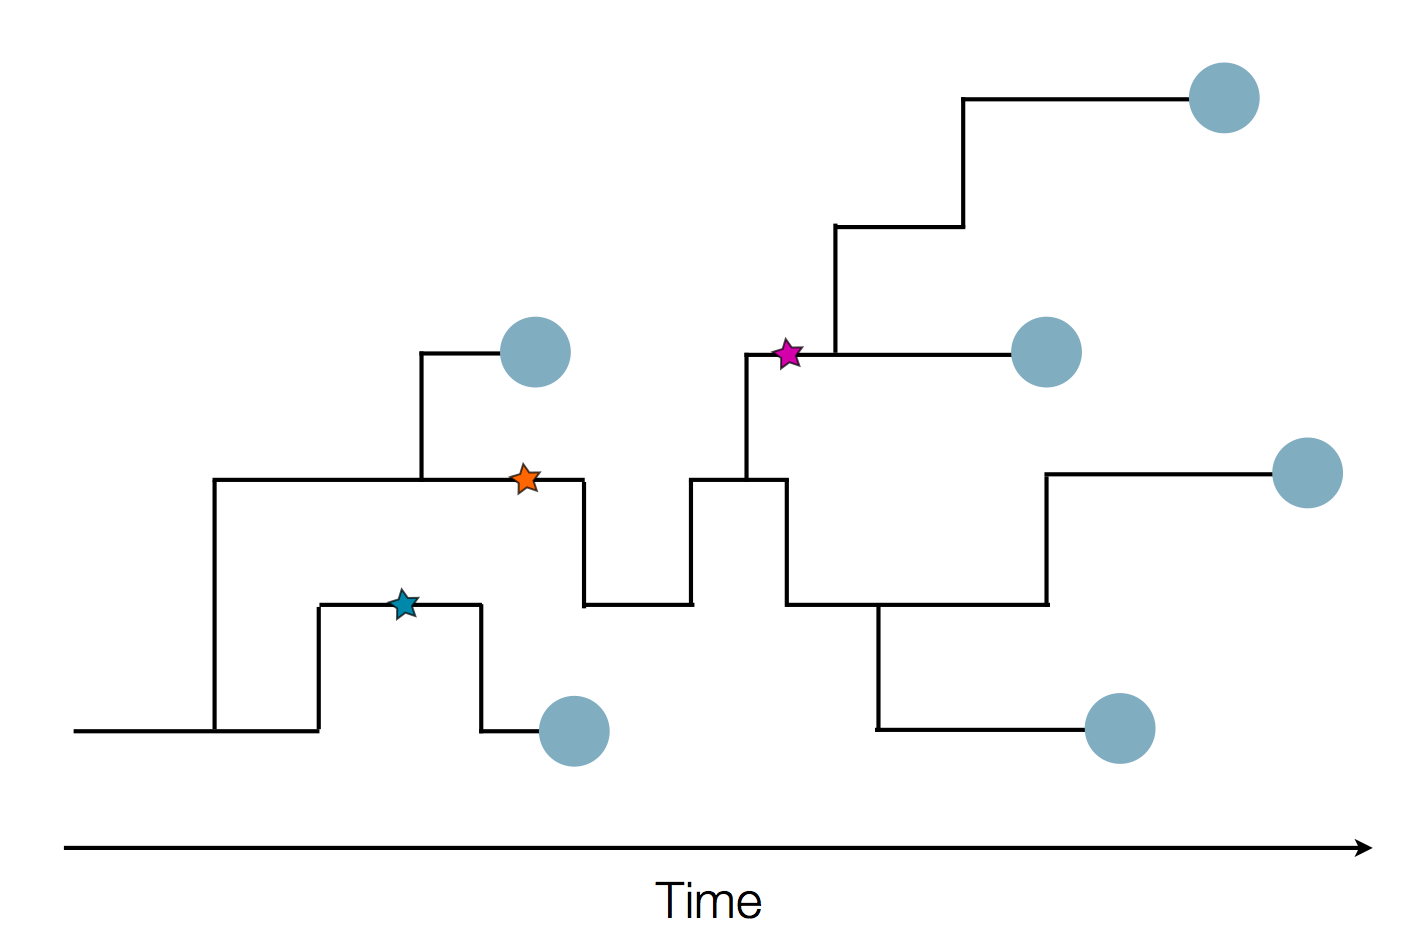
Sequence and determine phylogeny
Nextstrain
Project to conduct real-time molecular epidemiology and evolutionary analysis of emerging epidemics
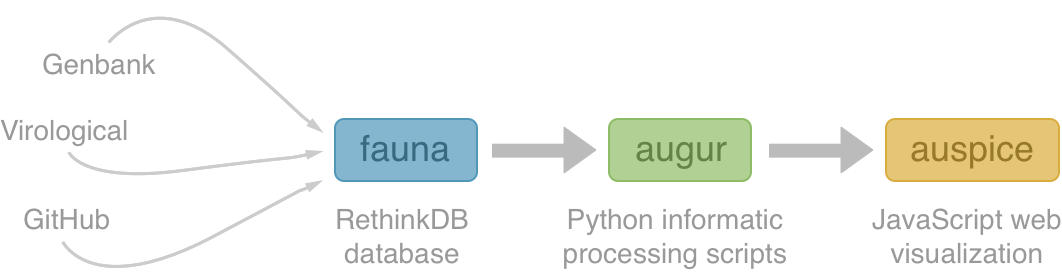
Nextstrain architecture
All code open source at github.com/nextstrain
Two central aims: (1) rapid and flexible phylodynamic analysis and
(2) interactive visualization
Rapid build pipeline for 3000 SARS-CoV-2 genomes (timings are for a laptop)
- Align with MAFFT (~20 min)
- Build ML tree with IQTREE (~40 min)
- Temporally resolve tree and geographic ancestry with TreeTime (~50 min)
- Total pipeline (~2 hr)
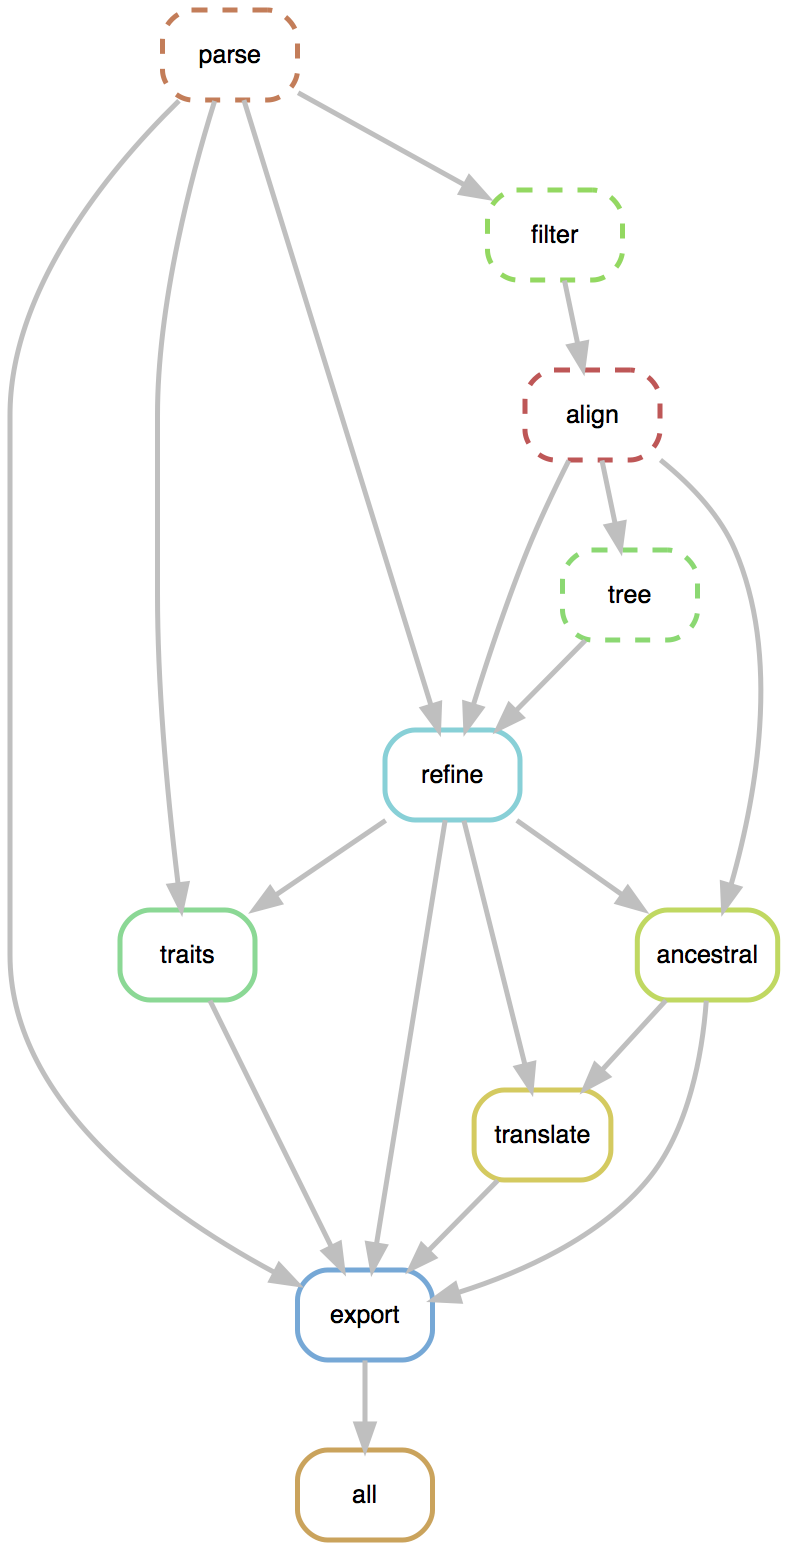
Flexible pipelines constructed through command line modules
- Modules called via
augur filter,augur tree,augur traits, etc... - Designed to be composable across pathogen builds
- Defined pipeline, making steps obvious
- Provides dependency graph for fast recomputation
- Pathogen-specific repos give users an obvious foundation to build from
- SARS-CoV-2 workflow here
Current data flow for SARS-CoV-2
- Labs contribute directly to GISAID (now have >17k full genomes)
- Nextstrain pulls a complete dataset from GISAID every 60 minutes
- This triggers an automatic rebuild on Amazon Web Services
- We manually update new lat/longs, etc...
- We push this build online to nextstrain.org and tweet the update from @nextstrain
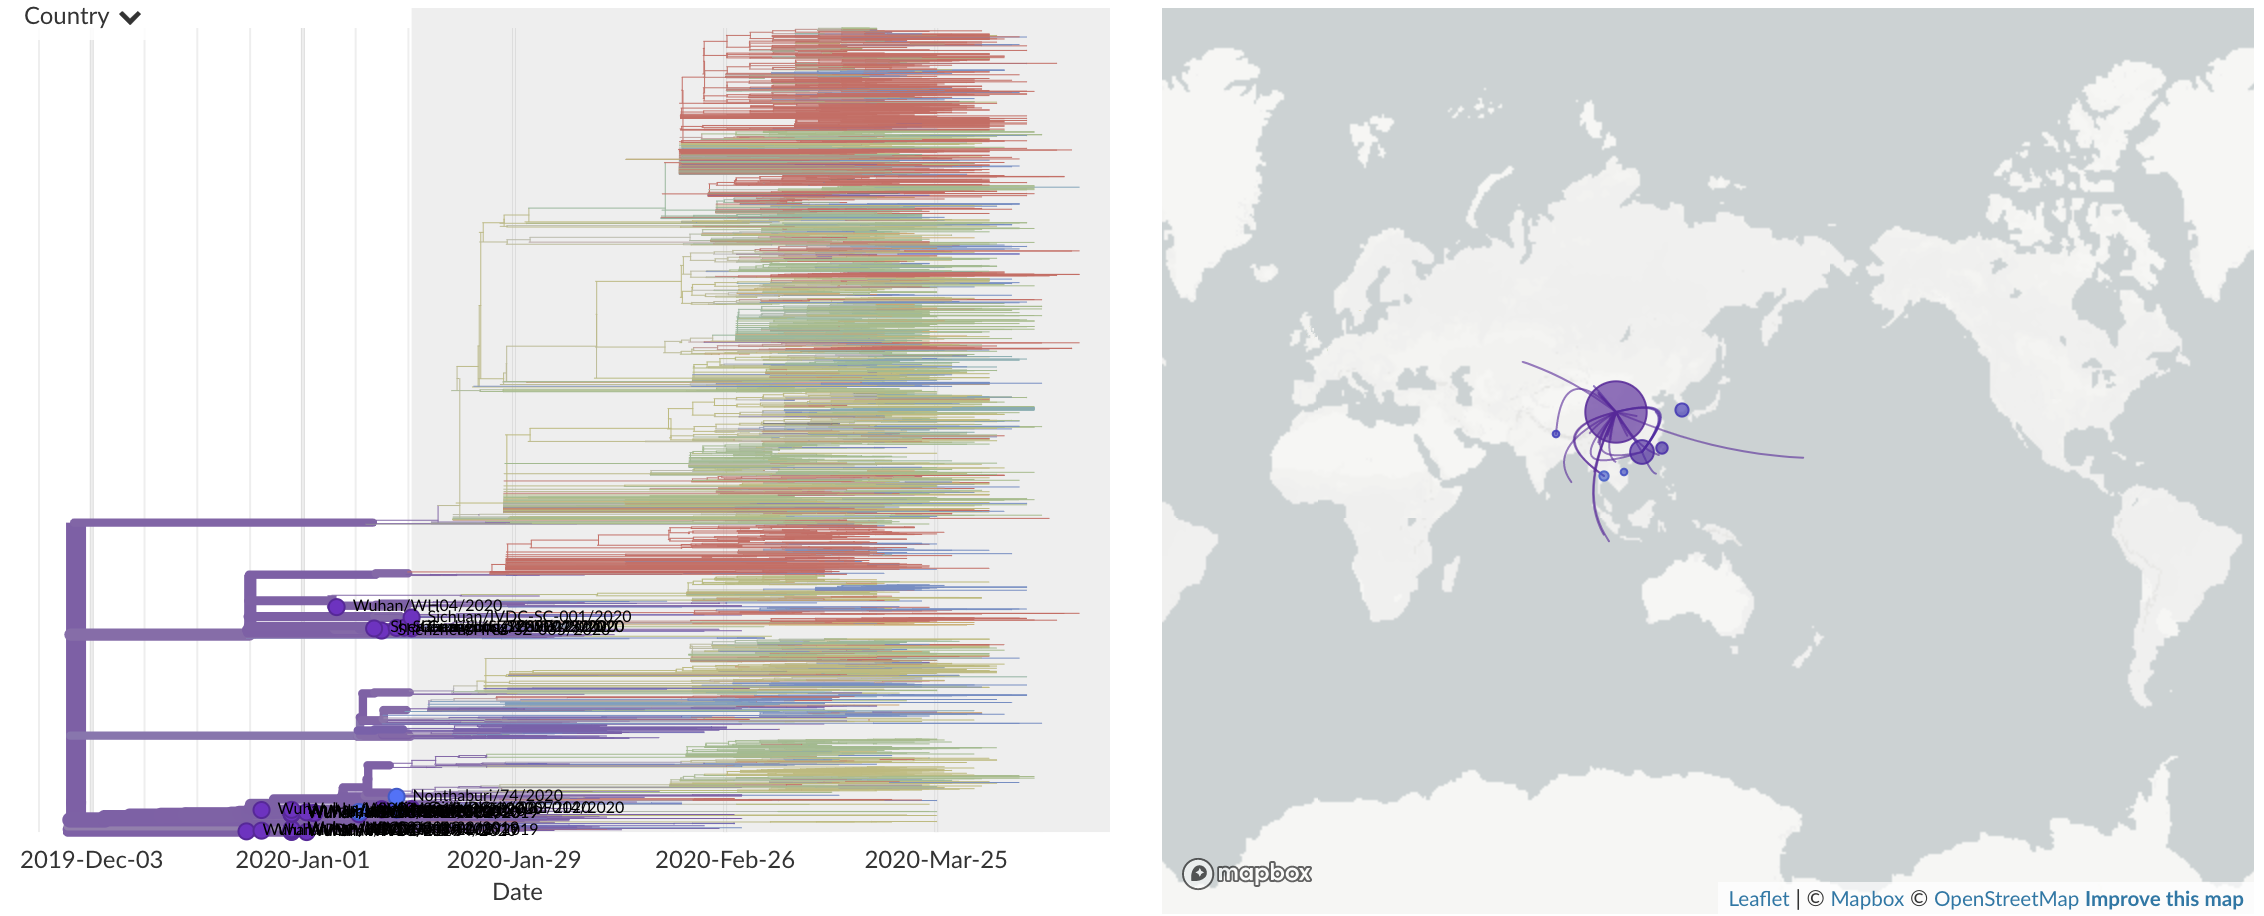
Dec/Jan: Emergence of SARS-CoV-2 from Wuhan in ~Nov 2019
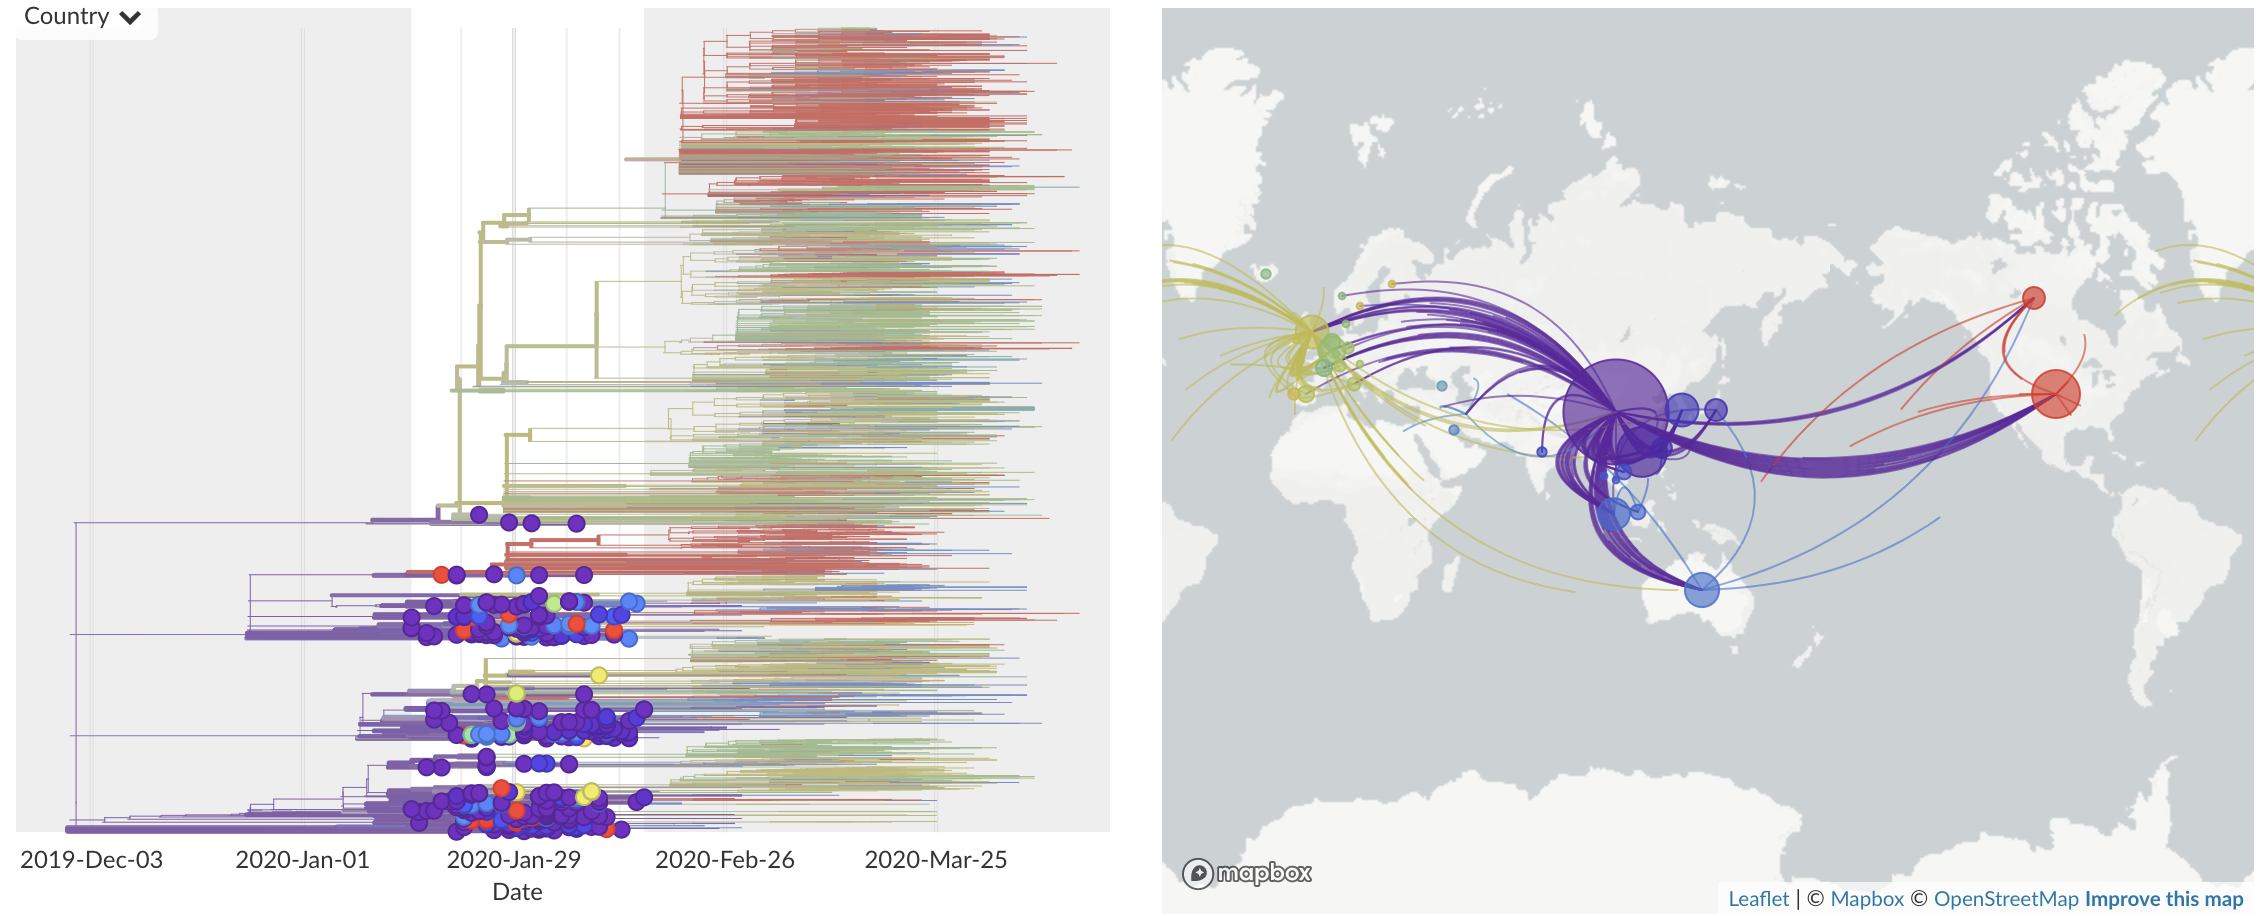
Jan/Feb: Spread within China and seeding elsewhere
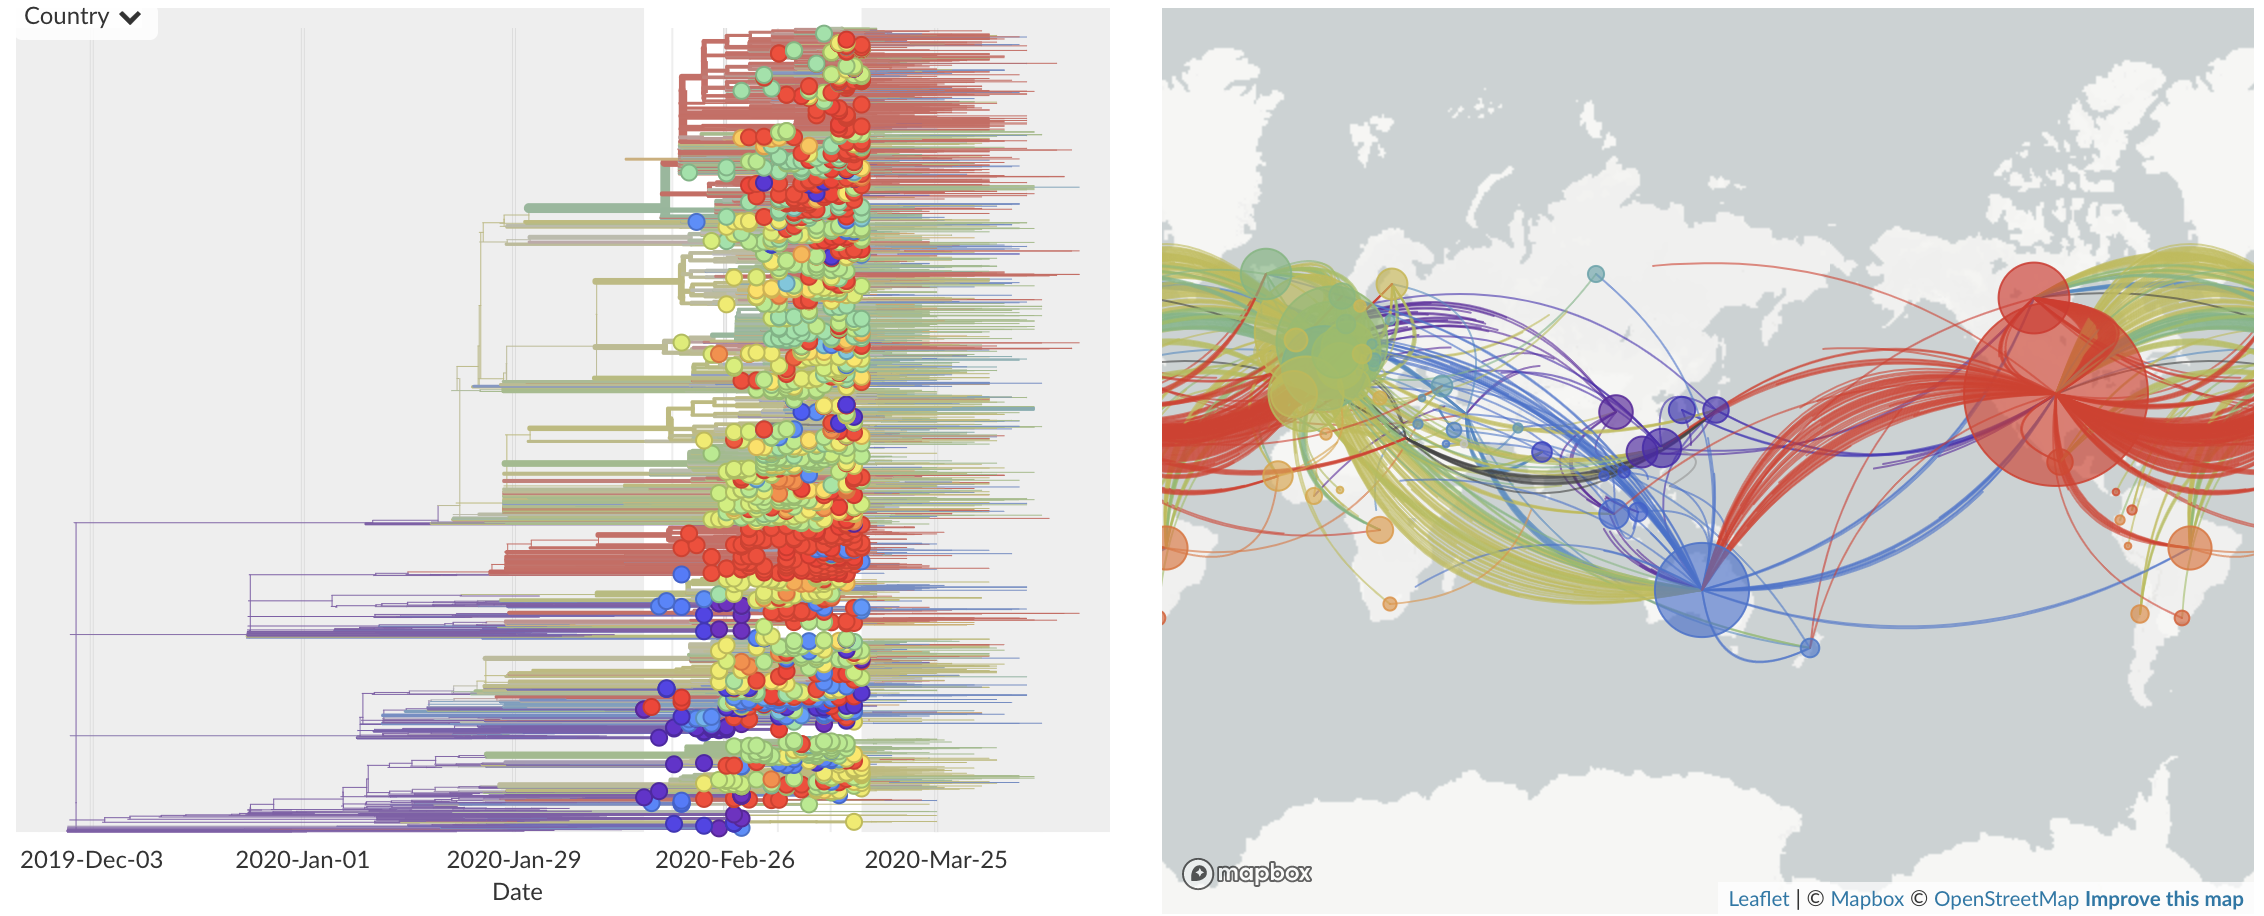
Feb/Mar: Epidemic spread within North America and Europe
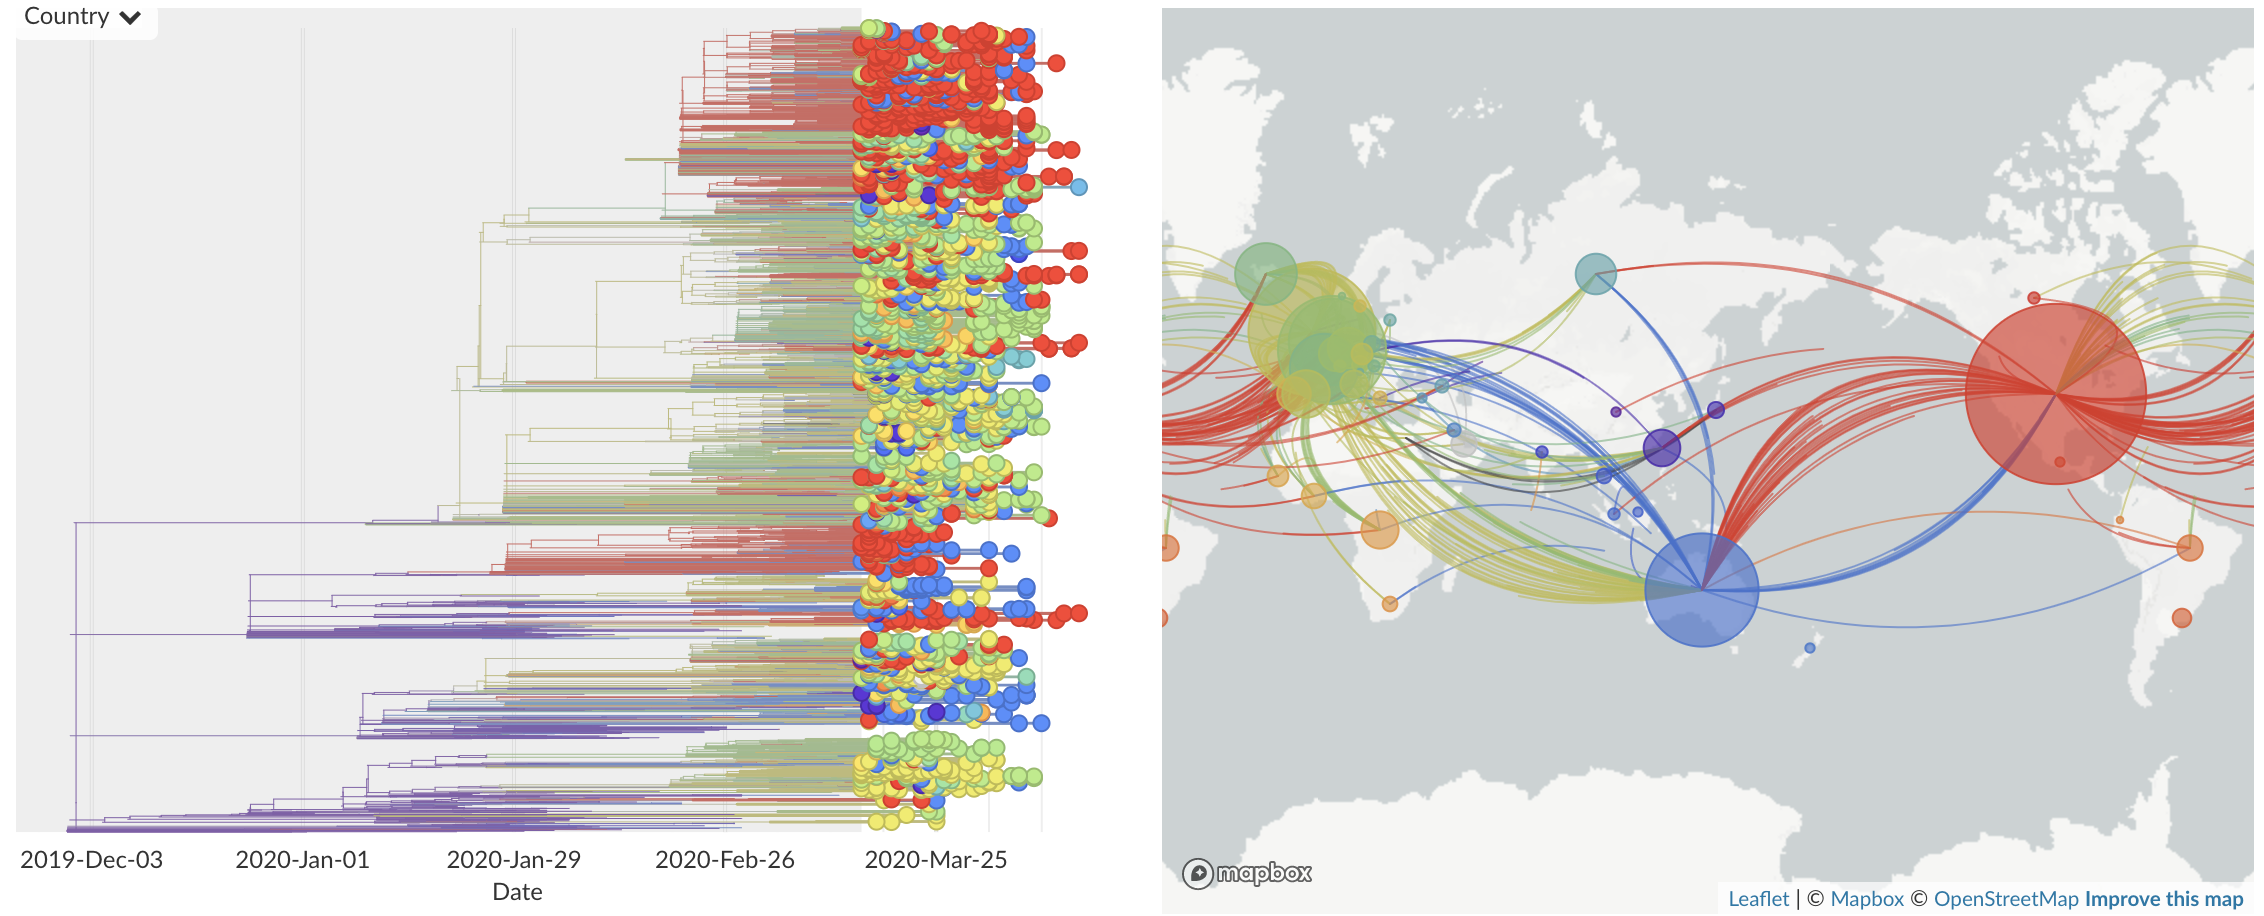
Mar/Apr: Continued growth, but decreasing transmission with social distancing measures
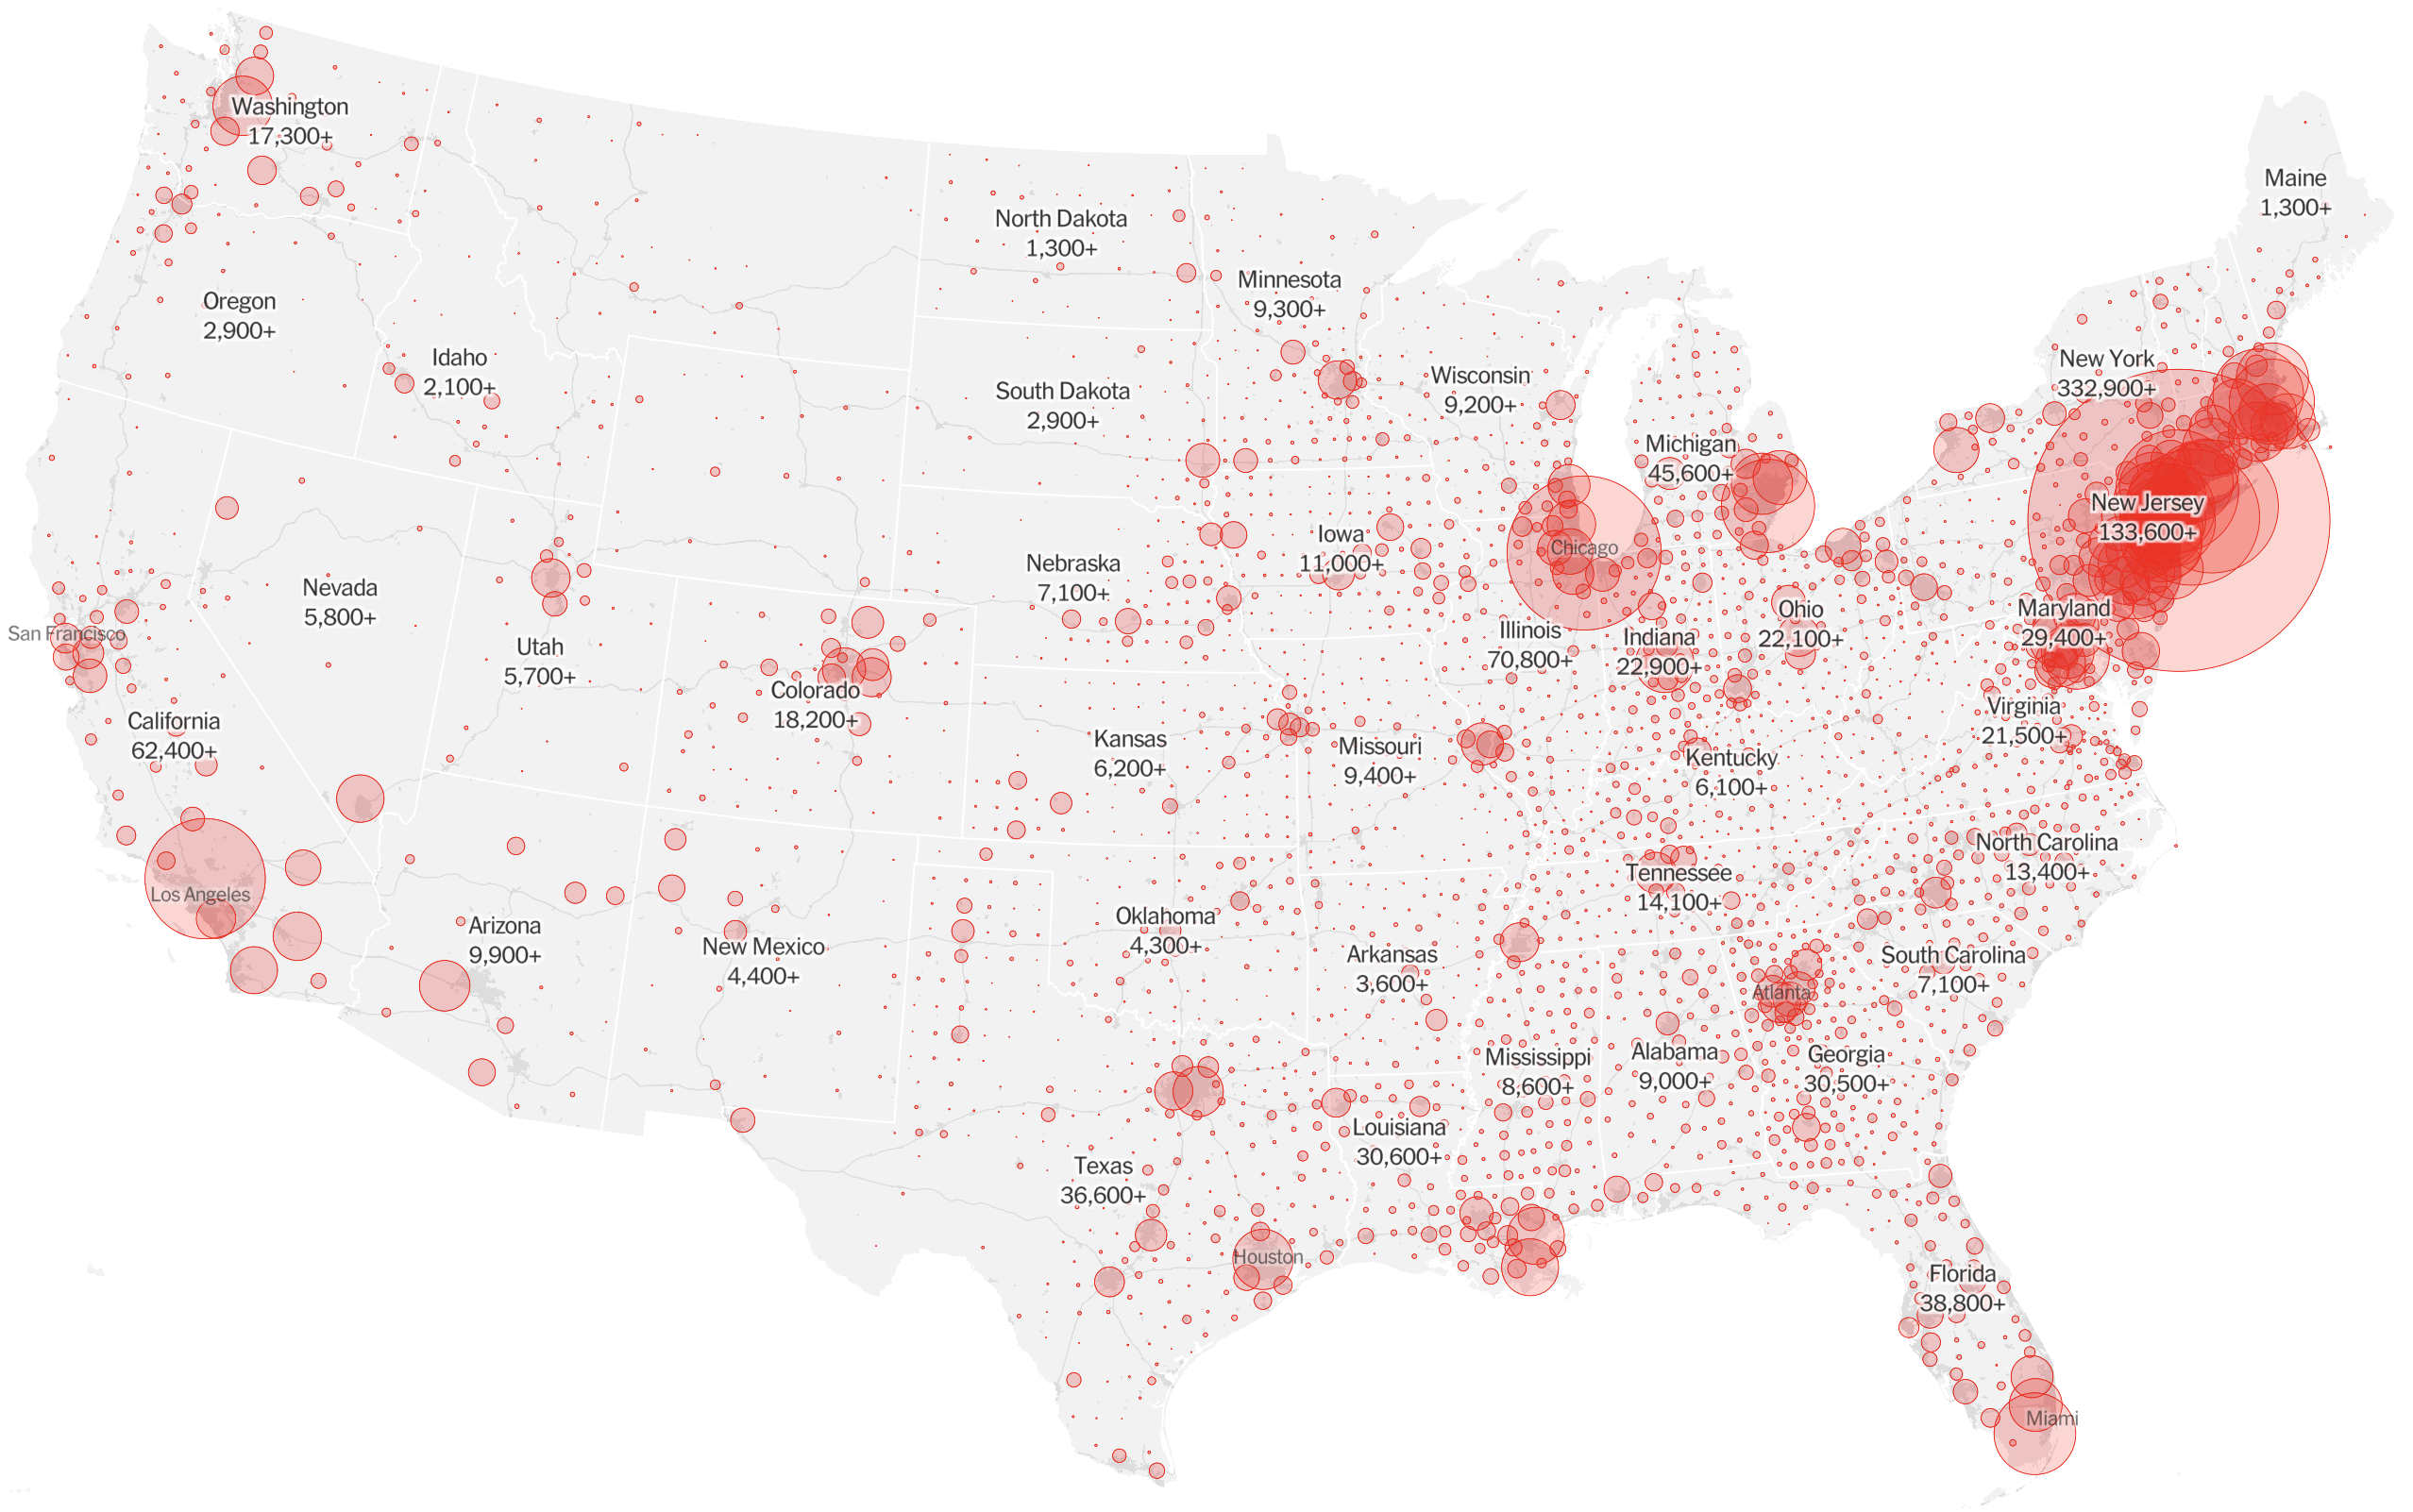
Epidemic in the USA was introduced from China in late Jan and from Europe during Feb
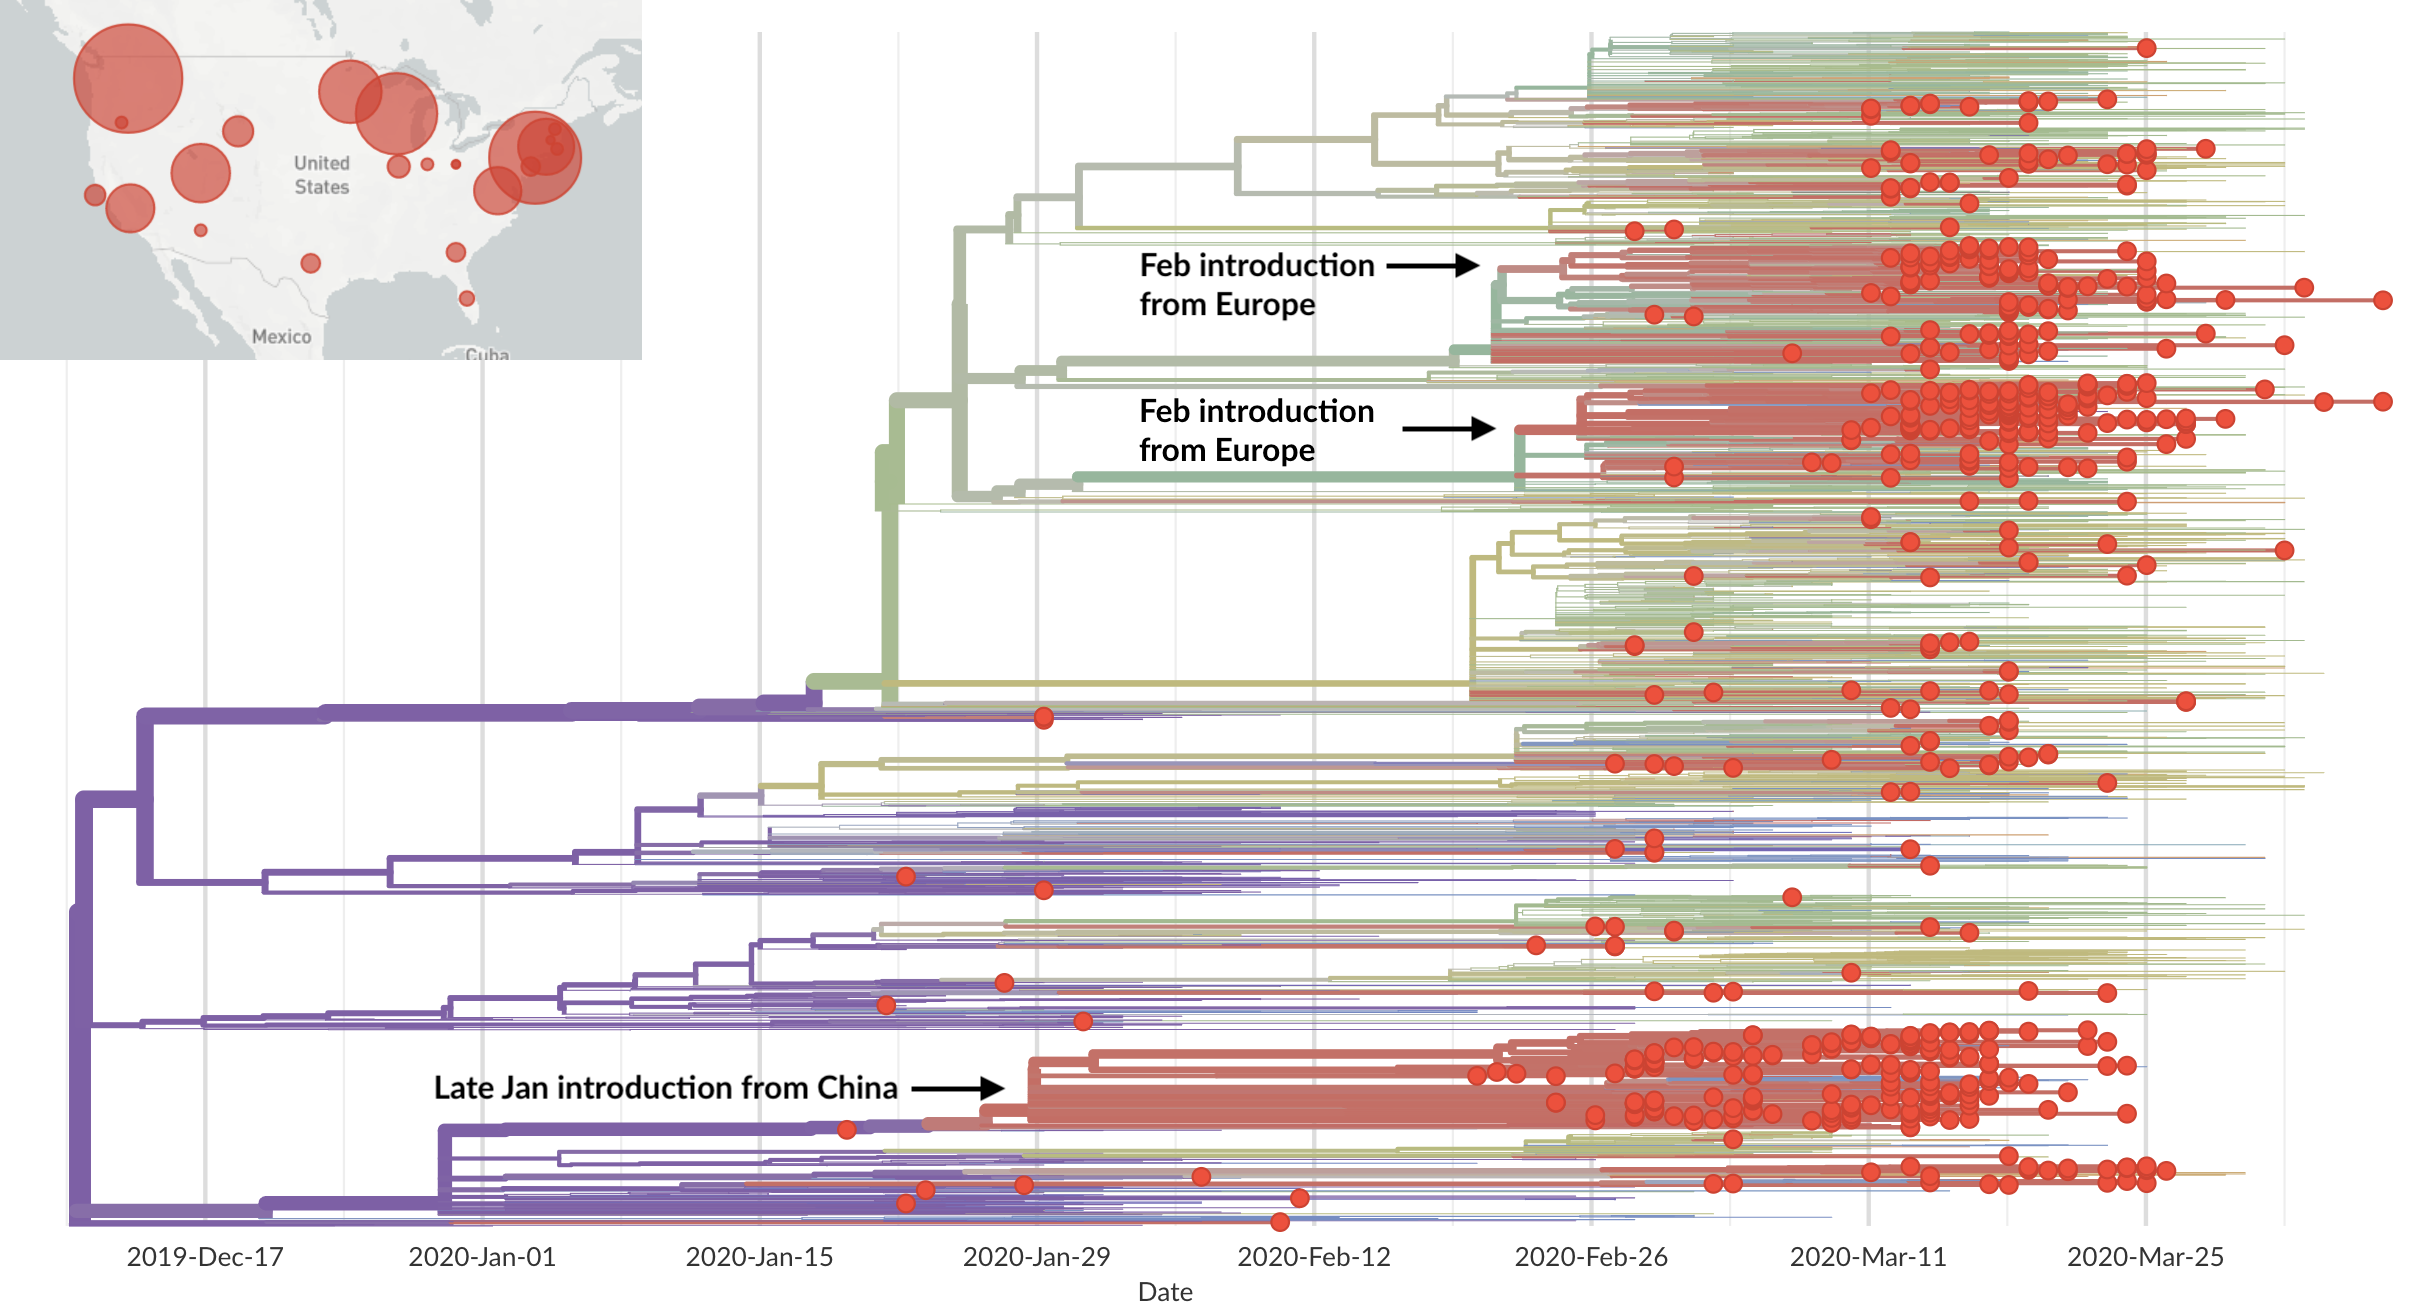
Once in the US, virus spread rapidly
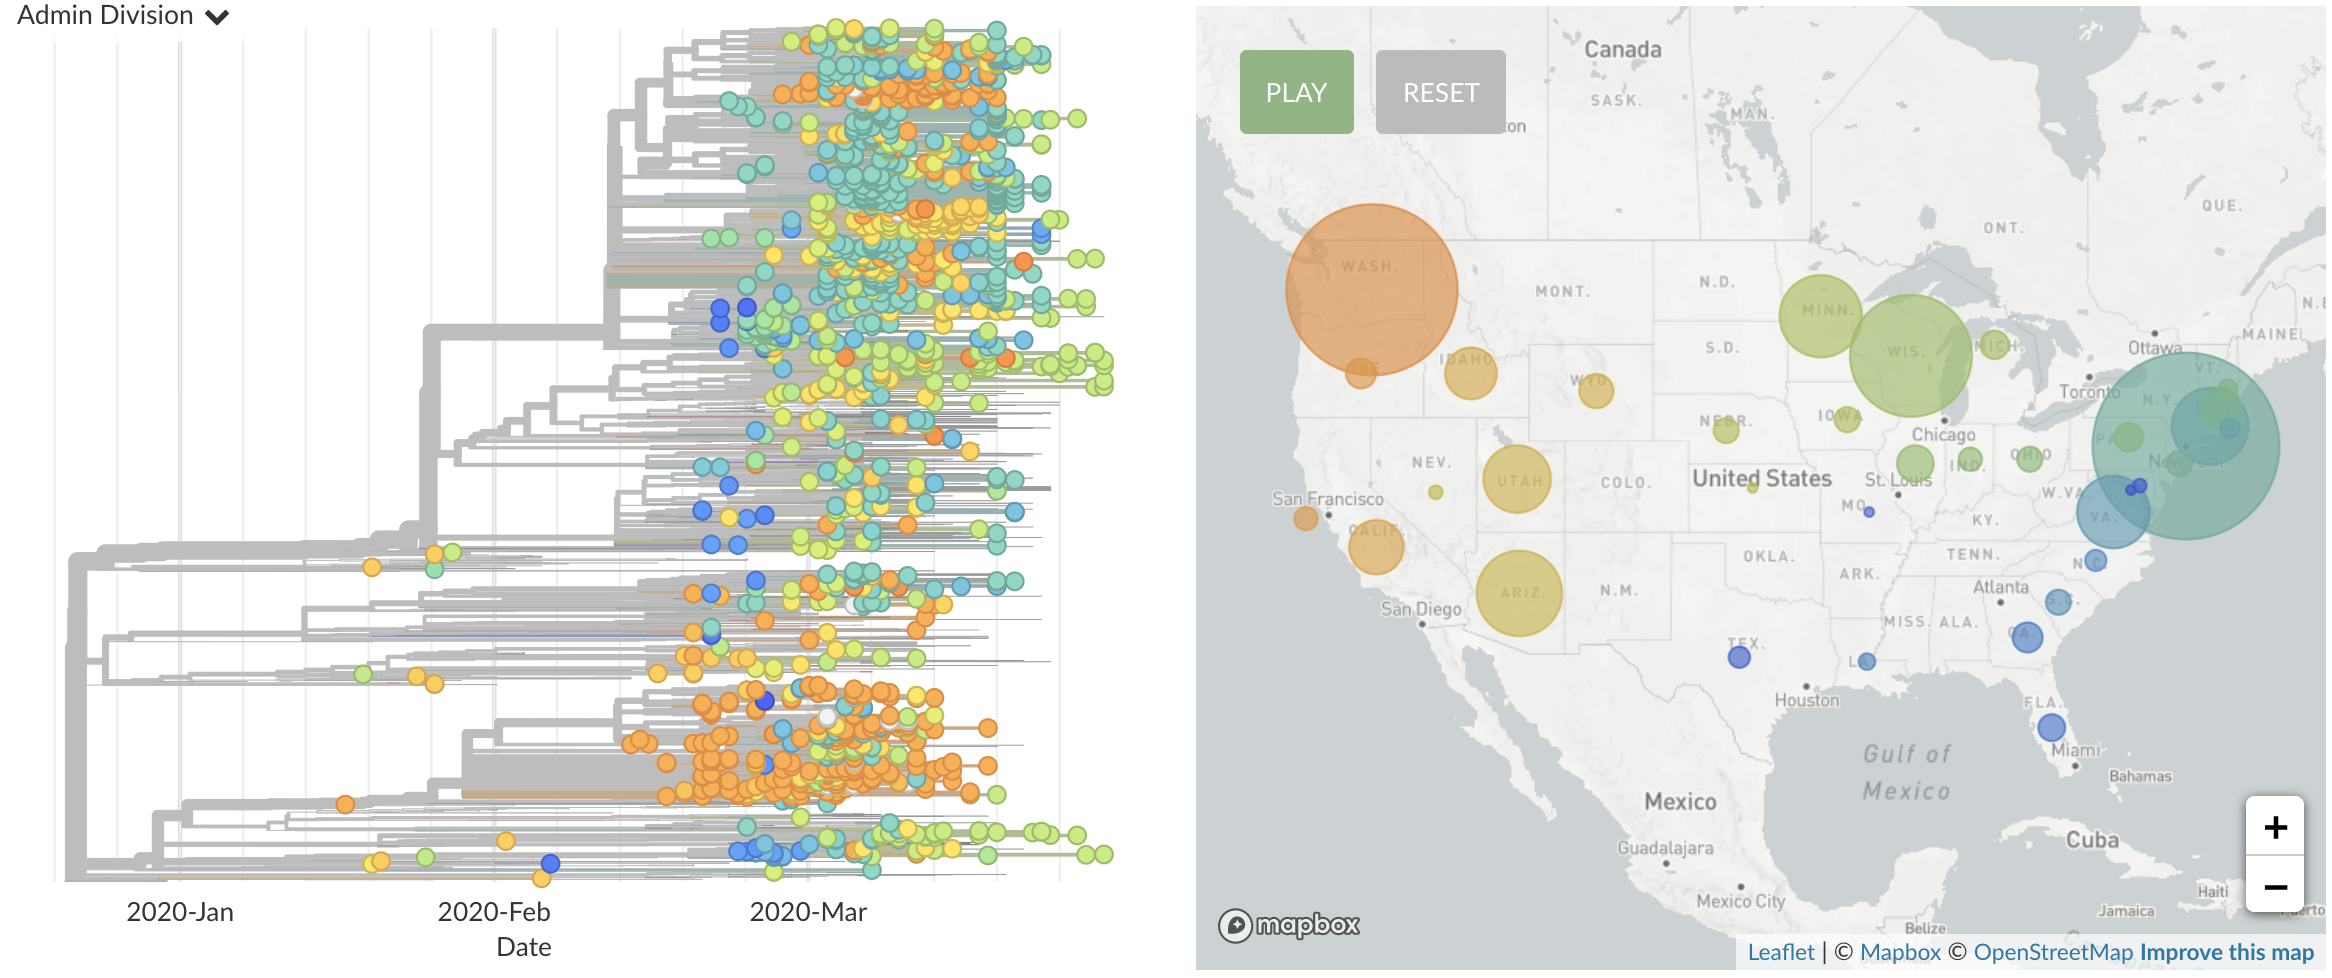
Single introduction ~Feb 1 quickly shows up throughout the country
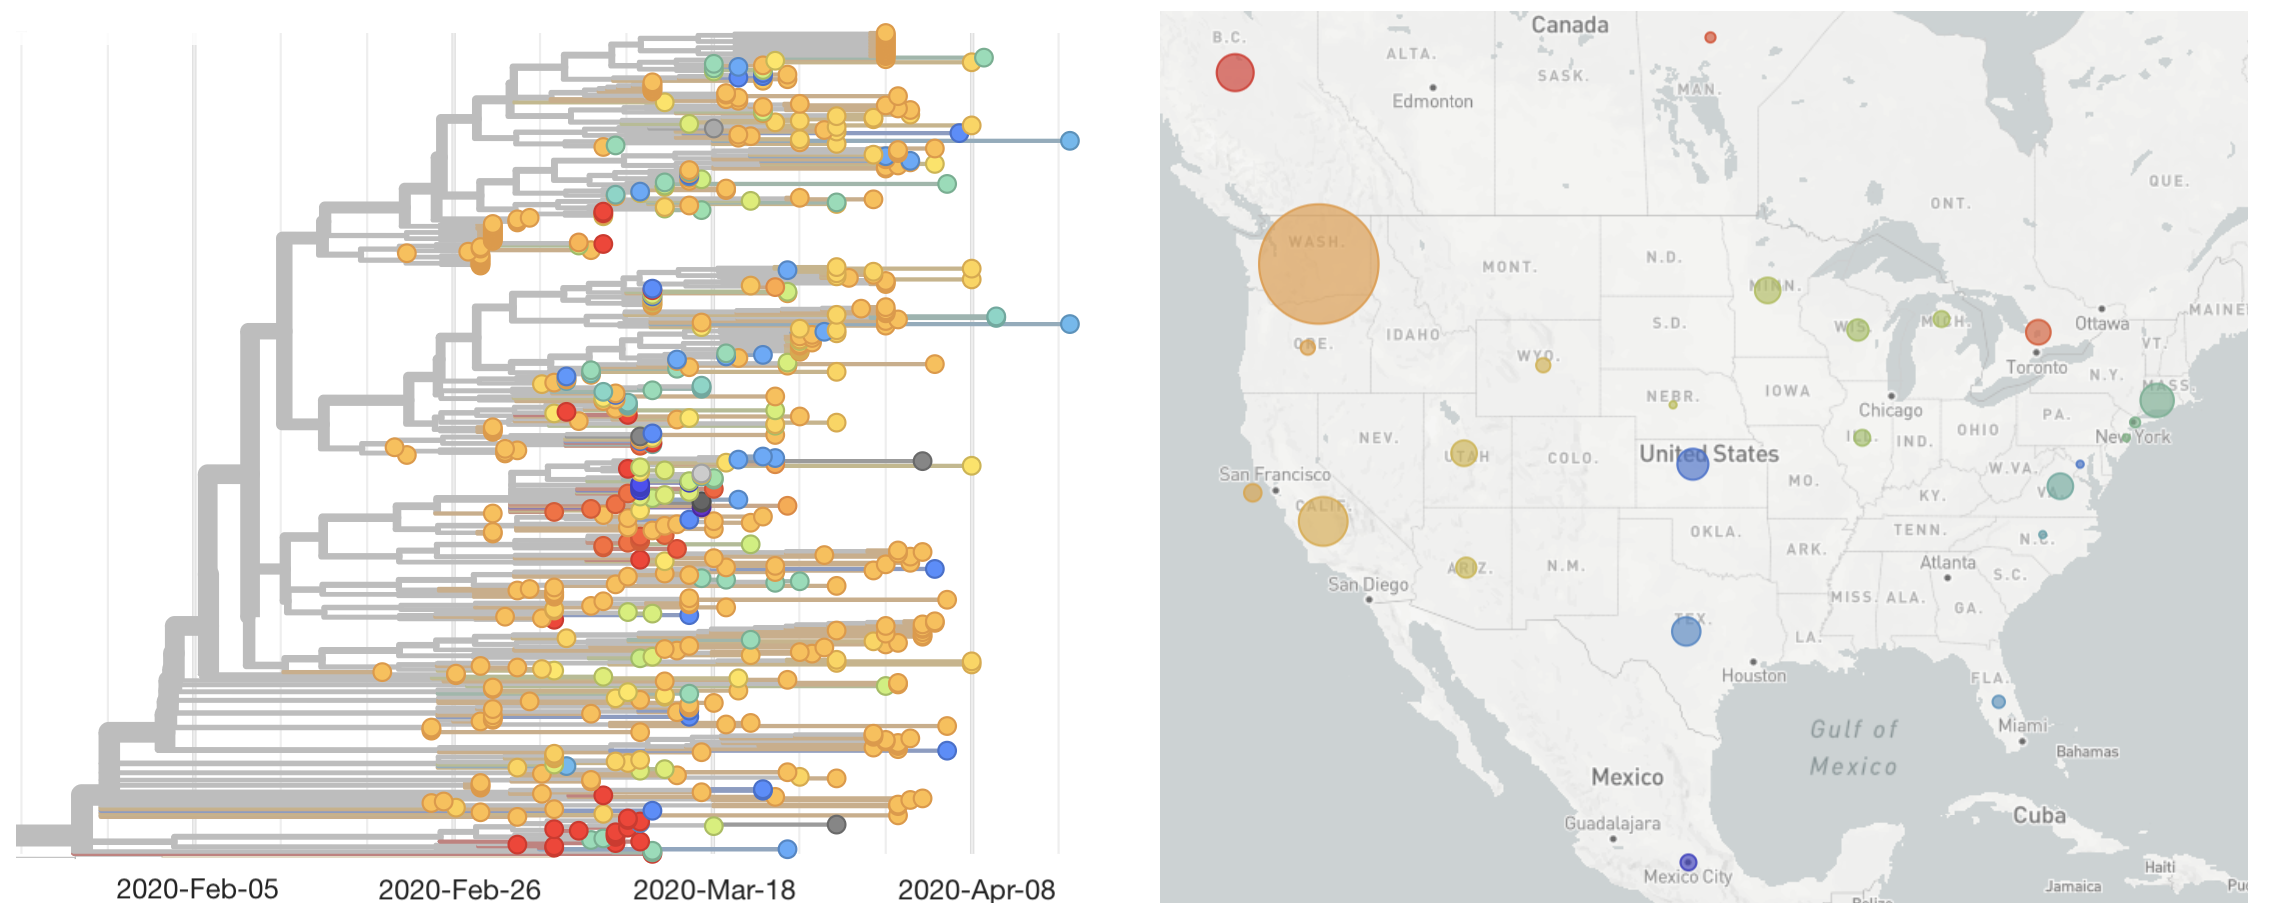
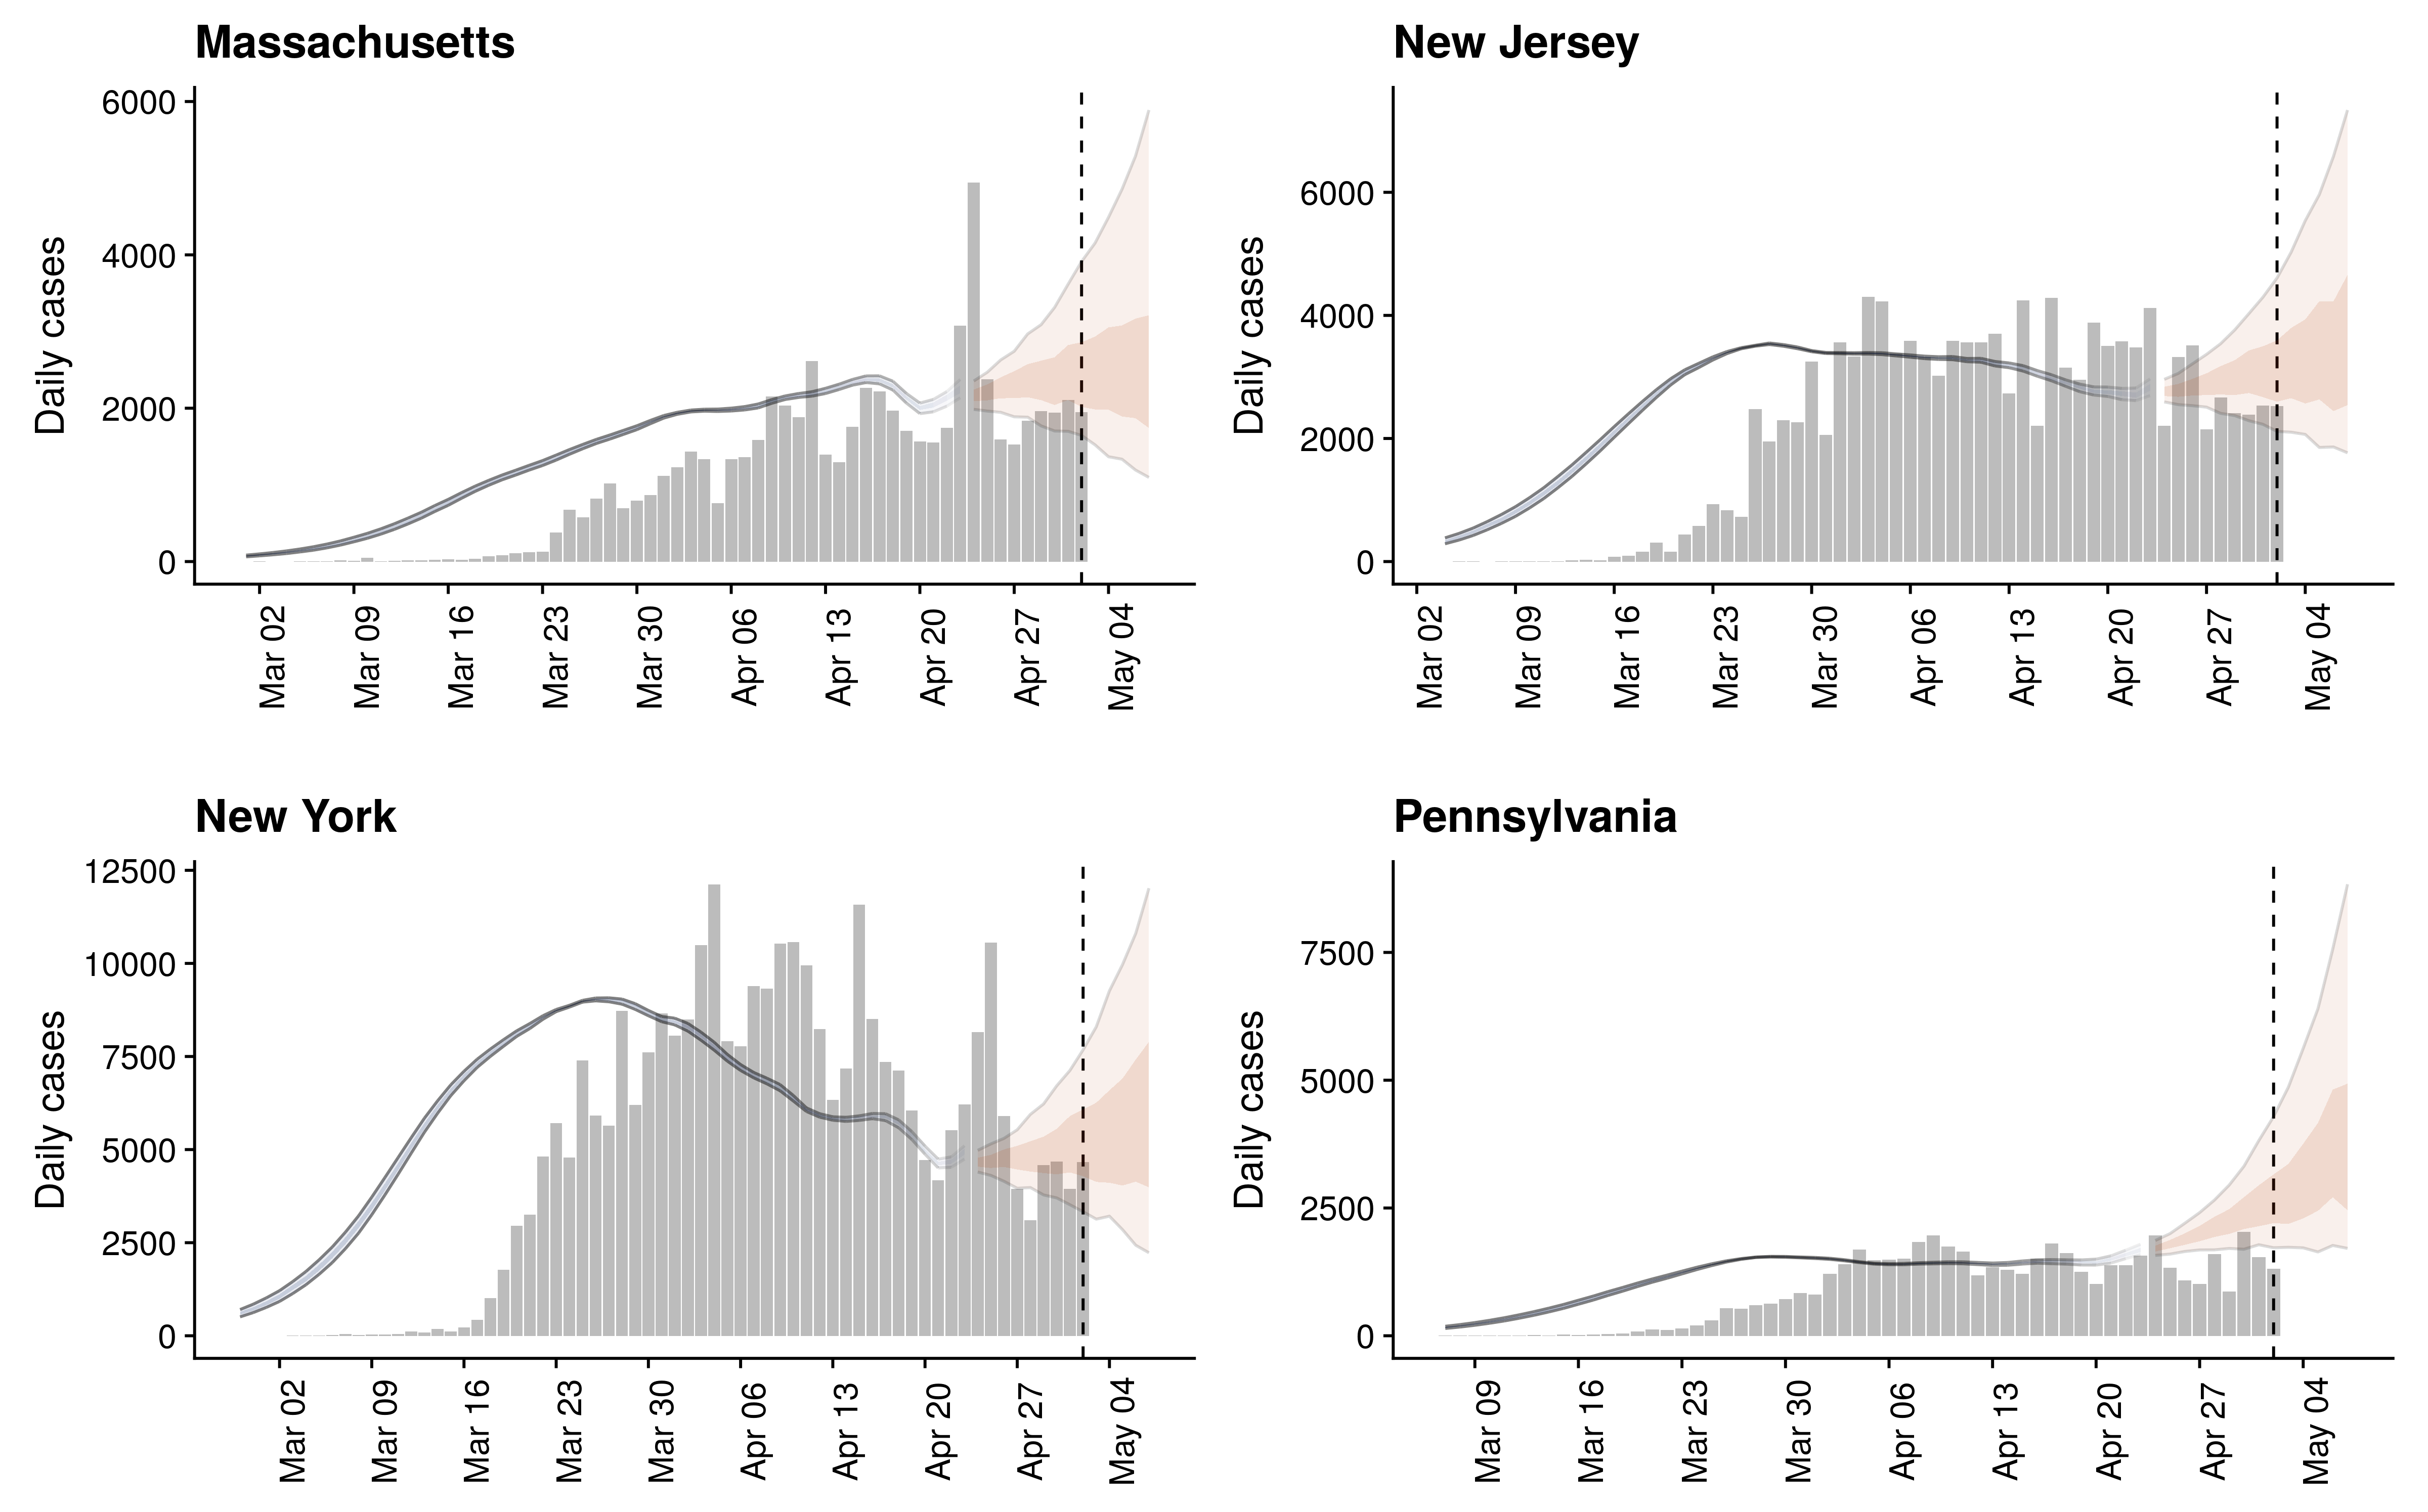
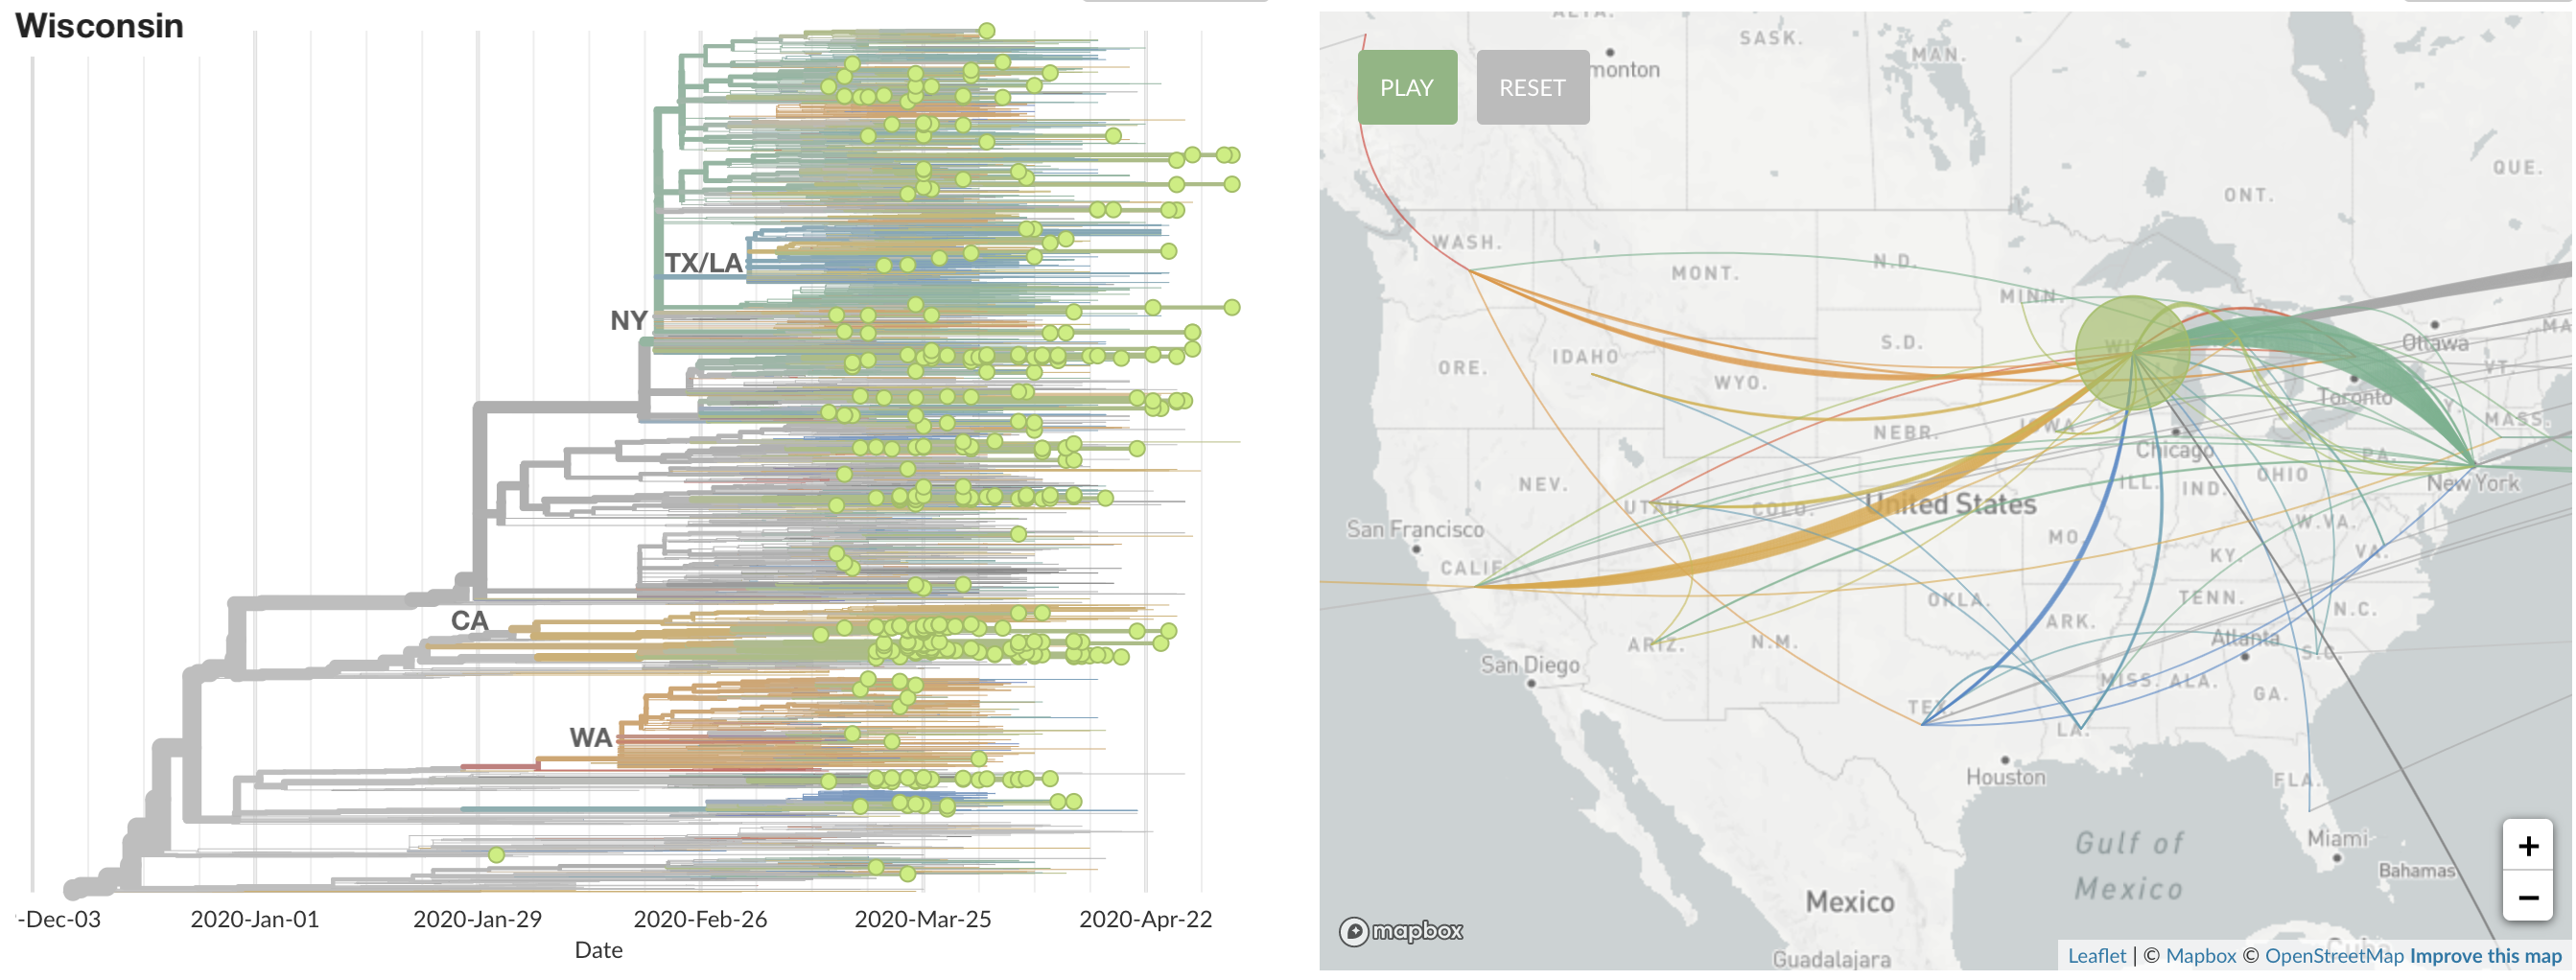
States show different patterns
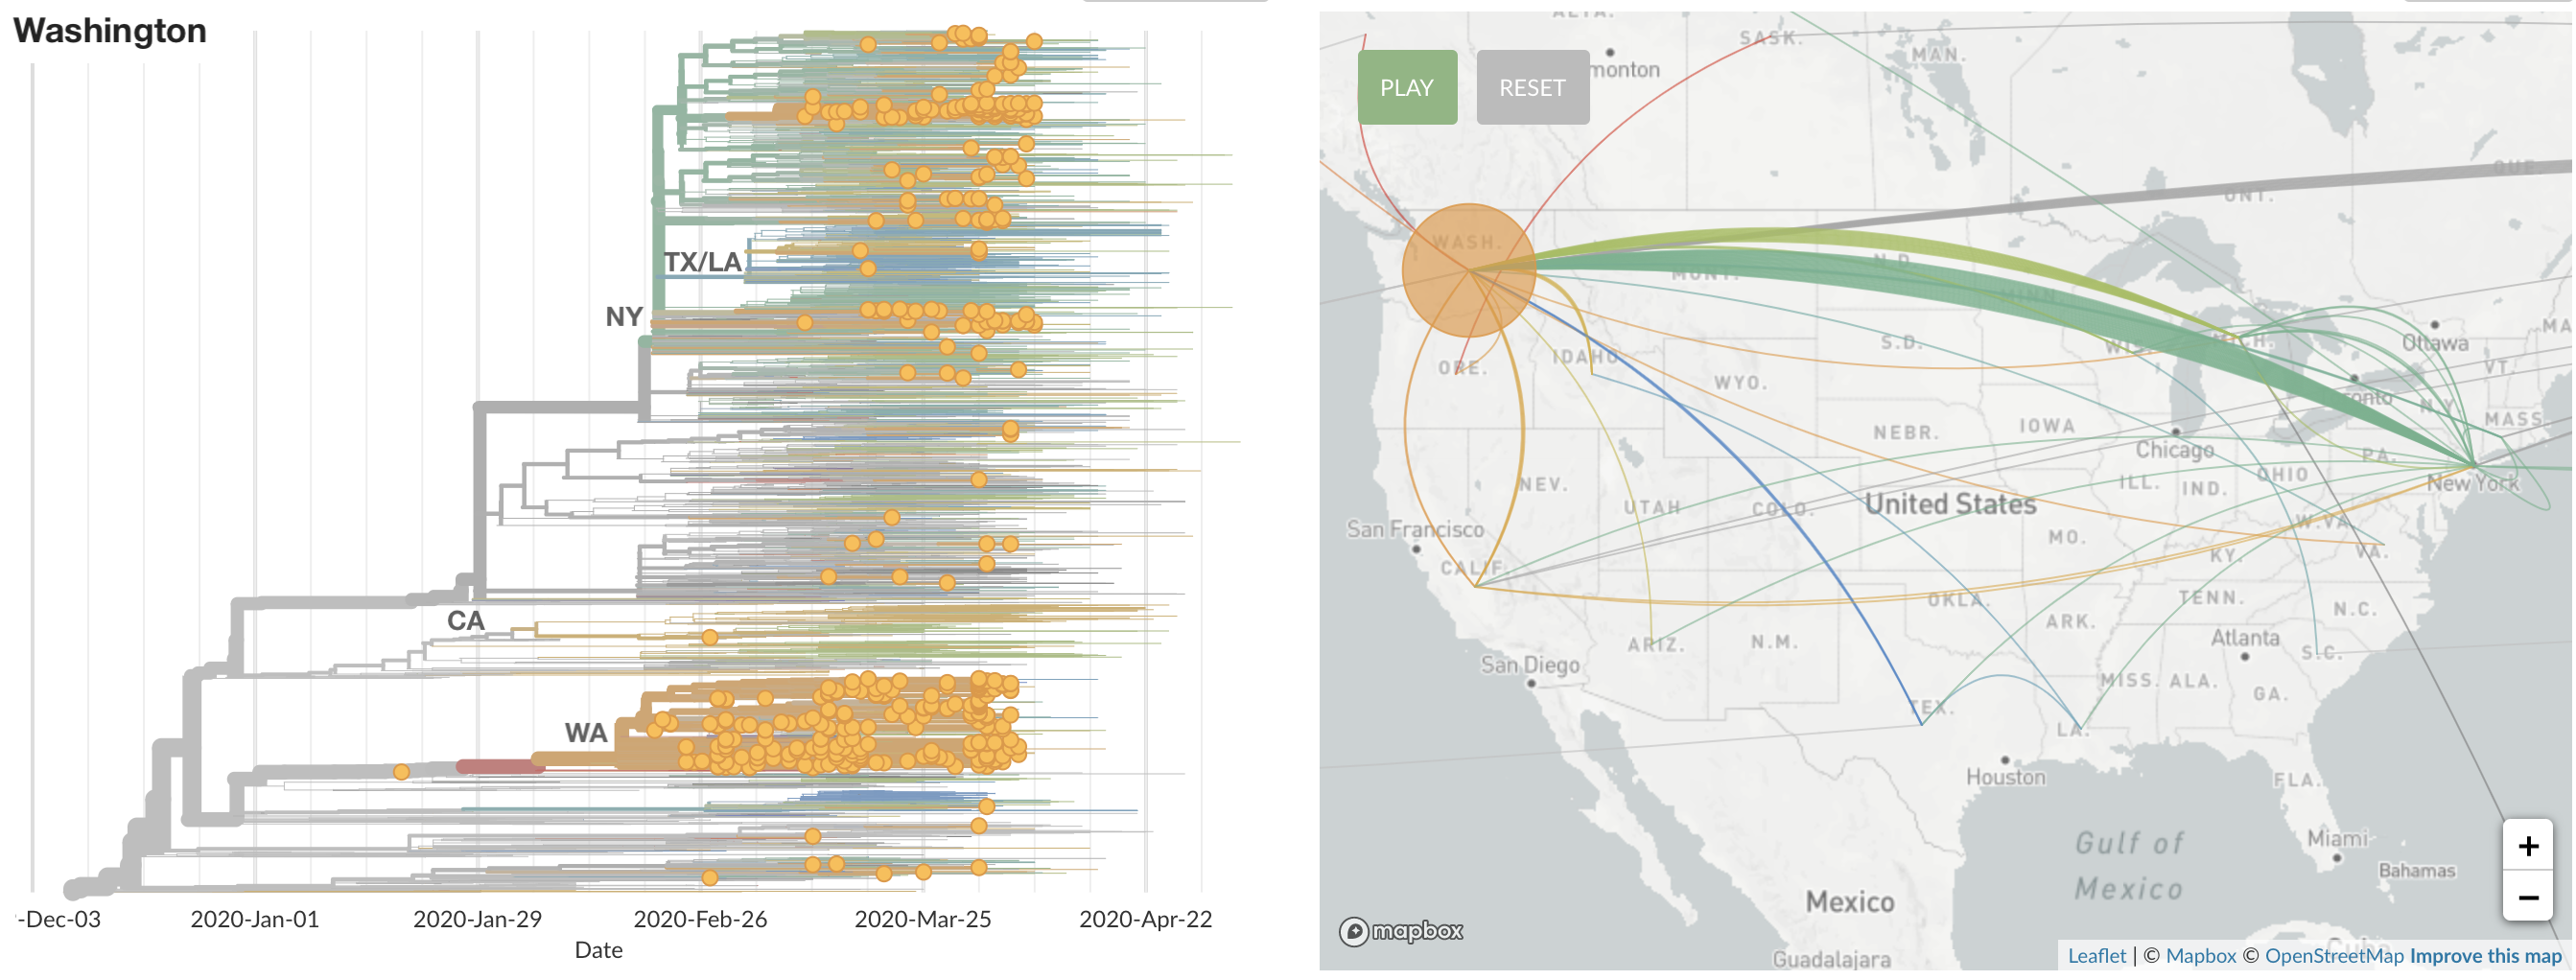
States show different patterns
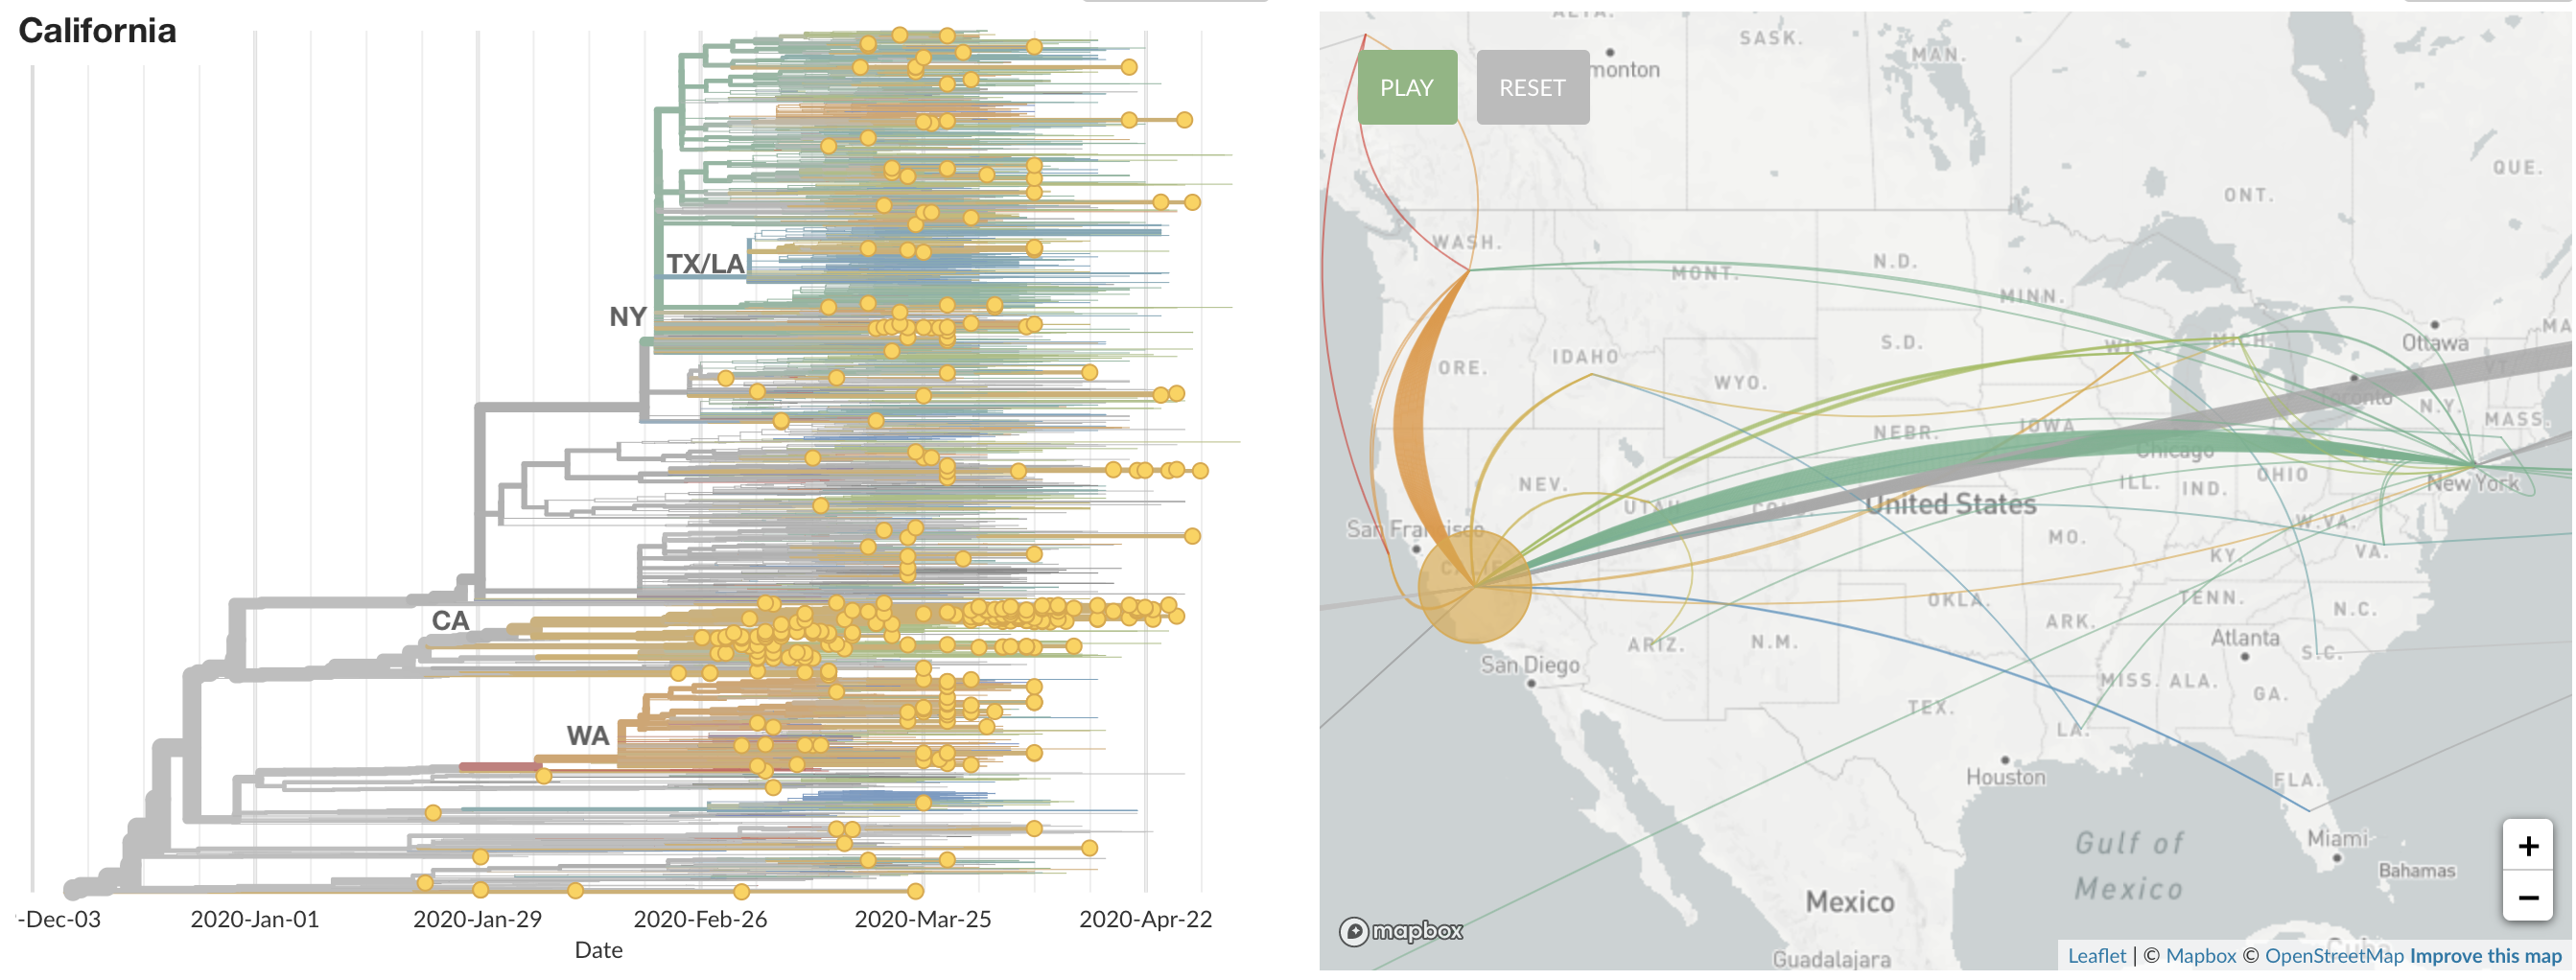
States show different patterns
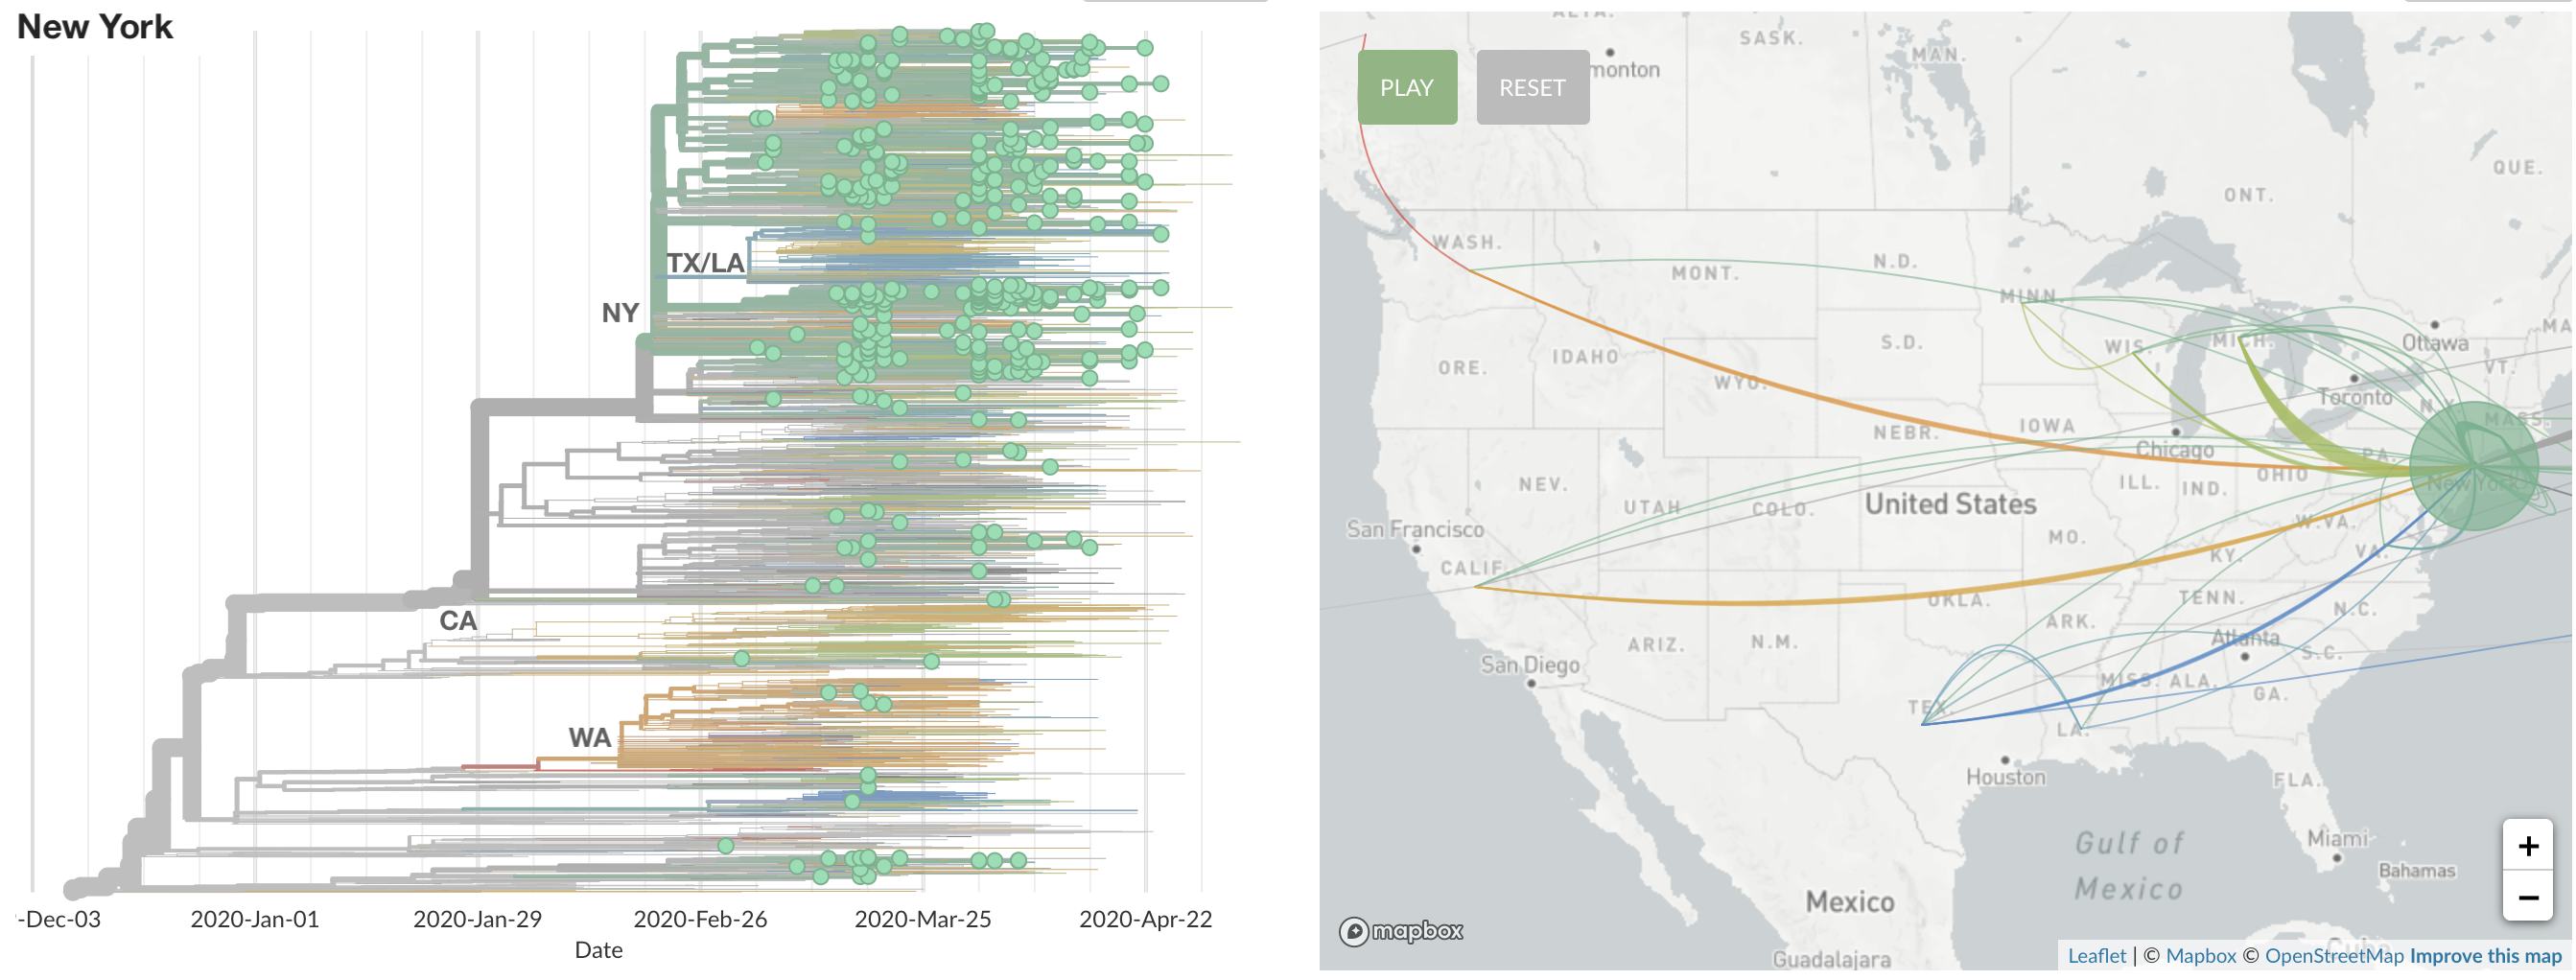
States show different patterns
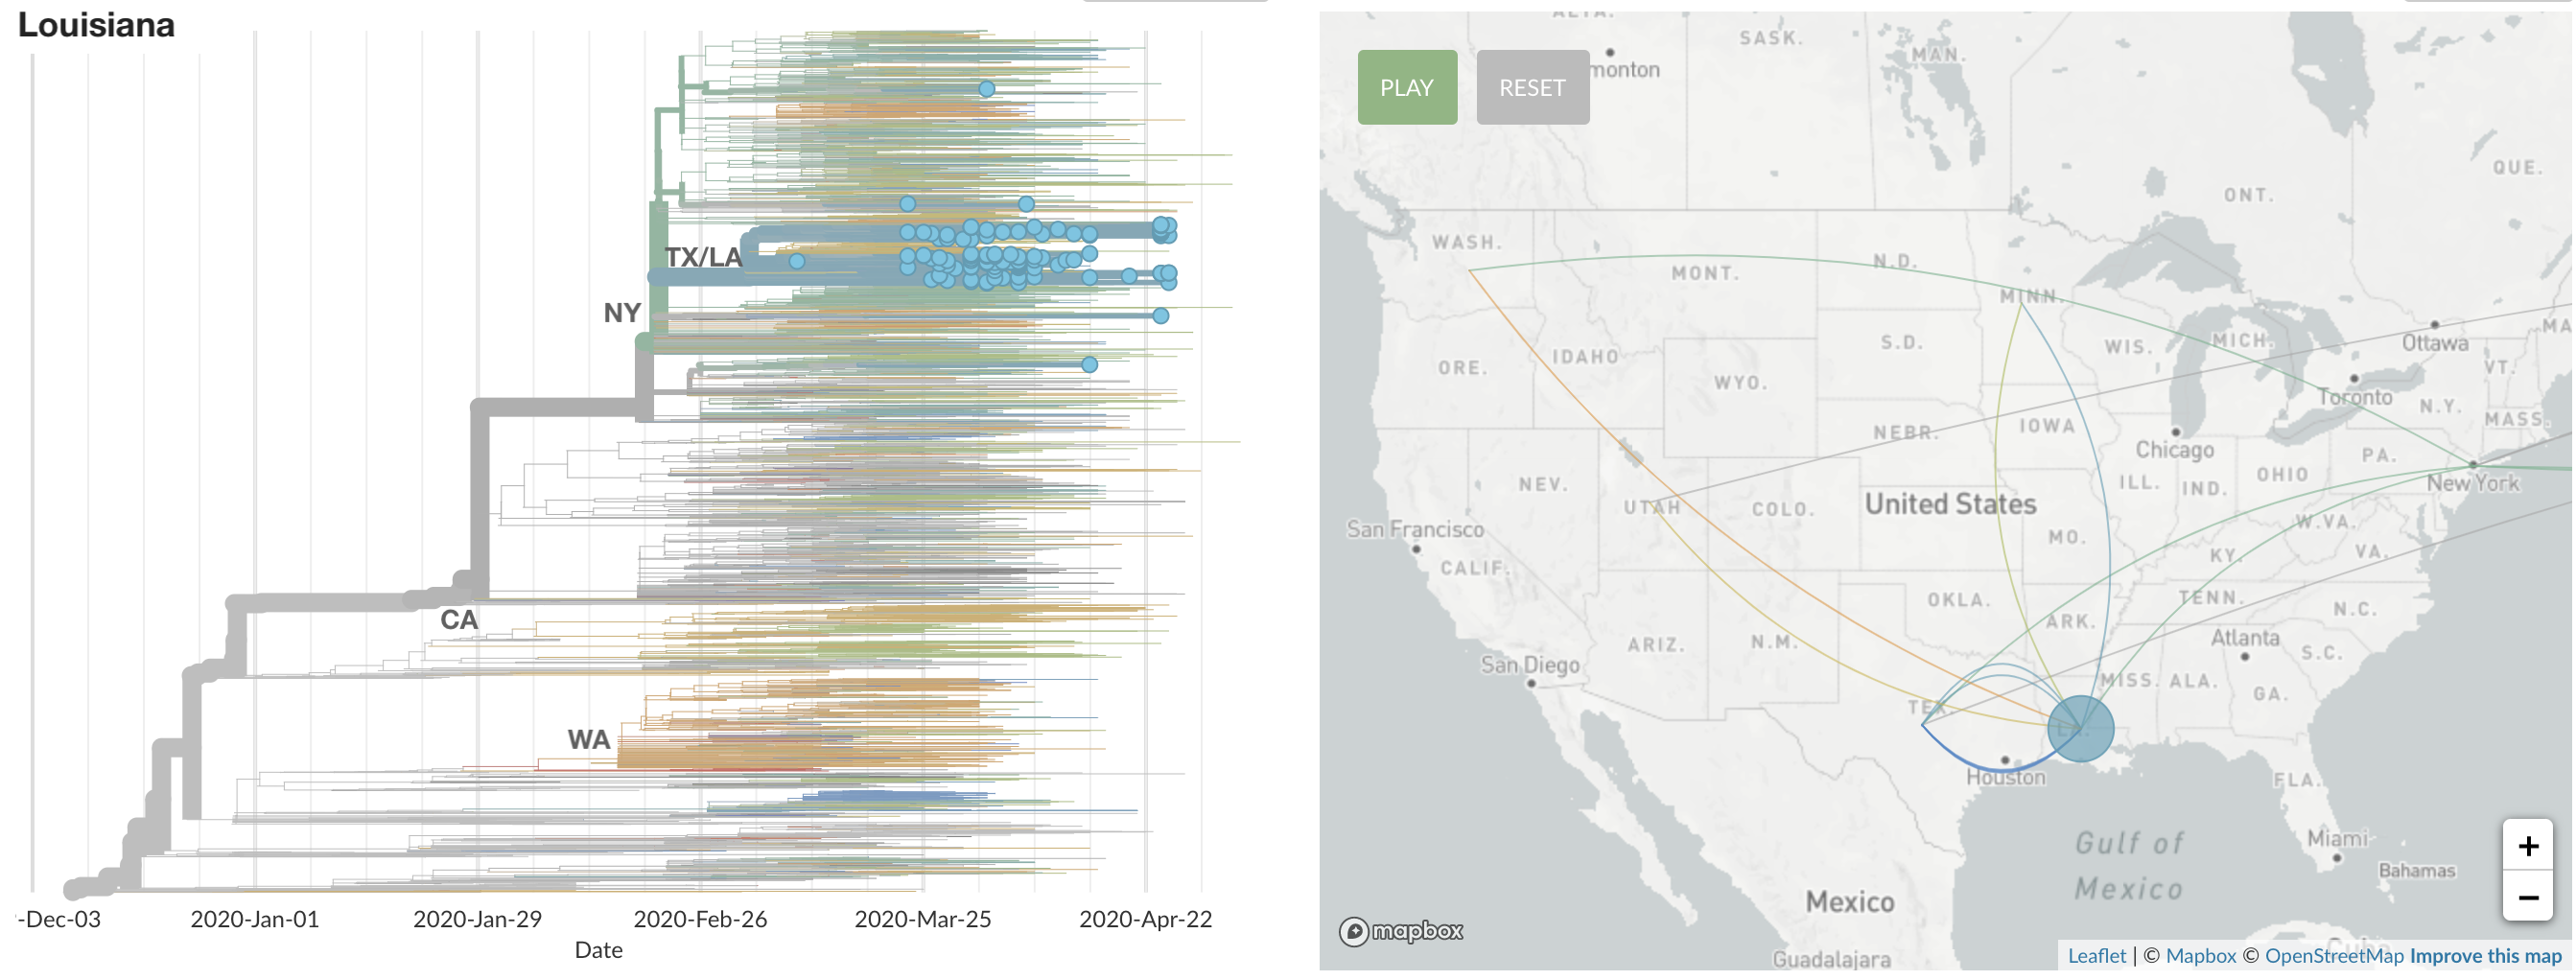
States show different patterns
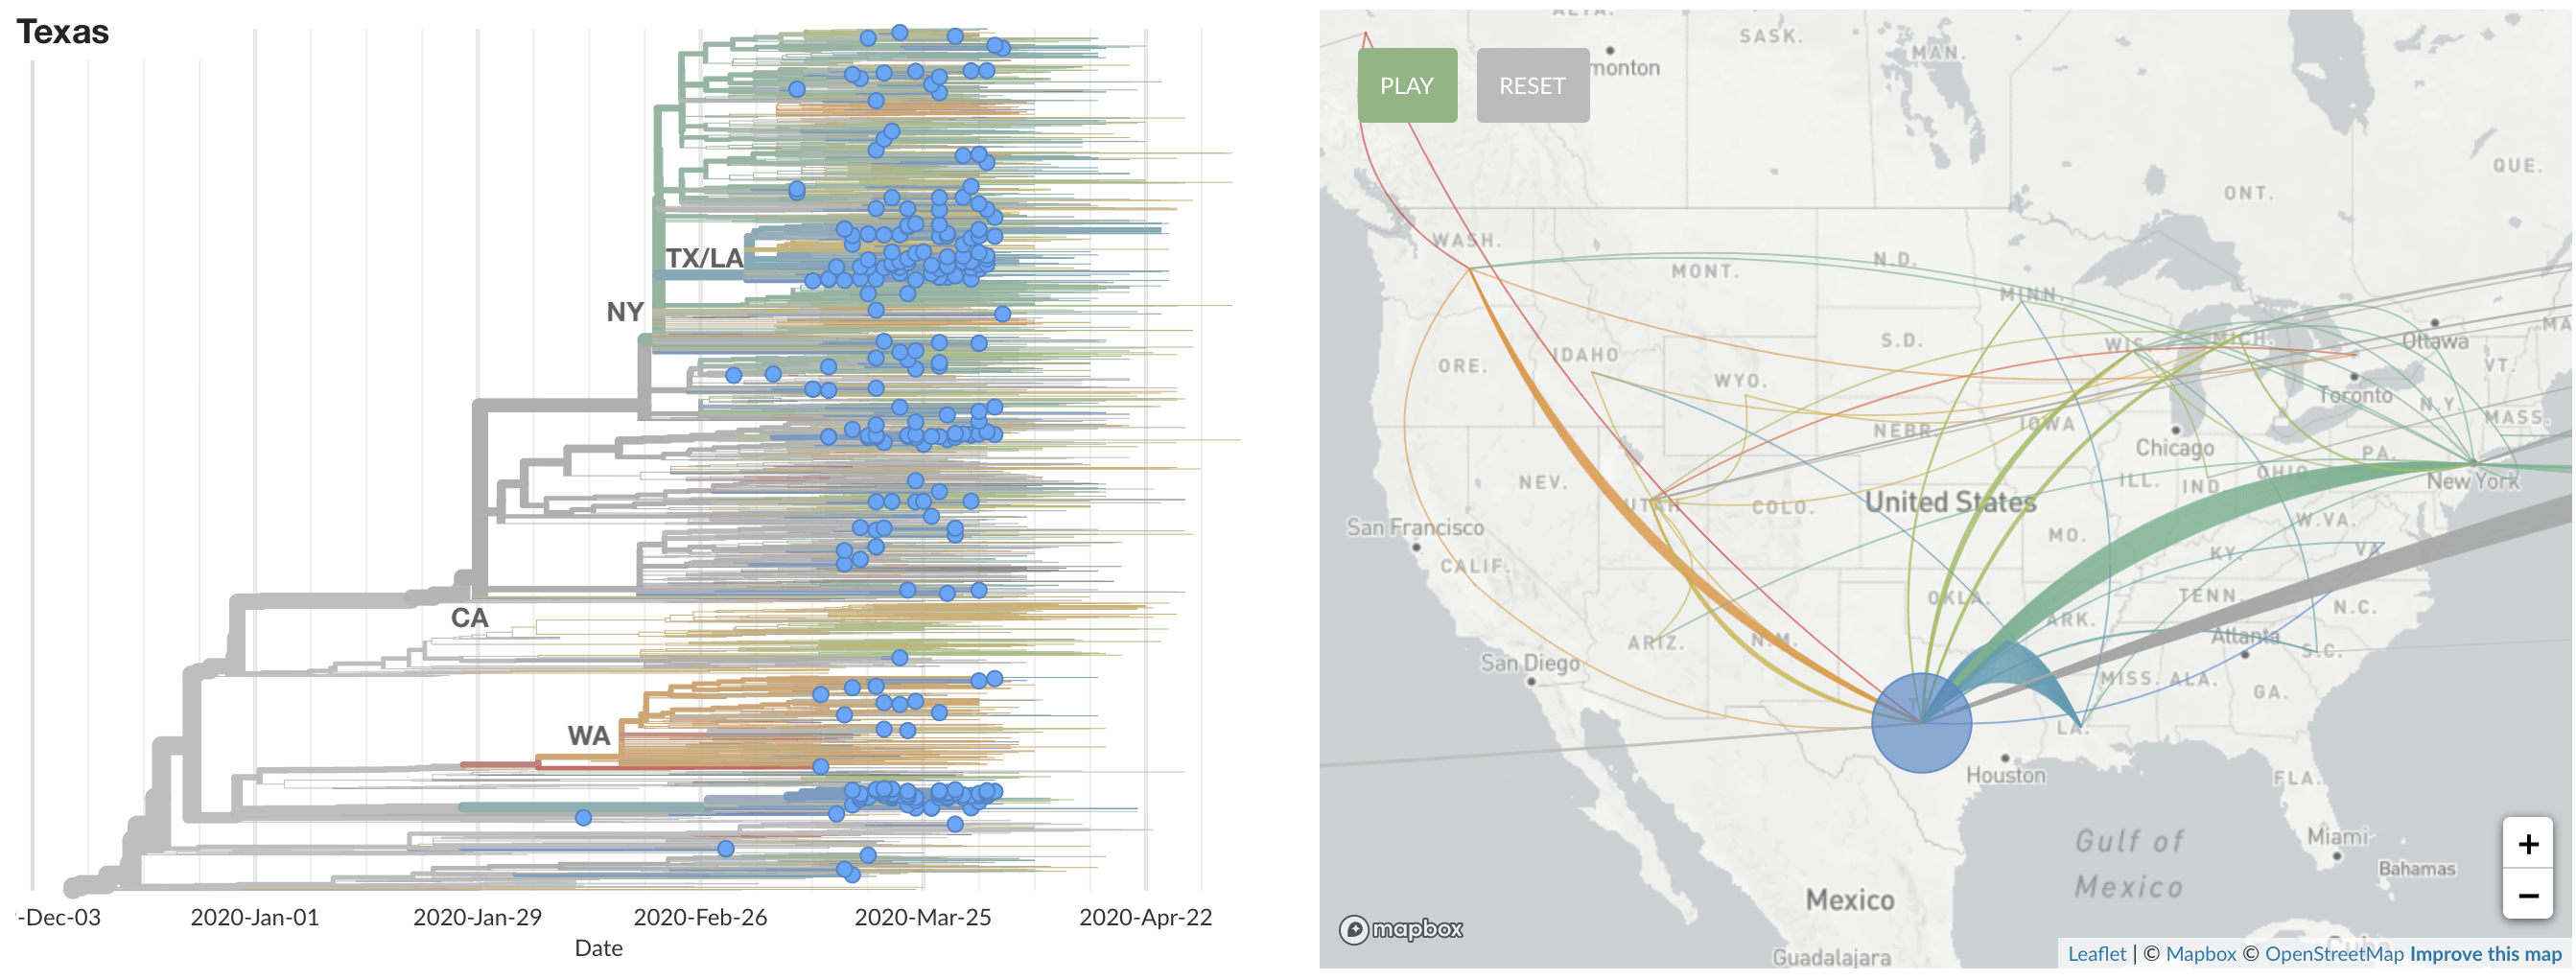
States show different patterns
Dive into phylogeny
Generally, phylodynamic inference allows us to:
- Infer changes in population size, ie prevalence, through time
- Infer spatial movements of the epidemic and patterns of seeding
- Infer differences in transmission rates between genetic variants
- Support contact tracing investigations